

Key Insights
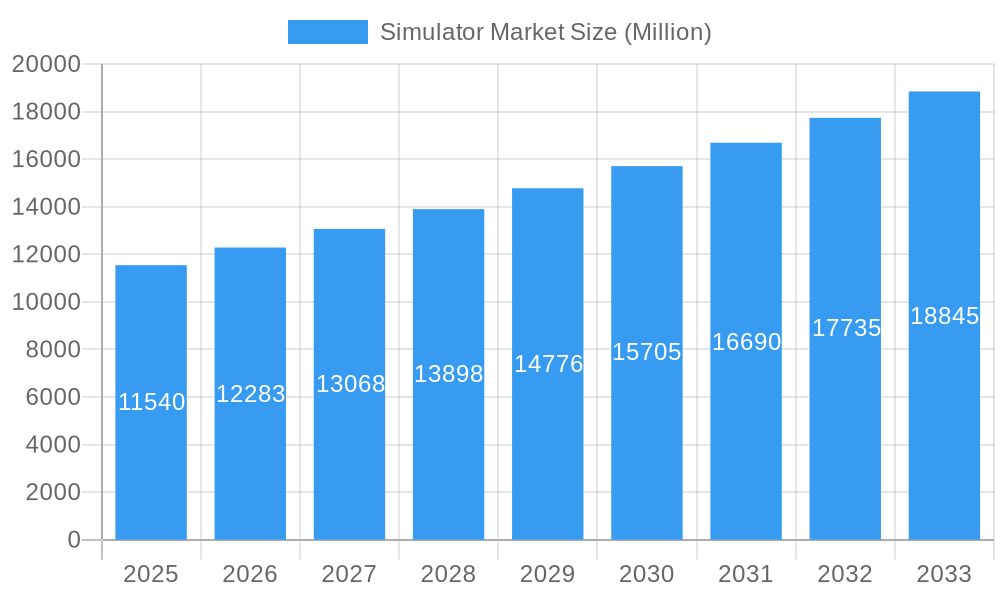
The global simulator market, valued at $11.54 billion in 2025, is projected to experience robust growth, exhibiting a Compound Annual Growth Rate (CAGR) of 6.45% from 2025 to 2033. This expansion is driven by several key factors. Firstly, the increasing demand for advanced training solutions across various sectors, including aviation, defense, and maritime, fuels the need for sophisticated and realistic simulators. The rising adoption of simulation technology for enhancing operator proficiency and reducing training costs further propels market growth. Furthermore, technological advancements, such as the incorporation of virtual reality (VR) and augmented reality (AR) features, are enhancing the realism and effectiveness of simulators, leading to increased adoption. Government initiatives focused on improving safety standards and training capabilities in critical sectors also contribute to this positive trajectory.
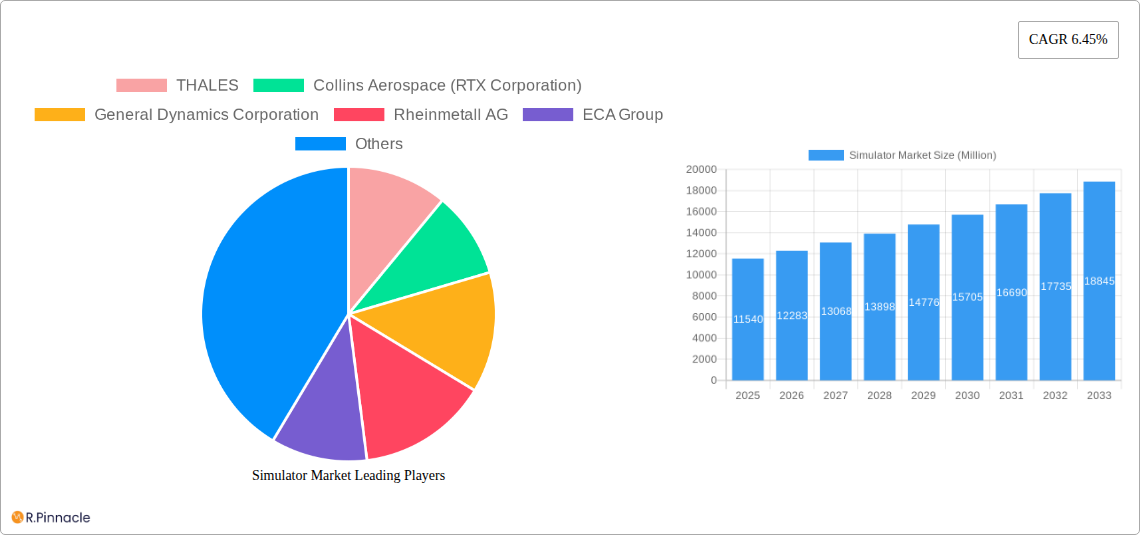
Simulator Market Market Size (In Billion)
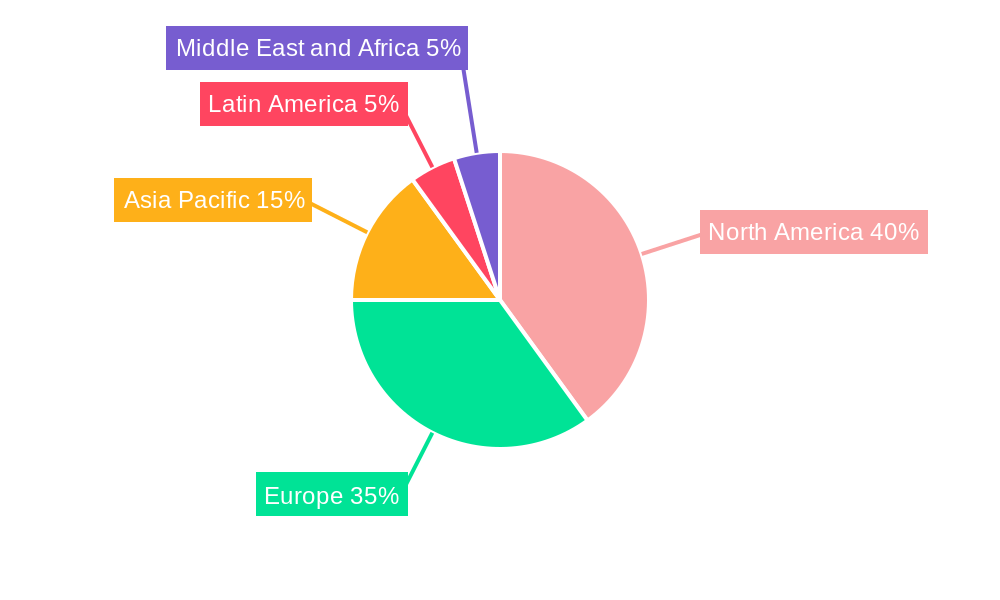
The market segmentation reveals a diverse landscape. The platform-based segmentation (Air, Land, Sea) indicates significant opportunities across all three sectors, with the aviation segment potentially leading due to stringent safety regulations and the rising number of air travel passengers. Key players like Thales, Collins Aerospace, General Dynamics, and others are actively contributing to innovation and market competition. Geographic analysis reveals significant regional variations, with North America and Europe currently holding substantial market share, driven by advanced technological infrastructure and robust defense budgets. However, the Asia-Pacific region is expected to witness the fastest growth rate over the forecast period, driven by expanding economies and increased investments in infrastructure development. The restraints to market growth include high initial investment costs associated with simulator development and deployment, as well as the need for continuous updates and maintenance to keep pace with technological advancements.
Simulator Market Company Market Share
Simulator Market: A Comprehensive Report (2019-2033)
This in-depth report provides a comprehensive analysis of the global Simulator Market, offering invaluable insights for industry professionals, investors, and strategic decision-makers. Covering the period from 2019 to 2033, with a focus on 2025, this study meticulously examines market structure, dynamics, leading players, and future growth potential. The report leverages extensive data analysis to project a robust understanding of the market's trajectory, including detailed segment breakdowns and regional performance. The $XX Million market is poised for significant expansion, presenting both challenges and remarkable opportunities.
Simulator Market Structure & Innovation Trends
The Simulator Market exhibits a moderately concentrated structure, with key players like Thales, Collins Aerospace, and CAE Inc. holding significant market share. The combined market share of the top 5 players is estimated at xx%. Innovation within the sector is driven primarily by advancements in simulation technology, including the integration of VR/AR, AI, and improved haptic feedback systems. Regulatory frameworks, particularly concerning safety and certification, influence product development and adoption rates. Product substitutes, such as virtual reality training platforms, pose a mild competitive threat. The end-user demographics are primarily military and civilian aviation, along with sectors like maritime and land-based vehicle training. The last five years have seen a modest level of M&A activity, with deal values totaling approximately $XX Million.
- Market Concentration: Top 5 players hold xx% market share.
- Innovation Drivers: VR/AR integration, AI, advanced haptics.
- Regulatory Landscape: Safety and certification standards impact development.
- M&A Activity: Total deal value over the past five years: approximately $XX Million.
Simulator Market Dynamics & Trends
The Simulator Market is experiencing robust growth, driven by increasing demand for advanced training solutions across various industries. The rising adoption of simulators for enhanced training efficacy and cost savings fuels market expansion. Technological advancements, particularly in virtual and augmented reality, are significantly disrupting traditional training methodologies. Consumer preferences are shifting towards more immersive and realistic training experiences. Competitive dynamics are characterized by ongoing innovation, strategic partnerships, and a focus on delivering customized solutions. The compound annual growth rate (CAGR) for the period 2025-2033 is projected at xx%, with market penetration expected to reach xx% by 2033.
Dominant Regions & Segments in Simulator Market
The Air segment currently dominates the Simulator Market, accounting for approximately xx% of the total market value in 2025. North America is the leading region, driven by significant investments in defense and aerospace sectors, coupled with robust technological advancements.
Key Drivers for Air Segment Dominance:
- High investment in defense and commercial aviation.
- Strong technological innovation in flight simulation.
- Stringent safety regulations driving simulator adoption.
North American Market Leadership:
- Significant government funding for defense training.
- Presence of major simulator manufacturers.
- High adoption rate of advanced simulation technologies.
The Land and Sea segments are projected to experience significant growth, particularly in emerging economies with increasing infrastructure development and defense modernization programs.
Simulator Market Product Innovations
Recent product developments focus on enhancing realism and immersion through VR/AR integration, advanced haptic feedback, and AI-powered adaptive training scenarios. These innovations offer competitive advantages by providing more engaging and effective training experiences, leading to improved skill acquisition and reduced training costs. The market is witnessing a strong trend toward modular and customizable simulator systems that cater to specific training needs and budgets.
Report Scope & Segmentation Analysis
This report comprehensively segments the Simulator Market across three key platforms: Air, Land, and Sea.
Air Segment: This segment dominates the market, with projections indicating continued growth driven by the burgeoning aviation industry. Market size is estimated at $XX Million in 2025. Competitive dynamics are intense, with numerous established and emerging players vying for market share.
Land Segment: This segment shows steady growth, fueled by the increasing need for effective training in defense and civilian sectors. The 2025 market size is projected at $XX Million. Key players focus on developing sophisticated driving and combat simulators.
Sea Segment: The Sea segment demonstrates moderate growth potential, driven by demand for enhanced training within the maritime industry. In 2025, the market size is estimated at $XX Million. Competition is focused on specialized ship handling and naval warfare simulators.
Key Drivers of Simulator Market Growth
The Simulator Market is propelled by several key factors:
- Growing demand for effective and cost-efficient training solutions across diverse sectors.
- Technological advancements leading to more immersive and realistic simulation experiences.
- Stringent safety regulations in various industries mandating improved training standards.
- Increasing investments in defense and aerospace sectors worldwide.
Challenges in the Simulator Market Sector
The Simulator Market faces several challenges:
- High initial investment costs for advanced simulator systems.
- The need for continuous software and hardware upgrades to maintain realism.
- Competition from alternative training methods, such as virtual reality applications.
- Supply chain disruptions potentially impacting production and delivery timelines.
Emerging Opportunities in Simulator Market
The Simulator Market presents several exciting opportunities:
- Expansion into new application areas, such as healthcare and industrial training.
- Development of cloud-based simulation platforms offering improved accessibility and cost-effectiveness.
- Integration of AI and machine learning for personalized and adaptive training.
- Growth in emerging markets with expanding defense and civilian training needs.
Leading Players in the Simulator Market Market
- THALES
- Collins Aerospace (RTX Corporation)
- General Dynamics Corporation
- Rheinmetall AG
- ECA Group
- RUAG Group
- FAAC Incorporated
- FRASCA International Inc
- CAE Inc
- VSTEP BV
- Kongsberg Gruppen AS
- Krauss-Maffei Wegmann GmbH & Co KG
- FlightSafety International Inc
Key Developments in Simulator Market Industry
- 2022-Q4: CAE Inc. launched a new generation of flight training simulators with enhanced VR capabilities.
- 2023-Q1: Thales partnered with a leading AI company to integrate AI-powered training scenarios into its simulator offerings.
- 2023-Q2: A significant merger between two mid-sized simulator manufacturers reshaped market dynamics.
- 2024-Q1: Collins Aerospace introduced a new modular simulator platform designed for flexible configurations and easier upgrades.
Future Outlook for Simulator Market Market
The Simulator Market is poised for sustained growth, driven by continuous technological advancements, expanding application domains, and increasing demand for superior training solutions. Strategic partnerships, focus on innovation, and effective market penetration strategies will be critical for success in this dynamic and evolving landscape. The market is expected to reach $XX Million by 2033, representing substantial opportunities for established players and new entrants alike.
Simulator Market Segmentation
-
1. Platform
- 1.1. Air
- 1.2. Land
- 1.3. Sea
Simulator Market Segmentation By Geography
-
1. North America
- 1.1. United States
- 1.2. Canada
-
2. Europe
- 2.1. United Kingdom
- 2.2. France
- 2.3. Germany
- 2.4. Rest of Europe
-
3. Asia Pacific
- 3.1. China
- 3.2. India
- 3.3. Japan
- 3.4. South Korea
- 3.5. Rest of Asia Pacific
-
4. Latin America
- 4.1. Brazil
- 4.2. Rest of Latin America
-
5. Middle East and Africa
- 5.1. Saudi Arabia
- 5.2. United Arab Emirates
- 5.3. Turkey
- 5.4. Rest of the Middle East and Africa
Simulator Market Regional Market Share
Geographic Coverage of Simulator Market
Simulator Market REPORT HIGHLIGHTS
| Aspects | Details |
|---|---|
| Study Period | 2020-2034 |
| Base Year | 2025 |
| Estimated Year | 2026 |
| Forecast Period | 2026-2034 |
| Historical Period | 2020-2025 |
| Growth Rate | CAGR of 6.45% from 2020-2034 |
| Segmentation |
|
Table of Contents
- 1. Introduction
- 1.1. Research Scope
- 1.2. Market Segmentation
- 1.3. Research Objective
- 1.4. Definitions and Assumptions
- 2. Executive Summary
- 2.1. Market Snapshot
- 3. Market Dynamics
- 3.1. Market Drivers
- 3.2. Market Restrains
- 3.3. Market Trends
- 3.4. Market Opportunities
- 4. Market Factor Analysis
- 4.1. Porters Five Forces
- 4.1.1. Bargaining Power of Suppliers
- 4.1.2. Bargaining Power of Buyers
- 4.1.3. Threat of New Entrants
- 4.1.4. Threat of Substitutes
- 4.1.5. Competitive Rivalry
- 4.2. PESTEL analysis
- 4.3. BCG Analysis
- 4.3.1. Stars (High Growth, High Market Share)
- 4.3.2. Cash Cows (Low Growth, High Market Share)
- 4.3.3. Question Mark (High Growth, Low Market Share)
- 4.3.4. Dogs (Low Growth, Low Market Share)
- 4.4. Ansoff Matrix Analysis
- 4.5. Supply Chain Analysis
- 4.6. Regulatory Landscape
- 4.7. Current Market Potential and Opportunity Assessment (TAM–SAM–SOM Framework)
- 4.8. PRI Analyst Note
- 4.1. Porters Five Forces
- 5. Market Analysis, Insights and Forecast 2021-2033
- 5.1. Market Analysis, Insights and Forecast - by Platform
- 5.1.1. Air
- 5.1.2. Land
- 5.1.3. Sea
- 5.2. Market Analysis, Insights and Forecast - by Region
- 5.2.1. North America
- 5.2.2. Europe
- 5.2.3. Asia Pacific
- 5.2.4. Latin America
- 5.2.5. Middle East and Africa
- 5.1. Market Analysis, Insights and Forecast - by Platform
- 6. Global Simulator Market Analysis, Insights and Forecast, 2021-2033
- 6.1. Market Analysis, Insights and Forecast - by Platform
- 6.1.1. Air
- 6.1.2. Land
- 6.1.3. Sea
- 6.1. Market Analysis, Insights and Forecast - by Platform
- 7. North America Simulator Market Analysis, Insights and Forecast, 2020-2032
- 7.1. Market Analysis, Insights and Forecast - by Platform
- 7.1.1. Air
- 7.1.2. Land
- 7.1.3. Sea
- 7.1. Market Analysis, Insights and Forecast - by Platform
- 8. Europe Simulator Market Analysis, Insights and Forecast, 2020-2032
- 8.1. Market Analysis, Insights and Forecast - by Platform
- 8.1.1. Air
- 8.1.2. Land
- 8.1.3. Sea
- 8.1. Market Analysis, Insights and Forecast - by Platform
- 9. Asia Pacific Simulator Market Analysis, Insights and Forecast, 2020-2032
- 9.1. Market Analysis, Insights and Forecast - by Platform
- 9.1.1. Air
- 9.1.2. Land
- 9.1.3. Sea
- 9.1. Market Analysis, Insights and Forecast - by Platform
- 10. Latin America Simulator Market Analysis, Insights and Forecast, 2020-2032
- 10.1. Market Analysis, Insights and Forecast - by Platform
- 10.1.1. Air
- 10.1.2. Land
- 10.1.3. Sea
- 10.1. Market Analysis, Insights and Forecast - by Platform
- 11. Middle East and Africa Simulator Market Analysis, Insights and Forecast, 2020-2032
- 11.1. Market Analysis, Insights and Forecast - by Platform
- 11.1.1. Air
- 11.1.2. Land
- 11.1.3. Sea
- 11.1. Market Analysis, Insights and Forecast - by Platform
- 12. Competitive Analysis
- 12.1. Company Profiles
- 12.1.1 THALES
- 12.1.1.1. Company Overview
- 12.1.1.2. Products
- 12.1.1.3. Company Financials
- 12.1.1.4. SWOT Analysis
- 12.1.2 Collins Aerospace (RTX Corporation)
- 12.1.2.1. Company Overview
- 12.1.2.2. Products
- 12.1.2.3. Company Financials
- 12.1.2.4. SWOT Analysis
- 12.1.3 General Dynamics Corporation
- 12.1.3.1. Company Overview
- 12.1.3.2. Products
- 12.1.3.3. Company Financials
- 12.1.3.4. SWOT Analysis
- 12.1.4 Rheinmetall AG
- 12.1.4.1. Company Overview
- 12.1.4.2. Products
- 12.1.4.3. Company Financials
- 12.1.4.4. SWOT Analysis
- 12.1.5 ECA Group
- 12.1.5.1. Company Overview
- 12.1.5.2. Products
- 12.1.5.3. Company Financials
- 12.1.5.4. SWOT Analysis
- 12.1.6 RUAG Group
- 12.1.6.1. Company Overview
- 12.1.6.2. Products
- 12.1.6.3. Company Financials
- 12.1.6.4. SWOT Analysis
- 12.1.7 FAAC Incorporated
- 12.1.7.1. Company Overview
- 12.1.7.2. Products
- 12.1.7.3. Company Financials
- 12.1.7.4. SWOT Analysis
- 12.1.8 FRASCA International Inc
- 12.1.8.1. Company Overview
- 12.1.8.2. Products
- 12.1.8.3. Company Financials
- 12.1.8.4. SWOT Analysis
- 12.1.9 CAE Inc
- 12.1.9.1. Company Overview
- 12.1.9.2. Products
- 12.1.9.3. Company Financials
- 12.1.9.4. SWOT Analysis
- 12.1.10 VSTEP BV
- 12.1.10.1. Company Overview
- 12.1.10.2. Products
- 12.1.10.3. Company Financials
- 12.1.10.4. SWOT Analysis
- 12.1.11 Kongsberg Gruppen AS
- 12.1.11.1. Company Overview
- 12.1.11.2. Products
- 12.1.11.3. Company Financials
- 12.1.11.4. SWOT Analysis
- 12.1.12 Krauss-Maffei Wegmann GmbH & Co KG
- 12.1.12.1. Company Overview
- 12.1.12.2. Products
- 12.1.12.3. Company Financials
- 12.1.12.4. SWOT Analysis
- 12.1.13 FlightSafety International Inc
- 12.1.13.1. Company Overview
- 12.1.13.2. Products
- 12.1.13.3. Company Financials
- 12.1.13.4. SWOT Analysis
- 12.1.1 THALES
- 12.2. Market Entropy
- 12.2.1 Company's Key Areas Served
- 12.2.2 Recent Developments
- 12.3. Company Market Share Analysis 2025
- 12.3.1 Top 5 Companies Market Share Analysis
- 12.3.2 Top 3 Companies Market Share Analysis
- 12.4. List of Potential Customers
- 13. Research Methodology
List of Figures
- Figure 1: Global Simulator Market Revenue Breakdown (Million, %) by Region 2025 & 2033
- Figure 2: North America Simulator Market Revenue (Million), by Platform 2025 & 2033
- Figure 3: North America Simulator Market Revenue Share (%), by Platform 2025 & 2033
- Figure 4: North America Simulator Market Revenue (Million), by Country 2025 & 2033
- Figure 5: North America Simulator Market Revenue Share (%), by Country 2025 & 2033
- Figure 6: Europe Simulator Market Revenue (Million), by Platform 2025 & 2033
- Figure 7: Europe Simulator Market Revenue Share (%), by Platform 2025 & 2033
- Figure 8: Europe Simulator Market Revenue (Million), by Country 2025 & 2033
- Figure 9: Europe Simulator Market Revenue Share (%), by Country 2025 & 2033
- Figure 10: Asia Pacific Simulator Market Revenue (Million), by Platform 2025 & 2033
- Figure 11: Asia Pacific Simulator Market Revenue Share (%), by Platform 2025 & 2033
- Figure 12: Asia Pacific Simulator Market Revenue (Million), by Country 2025 & 2033
- Figure 13: Asia Pacific Simulator Market Revenue Share (%), by Country 2025 & 2033
- Figure 14: Latin America Simulator Market Revenue (Million), by Platform 2025 & 2033
- Figure 15: Latin America Simulator Market Revenue Share (%), by Platform 2025 & 2033
- Figure 16: Latin America Simulator Market Revenue (Million), by Country 2025 & 2033
- Figure 17: Latin America Simulator Market Revenue Share (%), by Country 2025 & 2033
- Figure 18: Middle East and Africa Simulator Market Revenue (Million), by Platform 2025 & 2033
- Figure 19: Middle East and Africa Simulator Market Revenue Share (%), by Platform 2025 & 2033
- Figure 20: Middle East and Africa Simulator Market Revenue (Million), by Country 2025 & 2033
- Figure 21: Middle East and Africa Simulator Market Revenue Share (%), by Country 2025 & 2033
List of Tables
- Table 1: Global Simulator Market Revenue Million Forecast, by Platform 2020 & 2033
- Table 2: Global Simulator Market Revenue Million Forecast, by Region 2020 & 2033
- Table 3: Global Simulator Market Revenue Million Forecast, by Platform 2020 & 2033
- Table 4: Global Simulator Market Revenue Million Forecast, by Country 2020 & 2033
- Table 5: United States Simulator Market Revenue (Million) Forecast, by Application 2020 & 2033
- Table 6: Canada Simulator Market Revenue (Million) Forecast, by Application 2020 & 2033
- Table 7: Global Simulator Market Revenue Million Forecast, by Platform 2020 & 2033
- Table 8: Global Simulator Market Revenue Million Forecast, by Country 2020 & 2033
- Table 9: United Kingdom Simulator Market Revenue (Million) Forecast, by Application 2020 & 2033
- Table 10: France Simulator Market Revenue (Million) Forecast, by Application 2020 & 2033
- Table 11: Germany Simulator Market Revenue (Million) Forecast, by Application 2020 & 2033
- Table 12: Rest of Europe Simulator Market Revenue (Million) Forecast, by Application 2020 & 2033
- Table 13: Global Simulator Market Revenue Million Forecast, by Platform 2020 & 2033
- Table 14: Global Simulator Market Revenue Million Forecast, by Country 2020 & 2033
- Table 15: China Simulator Market Revenue (Million) Forecast, by Application 2020 & 2033
- Table 16: India Simulator Market Revenue (Million) Forecast, by Application 2020 & 2033
- Table 17: Japan Simulator Market Revenue (Million) Forecast, by Application 2020 & 2033
- Table 18: South Korea Simulator Market Revenue (Million) Forecast, by Application 2020 & 2033
- Table 19: Rest of Asia Pacific Simulator Market Revenue (Million) Forecast, by Application 2020 & 2033
- Table 20: Global Simulator Market Revenue Million Forecast, by Platform 2020 & 2033
- Table 21: Global Simulator Market Revenue Million Forecast, by Country 2020 & 2033
- Table 22: Brazil Simulator Market Revenue (Million) Forecast, by Application 2020 & 2033
- Table 23: Rest of Latin America Simulator Market Revenue (Million) Forecast, by Application 2020 & 2033
- Table 24: Global Simulator Market Revenue Million Forecast, by Platform 2020 & 2033
- Table 25: Global Simulator Market Revenue Million Forecast, by Country 2020 & 2033
- Table 26: Saudi Arabia Simulator Market Revenue (Million) Forecast, by Application 2020 & 2033
- Table 27: United Arab Emirates Simulator Market Revenue (Million) Forecast, by Application 2020 & 2033
- Table 28: Turkey Simulator Market Revenue (Million) Forecast, by Application 2020 & 2033
- Table 29: Rest of the Middle East and Africa Simulator Market Revenue (Million) Forecast, by Application 2020 & 2033
Frequently Asked Questions
1. What is the projected Compound Annual Growth Rate (CAGR) of the Simulator Market?
The projected CAGR is approximately 6.45%.
2. Which companies are prominent players in the Simulator Market?
Key companies in the market include THALES, Collins Aerospace (RTX Corporation), General Dynamics Corporation, Rheinmetall AG, ECA Group, RUAG Group, FAAC Incorporated, FRASCA International Inc, CAE Inc, VSTEP BV, Kongsberg Gruppen AS, Krauss-Maffei Wegmann GmbH & Co KG, FlightSafety International Inc.
3. What are the main segments of the Simulator Market?
The market segments include Platform.
4. Can you provide details about the market size?
The market size is estimated to be USD 11.54 Million as of 2022.
5. What are some drivers contributing to market growth?
N/A
6. What are the notable trends driving market growth?
Air Segment Will Showcase Remarkable Growth During the Forecast Period.
7. Are there any restraints impacting market growth?
N/A
8. Can you provide examples of recent developments in the market?
N/A
9. What pricing options are available for accessing the report?
Pricing options include single-user, multi-user, and enterprise licenses priced at USD 4750, USD 5250, and USD 8750 respectively.
10. Is the market size provided in terms of value or volume?
The market size is provided in terms of value, measured in Million.
11. Are there any specific market keywords associated with the report?
Yes, the market keyword associated with the report is "Simulator Market," which aids in identifying and referencing the specific market segment covered.
12. How do I determine which pricing option suits my needs best?
The pricing options vary based on user requirements and access needs. Individual users may opt for single-user licenses, while businesses requiring broader access may choose multi-user or enterprise licenses for cost-effective access to the report.
13. Are there any additional resources or data provided in the Simulator Market report?
While the report offers comprehensive insights, it's advisable to review the specific contents or supplementary materials provided to ascertain if additional resources or data are available.
14. How can I stay updated on further developments or reports in the Simulator Market?
To stay informed about further developments, trends, and reports in the Simulator Market, consider subscribing to industry newsletters, following relevant companies and organizations, or regularly checking reputable industry news sources and publications.
Methodology
Step 1 - Identification of Relevant Samples Size from Population Database


Step 2 - Approaches for Defining Global Market Size (Value, Volume* & Price*)

Note*: In applicable scenarios
Step 3 - Data Sources
Primary Research
- Web Analytics
- Survey Reports
- Research Institute
- Latest Research Reports
- Opinion Leaders
Secondary Research
- Annual Reports
- White Paper
- Latest Press Release
- Industry Association
- Paid Database
- Investor Presentations

Step 4 - Data Triangulation
Involves using different sources of information in order to increase the validity of a study
These sources are likely to be stakeholders in a program - participants, other researchers, program staff, other community members, and so on.
Then we put all data in single framework & apply various statistical tools to find out the dynamic on the market.
During the analysis stage, feedback from the stakeholder groups would be compared to determine areas of agreement as well as areas of divergence