
Key Insights
The global skincare products market, valued at approximately $XX million in 2025, is projected to experience robust growth, driven by several key factors. Rising consumer awareness of skincare benefits, coupled with increasing disposable incomes, particularly in emerging economies like India and China, fuels demand for both premium and mass-market products. The market's segmentation reveals a significant preference for facial care products, reflecting a focus on anti-aging and skin rejuvenation. Online retail channels are experiencing rapid growth, surpassing traditional retail formats like supermarkets and pharmacies in certain regions. This shift is attributed to increased e-commerce penetration and the convenience offered by online shopping, coupled with targeted digital marketing strategies employed by major players. While the premium skincare segment maintains a higher price point, the mass skincare segment exhibits significant volume growth, catering to a broader consumer base. Competition within the market is intense, with established multinational corporations like L'Oréal, Estée Lauder, and Unilever dominating market share alongside emerging regional brands. However, challenges remain, including fluctuating raw material prices and evolving consumer preferences toward natural and sustainable products. These challenges are pushing companies to innovate with new formulations and packaging materials to meet the growing demand for eco-friendly skincare options.
The forecast period (2025-2033) anticipates a continued expansion, propelled by technological advancements in skincare formulations (e.g., personalized skincare solutions, advanced ingredient technologies) and a greater emphasis on men's skincare. Regional variations are expected, with Asia Pacific and North America maintaining substantial market shares due to higher per capita spending on skincare and established brand presence. However, growth in regions like South America and the Middle East is projected to be significant, driven by rising middle-class populations and increasing awareness of skincare routines. The market's success will depend on manufacturers' ability to adapt to evolving consumer expectations, including a greater focus on sustainability, transparency in ingredient sourcing, and effective digital marketing strategies. Maintaining a strong brand image and building consumer trust will be critical in navigating the increasingly competitive landscape.
Skin Care Products Market: A Comprehensive Report (2019-2033)
This in-depth report provides a comprehensive analysis of the global Skin Care Products Market, offering invaluable insights for industry professionals, investors, and strategic decision-makers. With a detailed examination of market dynamics, segmentation, key players, and future trends, this report covers the period from 2019 to 2033, with a focus on the forecast period of 2025-2033 and a base year of 2025. The report values are expressed in Millions.
Skin Care Products Market Structure & Innovation Trends
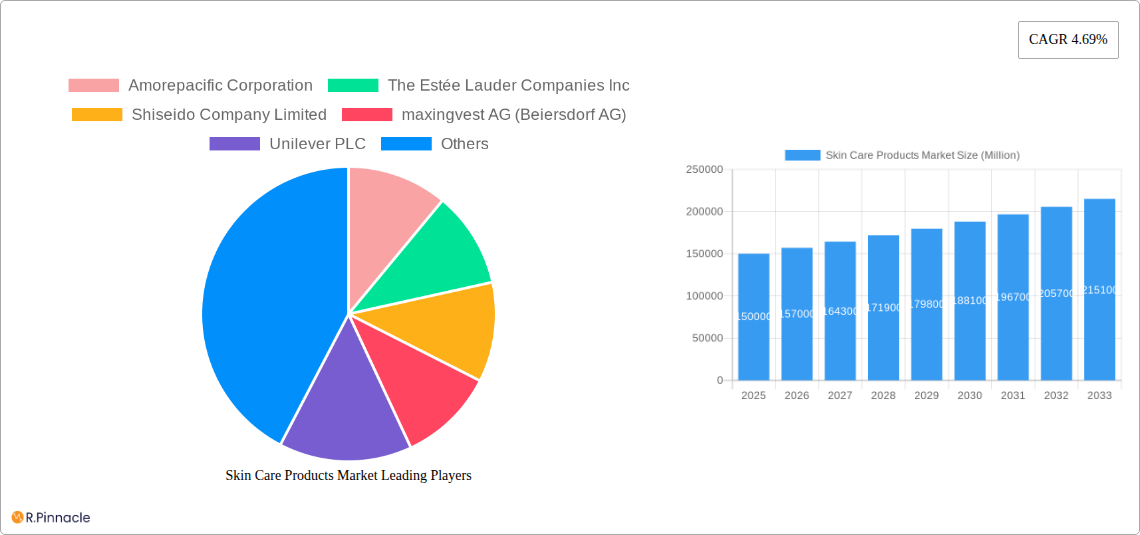
The global skin care products market is characterized by a moderately concentrated structure, with several multinational corporations holding significant market share. Key players such as L'Oréal S.A., The Estée Lauder Companies Inc., Unilever PLC, and Procter & Gamble Company dominate the landscape, exhibiting strong brand recognition and extensive distribution networks. However, the market also accommodates numerous smaller players, particularly in niche segments like organic and natural skincare.
Market concentration is influenced by factors such as brand equity, R&D capabilities, and global reach. The market share of the top five players is estimated to be around xx% in 2025. Innovation drivers include advancements in cosmetic science, growing consumer demand for specialized skincare solutions (e.g., anti-aging, acne treatment), and the rise of personalized skincare regimens. Regulatory frameworks concerning product safety and labeling vary across regions, impacting market dynamics. Product substitutes, such as home remedies and natural ingredients, present a competitive challenge, albeit a minor one. The end-user demographics are diverse, encompassing individuals across age groups, genders, and income levels, with growing interest in skincare across all demographics. M&A activities, as highlighted by recent acquisitions like P&G's purchase of Tula, demonstrate the strategic focus on expanding product portfolios and market reach. The estimated value of M&A deals in the skincare sector for the historical period (2019-2024) was approximately xx Million.
Skin Care Products Market Dynamics & Trends
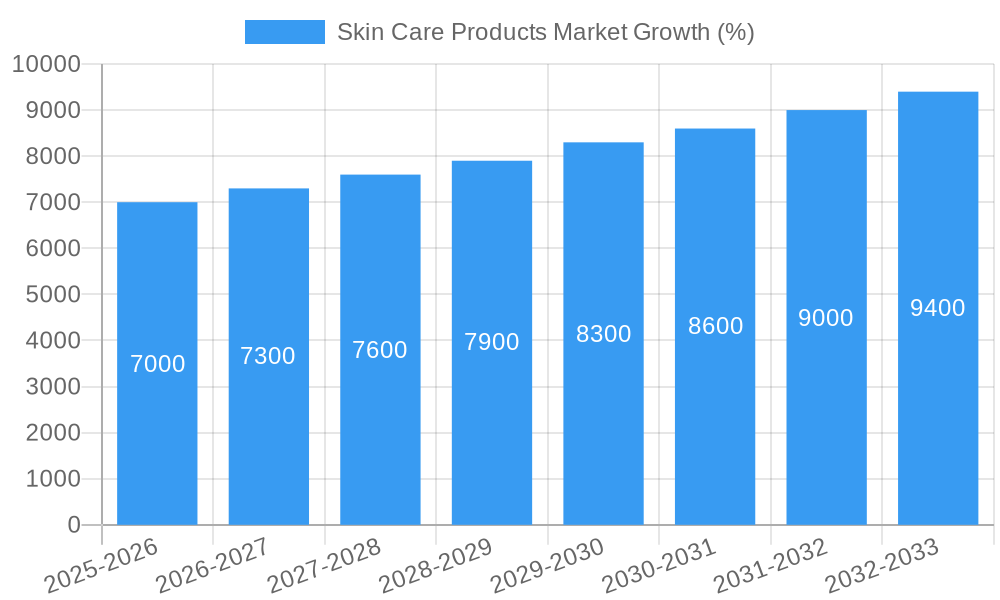
The global skin care products market is experiencing robust growth, driven by several key factors. Rising disposable incomes, particularly in emerging economies, have fueled increased spending on personal care products, including skincare. A growing awareness of skincare benefits and the importance of preventative measures has led to increased demand for a diverse range of skincare products. The increasing prevalence of skin conditions like acne and premature aging further boosts market growth. Technological advancements have enabled the creation of more effective and targeted skincare products. Personalized skincare solutions, utilizing AI and big data, are gaining traction. Consumer preferences are shifting towards natural, organic, and sustainable skincare products, driven by increasing health consciousness and environmental concerns. The market is witnessing a surge in the popularity of clean beauty and vegan skincare options. Competitive dynamics are shaped by factors such as product innovation, branding, pricing strategies, and distribution network reach. The compound annual growth rate (CAGR) for the global skin care products market is projected to be xx% during the forecast period (2025-2033). Market penetration is increasing across all segments, but particularly in emerging markets.
Dominant Regions & Segments in Skin Care Products Market
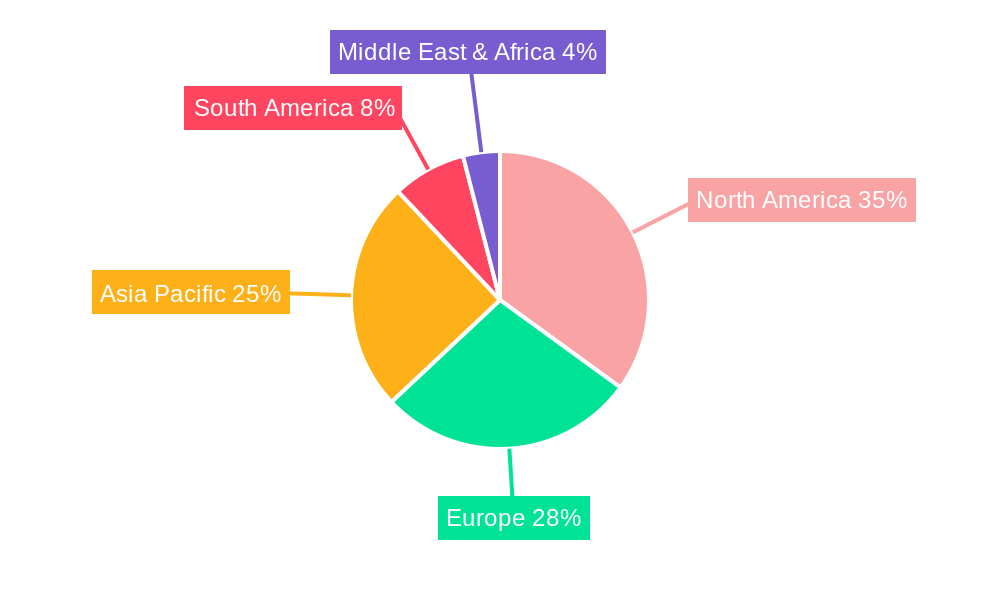
The North American and Asian regions dominate the global skin care products market, driven by high consumer spending and strong market penetration. Within these regions, specific countries like the United States, China, Japan, and South Korea exhibit exceptional growth.
- Leading Regions: North America, Asia-Pacific (specifically China, Japan, South Korea)
- Dominant Product Type: Facial care products, especially serums, moisturizers and cleansers, contribute significantly to overall market revenue.
- Leading Category: Premium skincare products are gaining traction, owing to their efficacy and luxury appeal, though the mass skincare products segment maintains considerable market share due to affordability and accessibility.
- Primary Distribution Channel: Specialist retail stores, alongside online retail channels, drive the majority of sales. The online channel is growing at a fast rate and is projected to surpass many other channels by the end of the forecast period.
Key Drivers:
- North America: High disposable incomes, strong consumer preference for premium products, significant investments in R&D and marketing.
- Asia-Pacific: Rapid economic growth, rising middle-class population, increasing awareness of skincare benefits.
- Europe: Established skincare industry, increasing adoption of innovative products, regulatory support for organic and sustainable products.
Skin Care Products Market Product Innovations
The skin care products market is witnessing significant product innovation, driven by advancements in cosmetic science and consumer demand. New product formulations with advanced ingredients, such as peptides, stem cells, and probiotics, are designed to deliver targeted skincare benefits, such as improved skin hydration, wrinkle reduction, and acne treatment. The rise of personalized skincare, which uses AI and big data to create customized skincare regimes, is also gaining traction. Innovations are particularly strong in the areas of anti-aging, brightening, and acne treatment. These innovations are improving product efficacy, customizing skincare solutions, and meeting specific consumer needs, driving higher market penetration.
Report Scope & Segmentation Analysis
This report provides a detailed segmentation of the skin care products market based on product type, category, and distribution channel.
Product Type: Facial care (cleansers, toners, serums, moisturizers, masks, etc.) and other facial care products (eye creams, lip balms, sunscreens etc.). Facial care is expected to remain the largest segment throughout the forecast period, with a projected CAGR of xx%. Other facial care is projected to have a CAGR of xx% due to the increasing popularity of specialized skincare products.
Category: Premium skincare products (high-priced, luxury brands) and mass skincare products (more affordable, widely available). The premium segment is experiencing faster growth, with a CAGR of xx%, while the mass segment maintains a larger market share with a projected CAGR of xx%.
Distribution Channel: Specialist retail stores, supermarkets/hypermarkets, convenience stores, pharmacies/drug stores, online retail channels, and other distribution channels. Online channels are exhibiting the most rapid growth, driven by e-commerce expansion and consumer preference for online shopping. The online channel is expected to show a CAGR of xx% during the forecast period.
Key Drivers of Skin Care Products Market Growth
Several factors drive the growth of the skin care products market. Rising disposable incomes in emerging markets lead to increased spending on personal care products. The increasing awareness of skincare benefits and the importance of preventative measures are boosting demand. Technological advancements facilitate the development of more effective and targeted skincare solutions. The shifting consumer preferences toward natural and organic products and the growth of personalized skincare regimes are also key growth drivers. Finally, favorable regulatory environments in certain regions, coupled with supportive government policies in others, help fuel this growth.
Challenges in the Skin Care Products Market Sector
The skin care products market faces several challenges. Stringent regulatory requirements and safety standards increase product development costs and timelines. Fluctuations in raw material prices affect profitability. Intense competition from established and emerging players puts pressure on pricing and margins. Counterfeit products pose a significant threat, impacting brand reputation and market share. The supply chain disruptions caused by geopolitical instability and the pandemic also impacted market growth. These challenges necessitate robust supply chain management, innovative product development, and effective branding strategies to maintain market competitiveness.
Emerging Opportunities in Skin Care Products Market
Several emerging opportunities exist within the skin care products market. The rising demand for personalized skincare solutions provides significant potential for growth. The growing popularity of clean beauty and sustainable products presents opportunities for brands focusing on eco-friendly formulations and packaging. Expansion into emerging markets, particularly in Asia and Africa, offers substantial untapped potential. Innovations in ingredient technology, such as personalized active ingredients and microbiome-focused skincare, are also driving new opportunities. The market has demonstrated a great deal of responsiveness to consumer desires, suggesting that brands should closely monitor these shifts to maintain their competitiveness.
Leading Players in the Skin Care Products Market Market
- Amorepacific Corporation
- The Estée Lauder Companies Inc
- Shiseido Company Limited
- maxingvest AG (Beiersdorf AG)
- Unilever PLC
- Colgate-Palmolive Company
- L'Oréal S A
- Johnson & Johnson Services Inc
- Procter & Gamble Company
- Kao Corporation
Key Developments in Skin Care Products Market Industry
- December 2021: L'Oréal S.A. acquired 'Youth to the People,' expanding its portfolio of premium vegan skincare products. This acquisition strengthens L'Oréal's position in the rapidly growing clean beauty segment.
- January 2022: Procter & Gamble acquired Tula, a clean skincare brand focused on probiotic extracts. This acquisition broadened P&G's presence in the clean beauty market and enhanced its product portfolio.
- January 2022: L'Oréal and Verily announced a strategic partnership to advance skin health research. This collaboration is expected to lead to innovative products and technologies, enhancing L'Oréal's competitive edge.
Future Outlook for Skin Care Products Market Market
The future of the skin care products market looks promising. Continued growth is anticipated, driven by factors such as rising disposable incomes, increasing health consciousness, technological advancements, and evolving consumer preferences. Strategic opportunities lie in personalized skincare, clean beauty, and expansion into untapped markets. Companies that successfully adapt to changing consumer demands, leverage technological innovations, and build strong brands will be well-positioned for growth in this dynamic market. The market is poised for continued expansion and innovation, promising significant growth opportunities for key players and new entrants alike.
Skin Care Products Market Segmentation
-
1. Product Type
-
1.1. Facial Care
- 1.1.1. Cleansers
- 1.1.2. Moisturizers, Creams, and Lotions
- 1.1.3. Serums and Essence
- 1.1.4. Toners
- 1.1.5. Face Masks and Packs
- 1.1.6. Other Facial Care Products
- 1.2. Lip Care
-
1.3. Body Care
- 1.3.1. Body Wash
- 1.3.2. Body Lotions
-
1.1. Facial Care
-
2. Category
- 2.1. Premium Skincare Products
- 2.2. Mass Skincare Products
-
3. Distribution Channel
- 3.1. Specialist Retail Stores
- 3.2. Supermarkets/Hypermarkets
- 3.3. Convenience Stores
- 3.4. Pharmacies/Drug Stores
- 3.5. Online Retail Channels
- 3.6. Other Distribution Channels
Skin Care Products Market Segmentation By Geography
-
1. North America
- 1.1. United States
- 1.2. Canada
- 1.3. Mexico
- 1.4. Rest of North America
-
2. Europe
- 2.1. United Kingdom
- 2.2. Germany
- 2.3. Spain
- 2.4. France
- 2.5. Italy
- 2.6. Russia
- 2.7. Rest of Europe
-
3. Asia Pacific
- 3.1. China
- 3.2. Japan
- 3.3. India
- 3.4. Australia
- 3.5. Rest of Asia Pacific
-
4. South America
- 4.1. Brazil
- 4.2. Argentina
- 4.3. Rest of South America
- 5. Middle East
-
6. South Africa
- 6.1. Saudi Arabia
- 6.2. Rest of Middle East
Skin Care Products Market REPORT HIGHLIGHTS
| Aspects | Details |
|---|---|
| Study Period | 2019-2033 |
| Base Year | 2024 |
| Estimated Year | 2025 |
| Forecast Period | 2025-2033 |
| Historical Period | 2019-2024 |
| Growth Rate | CAGR of 4.69% from 2019-2033 |
| Segmentation |
|
Table of Contents
- 1. Introduction
- 1.1. Research Scope
- 1.2. Market Segmentation
- 1.3. Research Methodology
- 1.4. Definitions and Assumptions
- 2. Executive Summary
- 2.1. Introduction
- 3. Market Dynamics
- 3.1. Introduction
- 3.2. Market Drivers
- 3.2.1. Rising Demand for Natural/Organic Formulation Skincare Products Via E-Commerce; Augmented Expenditure on Marketing and Promotional Activities
- 3.3. Market Restrains
- 3.3.1. Touch and Feel Factor Restraining the Market Growth
- 3.4. Market Trends
- 3.4.1. Growing Demand for Anti-Aging and Anti-Pollution Ranges
- 4. Market Factor Analysis
- 4.1. Porters Five Forces
- 4.2. Supply/Value Chain
- 4.3. PESTEL analysis
- 4.4. Market Entropy
- 4.5. Patent/Trademark Analysis
- 5. Global Skin Care Products Market Analysis, Insights and Forecast, 2019-2031
- 5.1. Market Analysis, Insights and Forecast - by Product Type
- 5.1.1. Facial Care
- 5.1.1.1. Cleansers
- 5.1.1.2. Moisturizers, Creams, and Lotions
- 5.1.1.3. Serums and Essence
- 5.1.1.4. Toners
- 5.1.1.5. Face Masks and Packs
- 5.1.1.6. Other Facial Care Products
- 5.1.2. Lip Care
- 5.1.3. Body Care
- 5.1.3.1. Body Wash
- 5.1.3.2. Body Lotions
- 5.1.1. Facial Care
- 5.2. Market Analysis, Insights and Forecast - by Category
- 5.2.1. Premium Skincare Products
- 5.2.2. Mass Skincare Products
- 5.3. Market Analysis, Insights and Forecast - by Distribution Channel
- 5.3.1. Specialist Retail Stores
- 5.3.2. Supermarkets/Hypermarkets
- 5.3.3. Convenience Stores
- 5.3.4. Pharmacies/Drug Stores
- 5.3.5. Online Retail Channels
- 5.3.6. Other Distribution Channels
- 5.4. Market Analysis, Insights and Forecast - by Region
- 5.4.1. North America
- 5.4.2. Europe
- 5.4.3. Asia Pacific
- 5.4.4. South America
- 5.4.5. Middle East
- 5.4.6. South Africa
- 5.1. Market Analysis, Insights and Forecast - by Product Type
- 6. North America Skin Care Products Market Analysis, Insights and Forecast, 2019-2031
- 6.1. Market Analysis, Insights and Forecast - by Product Type
- 6.1.1. Facial Care
- 6.1.1.1. Cleansers
- 6.1.1.2. Moisturizers, Creams, and Lotions
- 6.1.1.3. Serums and Essence
- 6.1.1.4. Toners
- 6.1.1.5. Face Masks and Packs
- 6.1.1.6. Other Facial Care Products
- 6.1.2. Lip Care
- 6.1.3. Body Care
- 6.1.3.1. Body Wash
- 6.1.3.2. Body Lotions
- 6.1.1. Facial Care
- 6.2. Market Analysis, Insights and Forecast - by Category
- 6.2.1. Premium Skincare Products
- 6.2.2. Mass Skincare Products
- 6.3. Market Analysis, Insights and Forecast - by Distribution Channel
- 6.3.1. Specialist Retail Stores
- 6.3.2. Supermarkets/Hypermarkets
- 6.3.3. Convenience Stores
- 6.3.4. Pharmacies/Drug Stores
- 6.3.5. Online Retail Channels
- 6.3.6. Other Distribution Channels
- 6.1. Market Analysis, Insights and Forecast - by Product Type
- 7. Europe Skin Care Products Market Analysis, Insights and Forecast, 2019-2031
- 7.1. Market Analysis, Insights and Forecast - by Product Type
- 7.1.1. Facial Care
- 7.1.1.1. Cleansers
- 7.1.1.2. Moisturizers, Creams, and Lotions
- 7.1.1.3. Serums and Essence
- 7.1.1.4. Toners
- 7.1.1.5. Face Masks and Packs
- 7.1.1.6. Other Facial Care Products
- 7.1.2. Lip Care
- 7.1.3. Body Care
- 7.1.3.1. Body Wash
- 7.1.3.2. Body Lotions
- 7.1.1. Facial Care
- 7.2. Market Analysis, Insights and Forecast - by Category
- 7.2.1. Premium Skincare Products
- 7.2.2. Mass Skincare Products
- 7.3. Market Analysis, Insights and Forecast - by Distribution Channel
- 7.3.1. Specialist Retail Stores
- 7.3.2. Supermarkets/Hypermarkets
- 7.3.3. Convenience Stores
- 7.3.4. Pharmacies/Drug Stores
- 7.3.5. Online Retail Channels
- 7.3.6. Other Distribution Channels
- 7.1. Market Analysis, Insights and Forecast - by Product Type
- 8. Asia Pacific Skin Care Products Market Analysis, Insights and Forecast, 2019-2031
- 8.1. Market Analysis, Insights and Forecast - by Product Type
- 8.1.1. Facial Care
- 8.1.1.1. Cleansers
- 8.1.1.2. Moisturizers, Creams, and Lotions
- 8.1.1.3. Serums and Essence
- 8.1.1.4. Toners
- 8.1.1.5. Face Masks and Packs
- 8.1.1.6. Other Facial Care Products
- 8.1.2. Lip Care
- 8.1.3. Body Care
- 8.1.3.1. Body Wash
- 8.1.3.2. Body Lotions
- 8.1.1. Facial Care
- 8.2. Market Analysis, Insights and Forecast - by Category
- 8.2.1. Premium Skincare Products
- 8.2.2. Mass Skincare Products
- 8.3. Market Analysis, Insights and Forecast - by Distribution Channel
- 8.3.1. Specialist Retail Stores
- 8.3.2. Supermarkets/Hypermarkets
- 8.3.3. Convenience Stores
- 8.3.4. Pharmacies/Drug Stores
- 8.3.5. Online Retail Channels
- 8.3.6. Other Distribution Channels
- 8.1. Market Analysis, Insights and Forecast - by Product Type
- 9. South America Skin Care Products Market Analysis, Insights and Forecast, 2019-2031
- 9.1. Market Analysis, Insights and Forecast - by Product Type
- 9.1.1. Facial Care
- 9.1.1.1. Cleansers
- 9.1.1.2. Moisturizers, Creams, and Lotions
- 9.1.1.3. Serums and Essence
- 9.1.1.4. Toners
- 9.1.1.5. Face Masks and Packs
- 9.1.1.6. Other Facial Care Products
- 9.1.2. Lip Care
- 9.1.3. Body Care
- 9.1.3.1. Body Wash
- 9.1.3.2. Body Lotions
- 9.1.1. Facial Care
- 9.2. Market Analysis, Insights and Forecast - by Category
- 9.2.1. Premium Skincare Products
- 9.2.2. Mass Skincare Products
- 9.3. Market Analysis, Insights and Forecast - by Distribution Channel
- 9.3.1. Specialist Retail Stores
- 9.3.2. Supermarkets/Hypermarkets
- 9.3.3. Convenience Stores
- 9.3.4. Pharmacies/Drug Stores
- 9.3.5. Online Retail Channels
- 9.3.6. Other Distribution Channels
- 9.1. Market Analysis, Insights and Forecast - by Product Type
- 10. Middle East Skin Care Products Market Analysis, Insights and Forecast, 2019-2031
- 10.1. Market Analysis, Insights and Forecast - by Product Type
- 10.1.1. Facial Care
- 10.1.1.1. Cleansers
- 10.1.1.2. Moisturizers, Creams, and Lotions
- 10.1.1.3. Serums and Essence
- 10.1.1.4. Toners
- 10.1.1.5. Face Masks and Packs
- 10.1.1.6. Other Facial Care Products
- 10.1.2. Lip Care
- 10.1.3. Body Care
- 10.1.3.1. Body Wash
- 10.1.3.2. Body Lotions
- 10.1.1. Facial Care
- 10.2. Market Analysis, Insights and Forecast - by Category
- 10.2.1. Premium Skincare Products
- 10.2.2. Mass Skincare Products
- 10.3. Market Analysis, Insights and Forecast - by Distribution Channel
- 10.3.1. Specialist Retail Stores
- 10.3.2. Supermarkets/Hypermarkets
- 10.3.3. Convenience Stores
- 10.3.4. Pharmacies/Drug Stores
- 10.3.5. Online Retail Channels
- 10.3.6. Other Distribution Channels
- 10.1. Market Analysis, Insights and Forecast - by Product Type
- 11. South Africa Skin Care Products Market Analysis, Insights and Forecast, 2019-2031
- 11.1. Market Analysis, Insights and Forecast - by Product Type
- 11.1.1. Facial Care
- 11.1.1.1. Cleansers
- 11.1.1.2. Moisturizers, Creams, and Lotions
- 11.1.1.3. Serums and Essence
- 11.1.1.4. Toners
- 11.1.1.5. Face Masks and Packs
- 11.1.1.6. Other Facial Care Products
- 11.1.2. Lip Care
- 11.1.3. Body Care
- 11.1.3.1. Body Wash
- 11.1.3.2. Body Lotions
- 11.1.1. Facial Care
- 11.2. Market Analysis, Insights and Forecast - by Category
- 11.2.1. Premium Skincare Products
- 11.2.2. Mass Skincare Products
- 11.3. Market Analysis, Insights and Forecast - by Distribution Channel
- 11.3.1. Specialist Retail Stores
- 11.3.2. Supermarkets/Hypermarkets
- 11.3.3. Convenience Stores
- 11.3.4. Pharmacies/Drug Stores
- 11.3.5. Online Retail Channels
- 11.3.6. Other Distribution Channels
- 11.1. Market Analysis, Insights and Forecast - by Product Type
- 12. North America Skin Care Products Market Analysis, Insights and Forecast, 2019-2031
- 12.1. Market Analysis, Insights and Forecast - By Country/Sub-region
- 12.1.1 United States
- 12.1.2 Canada
- 12.1.3 Mexico
- 12.1.4 Rest of North America
- 13. Europe Skin Care Products Market Analysis, Insights and Forecast, 2019-2031
- 13.1. Market Analysis, Insights and Forecast - By Country/Sub-region
- 13.1.1 United Kingdom
- 13.1.2 Germany
- 13.1.3 Spain
- 13.1.4 France
- 13.1.5 Italy
- 13.1.6 Russia
- 13.1.7 Rest of Europe
- 14. Asia Pacific Skin Care Products Market Analysis, Insights and Forecast, 2019-2031
- 14.1. Market Analysis, Insights and Forecast - By Country/Sub-region
- 14.1.1 China
- 14.1.2 Japan
- 14.1.3 India
- 14.1.4 Australia
- 14.1.5 Rest of Asia Pacific
- 15. South America Skin Care Products Market Analysis, Insights and Forecast, 2019-2031
- 15.1. Market Analysis, Insights and Forecast - By Country/Sub-region
- 15.1.1 Brazil
- 15.1.2 Argentina
- 15.1.3 Rest of South America
- 16. Middle East Skin Care Products Market Analysis, Insights and Forecast, 2019-2031
- 16.1. Market Analysis, Insights and Forecast - By Country/Sub-region
- 16.1.1.
- 17. South Africa Skin Care Products Market Analysis, Insights and Forecast, 2019-2031
- 17.1. Market Analysis, Insights and Forecast - By Country/Sub-region
- 17.1.1 Saudi Arabia
- 17.1.2 Rest of Middle East
- 18. Competitive Analysis
- 18.1. Global Market Share Analysis 2024
- 18.2. Company Profiles
- 18.2.1 Amorepacific Corporation
- 18.2.1.1. Overview
- 18.2.1.2. Products
- 18.2.1.3. SWOT Analysis
- 18.2.1.4. Recent Developments
- 18.2.1.5. Financials (Based on Availability)
- 18.2.2 The Estée Lauder Companies Inc
- 18.2.2.1. Overview
- 18.2.2.2. Products
- 18.2.2.3. SWOT Analysis
- 18.2.2.4. Recent Developments
- 18.2.2.5. Financials (Based on Availability)
- 18.2.3 Shiseido Company Limited
- 18.2.3.1. Overview
- 18.2.3.2. Products
- 18.2.3.3. SWOT Analysis
- 18.2.3.4. Recent Developments
- 18.2.3.5. Financials (Based on Availability)
- 18.2.4 maxingvest AG (Beiersdorf AG)
- 18.2.4.1. Overview
- 18.2.4.2. Products
- 18.2.4.3. SWOT Analysis
- 18.2.4.4. Recent Developments
- 18.2.4.5. Financials (Based on Availability)
- 18.2.5 Unilever PLC
- 18.2.5.1. Overview
- 18.2.5.2. Products
- 18.2.5.3. SWOT Analysis
- 18.2.5.4. Recent Developments
- 18.2.5.5. Financials (Based on Availability)
- 18.2.6 Colgate-Palmolive Company*List Not Exhaustive
- 18.2.6.1. Overview
- 18.2.6.2. Products
- 18.2.6.3. SWOT Analysis
- 18.2.6.4. Recent Developments
- 18.2.6.5. Financials (Based on Availability)
- 18.2.7 L'Oréal S A
- 18.2.7.1. Overview
- 18.2.7.2. Products
- 18.2.7.3. SWOT Analysis
- 18.2.7.4. Recent Developments
- 18.2.7.5. Financials (Based on Availability)
- 18.2.8 Johnson & Johnson Services Inc
- 18.2.8.1. Overview
- 18.2.8.2. Products
- 18.2.8.3. SWOT Analysis
- 18.2.8.4. Recent Developments
- 18.2.8.5. Financials (Based on Availability)
- 18.2.9 Procter & Gamble Company
- 18.2.9.1. Overview
- 18.2.9.2. Products
- 18.2.9.3. SWOT Analysis
- 18.2.9.4. Recent Developments
- 18.2.9.5. Financials (Based on Availability)
- 18.2.10 Kao Corporation
- 18.2.10.1. Overview
- 18.2.10.2. Products
- 18.2.10.3. SWOT Analysis
- 18.2.10.4. Recent Developments
- 18.2.10.5. Financials (Based on Availability)
- 18.2.1 Amorepacific Corporation
List of Figures
- Figure 1: Global Skin Care Products Market Revenue Breakdown (Million, %) by Region 2024 & 2032
- Figure 2: Global Skin Care Products Market Volume Breakdown (K Units, %) by Region 2024 & 2032
- Figure 3: North America Skin Care Products Market Revenue (Million), by Country 2024 & 2032
- Figure 4: North America Skin Care Products Market Volume (K Units), by Country 2024 & 2032
- Figure 5: North America Skin Care Products Market Revenue Share (%), by Country 2024 & 2032
- Figure 6: North America Skin Care Products Market Volume Share (%), by Country 2024 & 2032
- Figure 7: Europe Skin Care Products Market Revenue (Million), by Country 2024 & 2032
- Figure 8: Europe Skin Care Products Market Volume (K Units), by Country 2024 & 2032
- Figure 9: Europe Skin Care Products Market Revenue Share (%), by Country 2024 & 2032
- Figure 10: Europe Skin Care Products Market Volume Share (%), by Country 2024 & 2032
- Figure 11: Asia Pacific Skin Care Products Market Revenue (Million), by Country 2024 & 2032
- Figure 12: Asia Pacific Skin Care Products Market Volume (K Units), by Country 2024 & 2032
- Figure 13: Asia Pacific Skin Care Products Market Revenue Share (%), by Country 2024 & 2032
- Figure 14: Asia Pacific Skin Care Products Market Volume Share (%), by Country 2024 & 2032
- Figure 15: South America Skin Care Products Market Revenue (Million), by Country 2024 & 2032
- Figure 16: South America Skin Care Products Market Volume (K Units), by Country 2024 & 2032
- Figure 17: South America Skin Care Products Market Revenue Share (%), by Country 2024 & 2032
- Figure 18: South America Skin Care Products Market Volume Share (%), by Country 2024 & 2032
- Figure 19: Middle East Skin Care Products Market Revenue (Million), by Country 2024 & 2032
- Figure 20: Middle East Skin Care Products Market Volume (K Units), by Country 2024 & 2032
- Figure 21: Middle East Skin Care Products Market Revenue Share (%), by Country 2024 & 2032
- Figure 22: Middle East Skin Care Products Market Volume Share (%), by Country 2024 & 2032
- Figure 23: South Africa Skin Care Products Market Revenue (Million), by Country 2024 & 2032
- Figure 24: South Africa Skin Care Products Market Volume (K Units), by Country 2024 & 2032
- Figure 25: South Africa Skin Care Products Market Revenue Share (%), by Country 2024 & 2032
- Figure 26: South Africa Skin Care Products Market Volume Share (%), by Country 2024 & 2032
- Figure 27: North America Skin Care Products Market Revenue (Million), by Product Type 2024 & 2032
- Figure 28: North America Skin Care Products Market Volume (K Units), by Product Type 2024 & 2032
- Figure 29: North America Skin Care Products Market Revenue Share (%), by Product Type 2024 & 2032
- Figure 30: North America Skin Care Products Market Volume Share (%), by Product Type 2024 & 2032
- Figure 31: North America Skin Care Products Market Revenue (Million), by Category 2024 & 2032
- Figure 32: North America Skin Care Products Market Volume (K Units), by Category 2024 & 2032
- Figure 33: North America Skin Care Products Market Revenue Share (%), by Category 2024 & 2032
- Figure 34: North America Skin Care Products Market Volume Share (%), by Category 2024 & 2032
- Figure 35: North America Skin Care Products Market Revenue (Million), by Distribution Channel 2024 & 2032
- Figure 36: North America Skin Care Products Market Volume (K Units), by Distribution Channel 2024 & 2032
- Figure 37: North America Skin Care Products Market Revenue Share (%), by Distribution Channel 2024 & 2032
- Figure 38: North America Skin Care Products Market Volume Share (%), by Distribution Channel 2024 & 2032
- Figure 39: North America Skin Care Products Market Revenue (Million), by Country 2024 & 2032
- Figure 40: North America Skin Care Products Market Volume (K Units), by Country 2024 & 2032
- Figure 41: North America Skin Care Products Market Revenue Share (%), by Country 2024 & 2032
- Figure 42: North America Skin Care Products Market Volume Share (%), by Country 2024 & 2032
- Figure 43: Europe Skin Care Products Market Revenue (Million), by Product Type 2024 & 2032
- Figure 44: Europe Skin Care Products Market Volume (K Units), by Product Type 2024 & 2032
- Figure 45: Europe Skin Care Products Market Revenue Share (%), by Product Type 2024 & 2032
- Figure 46: Europe Skin Care Products Market Volume Share (%), by Product Type 2024 & 2032
- Figure 47: Europe Skin Care Products Market Revenue (Million), by Category 2024 & 2032
- Figure 48: Europe Skin Care Products Market Volume (K Units), by Category 2024 & 2032
- Figure 49: Europe Skin Care Products Market Revenue Share (%), by Category 2024 & 2032
- Figure 50: Europe Skin Care Products Market Volume Share (%), by Category 2024 & 2032
- Figure 51: Europe Skin Care Products Market Revenue (Million), by Distribution Channel 2024 & 2032
- Figure 52: Europe Skin Care Products Market Volume (K Units), by Distribution Channel 2024 & 2032
- Figure 53: Europe Skin Care Products Market Revenue Share (%), by Distribution Channel 2024 & 2032
- Figure 54: Europe Skin Care Products Market Volume Share (%), by Distribution Channel 2024 & 2032
- Figure 55: Europe Skin Care Products Market Revenue (Million), by Country 2024 & 2032
- Figure 56: Europe Skin Care Products Market Volume (K Units), by Country 2024 & 2032
- Figure 57: Europe Skin Care Products Market Revenue Share (%), by Country 2024 & 2032
- Figure 58: Europe Skin Care Products Market Volume Share (%), by Country 2024 & 2032
- Figure 59: Asia Pacific Skin Care Products Market Revenue (Million), by Product Type 2024 & 2032
- Figure 60: Asia Pacific Skin Care Products Market Volume (K Units), by Product Type 2024 & 2032
- Figure 61: Asia Pacific Skin Care Products Market Revenue Share (%), by Product Type 2024 & 2032
- Figure 62: Asia Pacific Skin Care Products Market Volume Share (%), by Product Type 2024 & 2032
- Figure 63: Asia Pacific Skin Care Products Market Revenue (Million), by Category 2024 & 2032
- Figure 64: Asia Pacific Skin Care Products Market Volume (K Units), by Category 2024 & 2032
- Figure 65: Asia Pacific Skin Care Products Market Revenue Share (%), by Category 2024 & 2032
- Figure 66: Asia Pacific Skin Care Products Market Volume Share (%), by Category 2024 & 2032
- Figure 67: Asia Pacific Skin Care Products Market Revenue (Million), by Distribution Channel 2024 & 2032
- Figure 68: Asia Pacific Skin Care Products Market Volume (K Units), by Distribution Channel 2024 & 2032
- Figure 69: Asia Pacific Skin Care Products Market Revenue Share (%), by Distribution Channel 2024 & 2032
- Figure 70: Asia Pacific Skin Care Products Market Volume Share (%), by Distribution Channel 2024 & 2032
- Figure 71: Asia Pacific Skin Care Products Market Revenue (Million), by Country 2024 & 2032
- Figure 72: Asia Pacific Skin Care Products Market Volume (K Units), by Country 2024 & 2032
- Figure 73: Asia Pacific Skin Care Products Market Revenue Share (%), by Country 2024 & 2032
- Figure 74: Asia Pacific Skin Care Products Market Volume Share (%), by Country 2024 & 2032
- Figure 75: South America Skin Care Products Market Revenue (Million), by Product Type 2024 & 2032
- Figure 76: South America Skin Care Products Market Volume (K Units), by Product Type 2024 & 2032
- Figure 77: South America Skin Care Products Market Revenue Share (%), by Product Type 2024 & 2032
- Figure 78: South America Skin Care Products Market Volume Share (%), by Product Type 2024 & 2032
- Figure 79: South America Skin Care Products Market Revenue (Million), by Category 2024 & 2032
- Figure 80: South America Skin Care Products Market Volume (K Units), by Category 2024 & 2032
- Figure 81: South America Skin Care Products Market Revenue Share (%), by Category 2024 & 2032
- Figure 82: South America Skin Care Products Market Volume Share (%), by Category 2024 & 2032
- Figure 83: South America Skin Care Products Market Revenue (Million), by Distribution Channel 2024 & 2032
- Figure 84: South America Skin Care Products Market Volume (K Units), by Distribution Channel 2024 & 2032
- Figure 85: South America Skin Care Products Market Revenue Share (%), by Distribution Channel 2024 & 2032
- Figure 86: South America Skin Care Products Market Volume Share (%), by Distribution Channel 2024 & 2032
- Figure 87: South America Skin Care Products Market Revenue (Million), by Country 2024 & 2032
- Figure 88: South America Skin Care Products Market Volume (K Units), by Country 2024 & 2032
- Figure 89: South America Skin Care Products Market Revenue Share (%), by Country 2024 & 2032
- Figure 90: South America Skin Care Products Market Volume Share (%), by Country 2024 & 2032
- Figure 91: Middle East Skin Care Products Market Revenue (Million), by Product Type 2024 & 2032
- Figure 92: Middle East Skin Care Products Market Volume (K Units), by Product Type 2024 & 2032
- Figure 93: Middle East Skin Care Products Market Revenue Share (%), by Product Type 2024 & 2032
- Figure 94: Middle East Skin Care Products Market Volume Share (%), by Product Type 2024 & 2032
- Figure 95: Middle East Skin Care Products Market Revenue (Million), by Category 2024 & 2032
- Figure 96: Middle East Skin Care Products Market Volume (K Units), by Category 2024 & 2032
- Figure 97: Middle East Skin Care Products Market Revenue Share (%), by Category 2024 & 2032
- Figure 98: Middle East Skin Care Products Market Volume Share (%), by Category 2024 & 2032
- Figure 99: Middle East Skin Care Products Market Revenue (Million), by Distribution Channel 2024 & 2032
- Figure 100: Middle East Skin Care Products Market Volume (K Units), by Distribution Channel 2024 & 2032
- Figure 101: Middle East Skin Care Products Market Revenue Share (%), by Distribution Channel 2024 & 2032
- Figure 102: Middle East Skin Care Products Market Volume Share (%), by Distribution Channel 2024 & 2032
- Figure 103: Middle East Skin Care Products Market Revenue (Million), by Country 2024 & 2032
- Figure 104: Middle East Skin Care Products Market Volume (K Units), by Country 2024 & 2032
- Figure 105: Middle East Skin Care Products Market Revenue Share (%), by Country 2024 & 2032
- Figure 106: Middle East Skin Care Products Market Volume Share (%), by Country 2024 & 2032
- Figure 107: South Africa Skin Care Products Market Revenue (Million), by Product Type 2024 & 2032
- Figure 108: South Africa Skin Care Products Market Volume (K Units), by Product Type 2024 & 2032
- Figure 109: South Africa Skin Care Products Market Revenue Share (%), by Product Type 2024 & 2032
- Figure 110: South Africa Skin Care Products Market Volume Share (%), by Product Type 2024 & 2032
- Figure 111: South Africa Skin Care Products Market Revenue (Million), by Category 2024 & 2032
- Figure 112: South Africa Skin Care Products Market Volume (K Units), by Category 2024 & 2032
- Figure 113: South Africa Skin Care Products Market Revenue Share (%), by Category 2024 & 2032
- Figure 114: South Africa Skin Care Products Market Volume Share (%), by Category 2024 & 2032
- Figure 115: South Africa Skin Care Products Market Revenue (Million), by Distribution Channel 2024 & 2032
- Figure 116: South Africa Skin Care Products Market Volume (K Units), by Distribution Channel 2024 & 2032
- Figure 117: South Africa Skin Care Products Market Revenue Share (%), by Distribution Channel 2024 & 2032
- Figure 118: South Africa Skin Care Products Market Volume Share (%), by Distribution Channel 2024 & 2032
- Figure 119: South Africa Skin Care Products Market Revenue (Million), by Country 2024 & 2032
- Figure 120: South Africa Skin Care Products Market Volume (K Units), by Country 2024 & 2032
- Figure 121: South Africa Skin Care Products Market Revenue Share (%), by Country 2024 & 2032
- Figure 122: South Africa Skin Care Products Market Volume Share (%), by Country 2024 & 2032
List of Tables
- Table 1: Global Skin Care Products Market Revenue Million Forecast, by Region 2019 & 2032
- Table 2: Global Skin Care Products Market Volume K Units Forecast, by Region 2019 & 2032
- Table 3: Global Skin Care Products Market Revenue Million Forecast, by Product Type 2019 & 2032
- Table 4: Global Skin Care Products Market Volume K Units Forecast, by Product Type 2019 & 2032
- Table 5: Global Skin Care Products Market Revenue Million Forecast, by Category 2019 & 2032
- Table 6: Global Skin Care Products Market Volume K Units Forecast, by Category 2019 & 2032
- Table 7: Global Skin Care Products Market Revenue Million Forecast, by Distribution Channel 2019 & 2032
- Table 8: Global Skin Care Products Market Volume K Units Forecast, by Distribution Channel 2019 & 2032
- Table 9: Global Skin Care Products Market Revenue Million Forecast, by Region 2019 & 2032
- Table 10: Global Skin Care Products Market Volume K Units Forecast, by Region 2019 & 2032
- Table 11: Global Skin Care Products Market Revenue Million Forecast, by Country 2019 & 2032
- Table 12: Global Skin Care Products Market Volume K Units Forecast, by Country 2019 & 2032
- Table 13: United States Skin Care Products Market Revenue (Million) Forecast, by Application 2019 & 2032
- Table 14: United States Skin Care Products Market Volume (K Units) Forecast, by Application 2019 & 2032
- Table 15: Canada Skin Care Products Market Revenue (Million) Forecast, by Application 2019 & 2032
- Table 16: Canada Skin Care Products Market Volume (K Units) Forecast, by Application 2019 & 2032
- Table 17: Mexico Skin Care Products Market Revenue (Million) Forecast, by Application 2019 & 2032
- Table 18: Mexico Skin Care Products Market Volume (K Units) Forecast, by Application 2019 & 2032
- Table 19: Rest of North America Skin Care Products Market Revenue (Million) Forecast, by Application 2019 & 2032
- Table 20: Rest of North America Skin Care Products Market Volume (K Units) Forecast, by Application 2019 & 2032
- Table 21: Global Skin Care Products Market Revenue Million Forecast, by Country 2019 & 2032
- Table 22: Global Skin Care Products Market Volume K Units Forecast, by Country 2019 & 2032
- Table 23: United Kingdom Skin Care Products Market Revenue (Million) Forecast, by Application 2019 & 2032
- Table 24: United Kingdom Skin Care Products Market Volume (K Units) Forecast, by Application 2019 & 2032
- Table 25: Germany Skin Care Products Market Revenue (Million) Forecast, by Application 2019 & 2032
- Table 26: Germany Skin Care Products Market Volume (K Units) Forecast, by Application 2019 & 2032
- Table 27: Spain Skin Care Products Market Revenue (Million) Forecast, by Application 2019 & 2032
- Table 28: Spain Skin Care Products Market Volume (K Units) Forecast, by Application 2019 & 2032
- Table 29: France Skin Care Products Market Revenue (Million) Forecast, by Application 2019 & 2032
- Table 30: France Skin Care Products Market Volume (K Units) Forecast, by Application 2019 & 2032
- Table 31: Italy Skin Care Products Market Revenue (Million) Forecast, by Application 2019 & 2032
- Table 32: Italy Skin Care Products Market Volume (K Units) Forecast, by Application 2019 & 2032
- Table 33: Russia Skin Care Products Market Revenue (Million) Forecast, by Application 2019 & 2032
- Table 34: Russia Skin Care Products Market Volume (K Units) Forecast, by Application 2019 & 2032
- Table 35: Rest of Europe Skin Care Products Market Revenue (Million) Forecast, by Application 2019 & 2032
- Table 36: Rest of Europe Skin Care Products Market Volume (K Units) Forecast, by Application 2019 & 2032
- Table 37: Global Skin Care Products Market Revenue Million Forecast, by Country 2019 & 2032
- Table 38: Global Skin Care Products Market Volume K Units Forecast, by Country 2019 & 2032
- Table 39: China Skin Care Products Market Revenue (Million) Forecast, by Application 2019 & 2032
- Table 40: China Skin Care Products Market Volume (K Units) Forecast, by Application 2019 & 2032
- Table 41: Japan Skin Care Products Market Revenue (Million) Forecast, by Application 2019 & 2032
- Table 42: Japan Skin Care Products Market Volume (K Units) Forecast, by Application 2019 & 2032
- Table 43: India Skin Care Products Market Revenue (Million) Forecast, by Application 2019 & 2032
- Table 44: India Skin Care Products Market Volume (K Units) Forecast, by Application 2019 & 2032
- Table 45: Australia Skin Care Products Market Revenue (Million) Forecast, by Application 2019 & 2032
- Table 46: Australia Skin Care Products Market Volume (K Units) Forecast, by Application 2019 & 2032
- Table 47: Rest of Asia Pacific Skin Care Products Market Revenue (Million) Forecast, by Application 2019 & 2032
- Table 48: Rest of Asia Pacific Skin Care Products Market Volume (K Units) Forecast, by Application 2019 & 2032
- Table 49: Global Skin Care Products Market Revenue Million Forecast, by Country 2019 & 2032
- Table 50: Global Skin Care Products Market Volume K Units Forecast, by Country 2019 & 2032
- Table 51: Brazil Skin Care Products Market Revenue (Million) Forecast, by Application 2019 & 2032
- Table 52: Brazil Skin Care Products Market Volume (K Units) Forecast, by Application 2019 & 2032
- Table 53: Argentina Skin Care Products Market Revenue (Million) Forecast, by Application 2019 & 2032
- Table 54: Argentina Skin Care Products Market Volume (K Units) Forecast, by Application 2019 & 2032
- Table 55: Rest of South America Skin Care Products Market Revenue (Million) Forecast, by Application 2019 & 2032
- Table 56: Rest of South America Skin Care Products Market Volume (K Units) Forecast, by Application 2019 & 2032
- Table 57: Global Skin Care Products Market Revenue Million Forecast, by Country 2019 & 2032
- Table 58: Global Skin Care Products Market Volume K Units Forecast, by Country 2019 & 2032
- Table 59: Skin Care Products Market Revenue (Million) Forecast, by Application 2019 & 2032
- Table 60: Skin Care Products Market Volume (K Units) Forecast, by Application 2019 & 2032
- Table 61: Global Skin Care Products Market Revenue Million Forecast, by Country 2019 & 2032
- Table 62: Global Skin Care Products Market Volume K Units Forecast, by Country 2019 & 2032
- Table 63: Saudi Arabia Skin Care Products Market Revenue (Million) Forecast, by Application 2019 & 2032
- Table 64: Saudi Arabia Skin Care Products Market Volume (K Units) Forecast, by Application 2019 & 2032
- Table 65: Rest of Middle East Skin Care Products Market Revenue (Million) Forecast, by Application 2019 & 2032
- Table 66: Rest of Middle East Skin Care Products Market Volume (K Units) Forecast, by Application 2019 & 2032
- Table 67: Global Skin Care Products Market Revenue Million Forecast, by Product Type 2019 & 2032
- Table 68: Global Skin Care Products Market Volume K Units Forecast, by Product Type 2019 & 2032
- Table 69: Global Skin Care Products Market Revenue Million Forecast, by Category 2019 & 2032
- Table 70: Global Skin Care Products Market Volume K Units Forecast, by Category 2019 & 2032
- Table 71: Global Skin Care Products Market Revenue Million Forecast, by Distribution Channel 2019 & 2032
- Table 72: Global Skin Care Products Market Volume K Units Forecast, by Distribution Channel 2019 & 2032
- Table 73: Global Skin Care Products Market Revenue Million Forecast, by Country 2019 & 2032
- Table 74: Global Skin Care Products Market Volume K Units Forecast, by Country 2019 & 2032
- Table 75: United States Skin Care Products Market Revenue (Million) Forecast, by Application 2019 & 2032
- Table 76: United States Skin Care Products Market Volume (K Units) Forecast, by Application 2019 & 2032
- Table 77: Canada Skin Care Products Market Revenue (Million) Forecast, by Application 2019 & 2032
- Table 78: Canada Skin Care Products Market Volume (K Units) Forecast, by Application 2019 & 2032
- Table 79: Mexico Skin Care Products Market Revenue (Million) Forecast, by Application 2019 & 2032
- Table 80: Mexico Skin Care Products Market Volume (K Units) Forecast, by Application 2019 & 2032
- Table 81: Rest of North America Skin Care Products Market Revenue (Million) Forecast, by Application 2019 & 2032
- Table 82: Rest of North America Skin Care Products Market Volume (K Units) Forecast, by Application 2019 & 2032
- Table 83: Global Skin Care Products Market Revenue Million Forecast, by Product Type 2019 & 2032
- Table 84: Global Skin Care Products Market Volume K Units Forecast, by Product Type 2019 & 2032
- Table 85: Global Skin Care Products Market Revenue Million Forecast, by Category 2019 & 2032
- Table 86: Global Skin Care Products Market Volume K Units Forecast, by Category 2019 & 2032
- Table 87: Global Skin Care Products Market Revenue Million Forecast, by Distribution Channel 2019 & 2032
- Table 88: Global Skin Care Products Market Volume K Units Forecast, by Distribution Channel 2019 & 2032
- Table 89: Global Skin Care Products Market Revenue Million Forecast, by Country 2019 & 2032
- Table 90: Global Skin Care Products Market Volume K Units Forecast, by Country 2019 & 2032
- Table 91: United Kingdom Skin Care Products Market Revenue (Million) Forecast, by Application 2019 & 2032
- Table 92: United Kingdom Skin Care Products Market Volume (K Units) Forecast, by Application 2019 & 2032
- Table 93: Germany Skin Care Products Market Revenue (Million) Forecast, by Application 2019 & 2032
- Table 94: Germany Skin Care Products Market Volume (K Units) Forecast, by Application 2019 & 2032
- Table 95: Spain Skin Care Products Market Revenue (Million) Forecast, by Application 2019 & 2032
- Table 96: Spain Skin Care Products Market Volume (K Units) Forecast, by Application 2019 & 2032
- Table 97: France Skin Care Products Market Revenue (Million) Forecast, by Application 2019 & 2032
- Table 98: France Skin Care Products Market Volume (K Units) Forecast, by Application 2019 & 2032
- Table 99: Italy Skin Care Products Market Revenue (Million) Forecast, by Application 2019 & 2032
- Table 100: Italy Skin Care Products Market Volume (K Units) Forecast, by Application 2019 & 2032
- Table 101: Russia Skin Care Products Market Revenue (Million) Forecast, by Application 2019 & 2032
- Table 102: Russia Skin Care Products Market Volume (K Units) Forecast, by Application 2019 & 2032
- Table 103: Rest of Europe Skin Care Products Market Revenue (Million) Forecast, by Application 2019 & 2032
- Table 104: Rest of Europe Skin Care Products Market Volume (K Units) Forecast, by Application 2019 & 2032
- Table 105: Global Skin Care Products Market Revenue Million Forecast, by Product Type 2019 & 2032
- Table 106: Global Skin Care Products Market Volume K Units Forecast, by Product Type 2019 & 2032
- Table 107: Global Skin Care Products Market Revenue Million Forecast, by Category 2019 & 2032
- Table 108: Global Skin Care Products Market Volume K Units Forecast, by Category 2019 & 2032
- Table 109: Global Skin Care Products Market Revenue Million Forecast, by Distribution Channel 2019 & 2032
- Table 110: Global Skin Care Products Market Volume K Units Forecast, by Distribution Channel 2019 & 2032
- Table 111: Global Skin Care Products Market Revenue Million Forecast, by Country 2019 & 2032
- Table 112: Global Skin Care Products Market Volume K Units Forecast, by Country 2019 & 2032
- Table 113: China Skin Care Products Market Revenue (Million) Forecast, by Application 2019 & 2032
- Table 114: China Skin Care Products Market Volume (K Units) Forecast, by Application 2019 & 2032
- Table 115: Japan Skin Care Products Market Revenue (Million) Forecast, by Application 2019 & 2032
- Table 116: Japan Skin Care Products Market Volume (K Units) Forecast, by Application 2019 & 2032
- Table 117: India Skin Care Products Market Revenue (Million) Forecast, by Application 2019 & 2032
- Table 118: India Skin Care Products Market Volume (K Units) Forecast, by Application 2019 & 2032
- Table 119: Australia Skin Care Products Market Revenue (Million) Forecast, by Application 2019 & 2032
- Table 120: Australia Skin Care Products Market Volume (K Units) Forecast, by Application 2019 & 2032
- Table 121: Rest of Asia Pacific Skin Care Products Market Revenue (Million) Forecast, by Application 2019 & 2032
- Table 122: Rest of Asia Pacific Skin Care Products Market Volume (K Units) Forecast, by Application 2019 & 2032
- Table 123: Global Skin Care Products Market Revenue Million Forecast, by Product Type 2019 & 2032
- Table 124: Global Skin Care Products Market Volume K Units Forecast, by Product Type 2019 & 2032
- Table 125: Global Skin Care Products Market Revenue Million Forecast, by Category 2019 & 2032
- Table 126: Global Skin Care Products Market Volume K Units Forecast, by Category 2019 & 2032
- Table 127: Global Skin Care Products Market Revenue Million Forecast, by Distribution Channel 2019 & 2032
- Table 128: Global Skin Care Products Market Volume K Units Forecast, by Distribution Channel 2019 & 2032
- Table 129: Global Skin Care Products Market Revenue Million Forecast, by Country 2019 & 2032
- Table 130: Global Skin Care Products Market Volume K Units Forecast, by Country 2019 & 2032
- Table 131: Brazil Skin Care Products Market Revenue (Million) Forecast, by Application 2019 & 2032
- Table 132: Brazil Skin Care Products Market Volume (K Units) Forecast, by Application 2019 & 2032
- Table 133: Argentina Skin Care Products Market Revenue (Million) Forecast, by Application 2019 & 2032
- Table 134: Argentina Skin Care Products Market Volume (K Units) Forecast, by Application 2019 & 2032
- Table 135: Rest of South America Skin Care Products Market Revenue (Million) Forecast, by Application 2019 & 2032
- Table 136: Rest of South America Skin Care Products Market Volume (K Units) Forecast, by Application 2019 & 2032
- Table 137: Global Skin Care Products Market Revenue Million Forecast, by Product Type 2019 & 2032
- Table 138: Global Skin Care Products Market Volume K Units Forecast, by Product Type 2019 & 2032
- Table 139: Global Skin Care Products Market Revenue Million Forecast, by Category 2019 & 2032
- Table 140: Global Skin Care Products Market Volume K Units Forecast, by Category 2019 & 2032
- Table 141: Global Skin Care Products Market Revenue Million Forecast, by Distribution Channel 2019 & 2032
- Table 142: Global Skin Care Products Market Volume K Units Forecast, by Distribution Channel 2019 & 2032
- Table 143: Global Skin Care Products Market Revenue Million Forecast, by Country 2019 & 2032
- Table 144: Global Skin Care Products Market Volume K Units Forecast, by Country 2019 & 2032
- Table 145: Global Skin Care Products Market Revenue Million Forecast, by Product Type 2019 & 2032
- Table 146: Global Skin Care Products Market Volume K Units Forecast, by Product Type 2019 & 2032
- Table 147: Global Skin Care Products Market Revenue Million Forecast, by Category 2019 & 2032
- Table 148: Global Skin Care Products Market Volume K Units Forecast, by Category 2019 & 2032
- Table 149: Global Skin Care Products Market Revenue Million Forecast, by Distribution Channel 2019 & 2032
- Table 150: Global Skin Care Products Market Volume K Units Forecast, by Distribution Channel 2019 & 2032
- Table 151: Global Skin Care Products Market Revenue Million Forecast, by Country 2019 & 2032
- Table 152: Global Skin Care Products Market Volume K Units Forecast, by Country 2019 & 2032
- Table 153: Saudi Arabia Skin Care Products Market Revenue (Million) Forecast, by Application 2019 & 2032
- Table 154: Saudi Arabia Skin Care Products Market Volume (K Units) Forecast, by Application 2019 & 2032
- Table 155: Rest of Middle East Skin Care Products Market Revenue (Million) Forecast, by Application 2019 & 2032
- Table 156: Rest of Middle East Skin Care Products Market Volume (K Units) Forecast, by Application 2019 & 2032
Frequently Asked Questions
1. What is the projected Compound Annual Growth Rate (CAGR) of the Skin Care Products Market?
The projected CAGR is approximately 4.69%.
2. Which companies are prominent players in the Skin Care Products Market?
Key companies in the market include Amorepacific Corporation, The Estée Lauder Companies Inc, Shiseido Company Limited, maxingvest AG (Beiersdorf AG), Unilever PLC, Colgate-Palmolive Company*List Not Exhaustive, L'Oréal S A, Johnson & Johnson Services Inc, Procter & Gamble Company, Kao Corporation.
3. What are the main segments of the Skin Care Products Market?
The market segments include Product Type, Category, Distribution Channel.
4. Can you provide details about the market size?
The market size is estimated to be USD XX Million as of 2022.
5. What are some drivers contributing to market growth?
Rising Demand for Natural/Organic Formulation Skincare Products Via E-Commerce; Augmented Expenditure on Marketing and Promotional Activities.
6. What are the notable trends driving market growth?
Growing Demand for Anti-Aging and Anti-Pollution Ranges.
7. Are there any restraints impacting market growth?
Touch and Feel Factor Restraining the Market Growth.
8. Can you provide examples of recent developments in the market?
January 2022: L'Oreal and Verily announced a strategic partnership exclusive to beauty to advance skin health. The groundbreaking collaboration between the beauty industry and L'Oréal will comprise two initiatives aimed at better defining and understanding skin and hair aging mechanisms and guiding the company's precision beauty tech strategy and product development.
9. What pricing options are available for accessing the report?
Pricing options include single-user, multi-user, and enterprise licenses priced at USD 4750, USD 5250, and USD 8750 respectively.
10. Is the market size provided in terms of value or volume?
The market size is provided in terms of value, measured in Million and volume, measured in K Units.
11. Are there any specific market keywords associated with the report?
Yes, the market keyword associated with the report is "Skin Care Products Market," which aids in identifying and referencing the specific market segment covered.
12. How do I determine which pricing option suits my needs best?
The pricing options vary based on user requirements and access needs. Individual users may opt for single-user licenses, while businesses requiring broader access may choose multi-user or enterprise licenses for cost-effective access to the report.
13. Are there any additional resources or data provided in the Skin Care Products Market report?
While the report offers comprehensive insights, it's advisable to review the specific contents or supplementary materials provided to ascertain if additional resources or data are available.
14. How can I stay updated on further developments or reports in the Skin Care Products Market?
To stay informed about further developments, trends, and reports in the Skin Care Products Market, consider subscribing to industry newsletters, following relevant companies and organizations, or regularly checking reputable industry news sources and publications.
Methodology
Step 1 - Identification of Relevant Samples Size from Population Database


Step 2 - Approaches for Defining Global Market Size (Value, Volume* & Price*)

Note*: In applicable scenarios
Step 3 - Data Sources
Primary Research
- Web Analytics
- Survey Reports
- Research Institute
- Latest Research Reports
- Opinion Leaders
Secondary Research
- Annual Reports
- White Paper
- Latest Press Release
- Industry Association
- Paid Database
- Investor Presentations

Step 4 - Data Triangulation
Involves using different sources of information in order to increase the validity of a study
These sources are likely to be stakeholders in a program - participants, other researchers, program staff, other community members, and so on.
Then we put all data in single framework & apply various statistical tools to find out the dynamic on the market.
During the analysis stage, feedback from the stakeholder groups would be compared to determine areas of agreement as well as areas of divergence


