

Key Insights
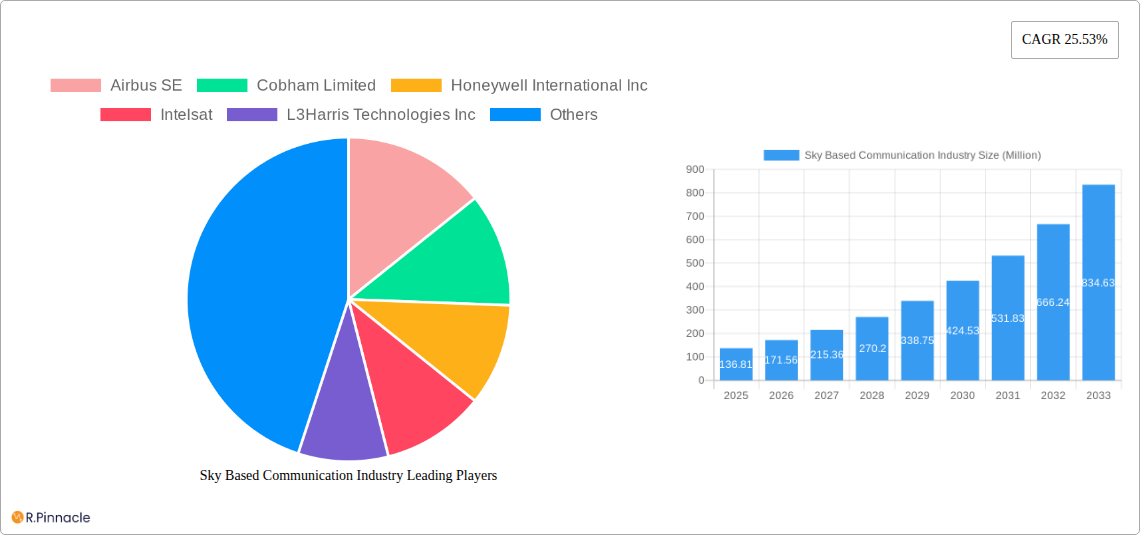
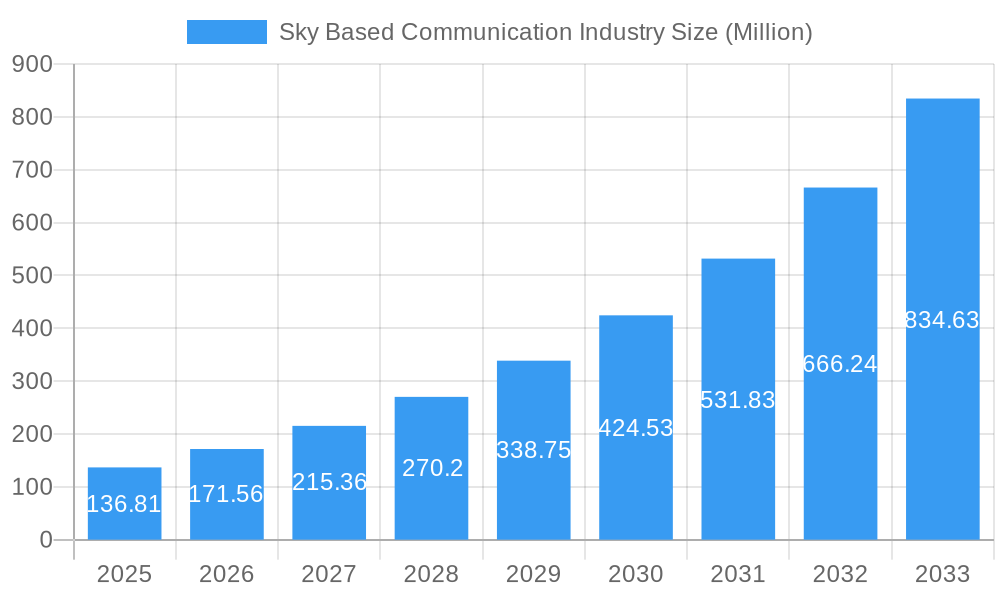
The sky-based communication industry, valued at $136.81 million in 2025, is experiencing robust growth, projected to expand at a compound annual growth rate (CAGR) of 25.53% from 2025 to 2033. This expansion is fueled by several key factors. The increasing demand for high-speed, reliable connectivity across diverse sectors, including aviation, maritime, and remote areas, is a significant driver. Technological advancements, such as the deployment of Low Earth Orbit (LEO) satellite constellations offering enhanced bandwidth and lower latency, are revolutionizing the industry. Furthermore, the growing adoption of Internet of Things (IoT) devices and the need for seamless global connectivity are bolstering market growth. Government initiatives promoting satellite communication infrastructure and advancements in satellite technology further contribute to this positive outlook.
Sky Based Communication Industry Market Size (In Million)
However, the industry also faces certain challenges. High initial investment costs associated with satellite development and launch remain a barrier to entry for smaller players. Regulatory hurdles and spectrum allocation complexities across different regions can also hinder market expansion. Furthermore, the industry's reliance on space-based infrastructure makes it susceptible to geopolitical risks and potential disruptions. Despite these restraints, the long-term growth prospects remain strong, driven by the insatiable demand for ubiquitous connectivity and the continuous innovation in satellite technology. Key players like Airbus SE, Cobham Limited, and Honeywell International Inc. are strategically positioning themselves to capitalize on these opportunities through mergers, acquisitions, and the development of cutting-edge solutions. The industry is poised for significant expansion in the coming years, transforming how we connect across the globe.
Sky Based Communication Industry Company Market Share
Sky Based Communication Industry Market Report: 2019-2033
This comprehensive report provides an in-depth analysis of the Sky Based Communication Industry, projecting a market value exceeding $XX Million by 2033. Leveraging data from 2019-2024 (Historical Period), with 2025 as the Base Year and Estimated Year, this report forecasts market trends from 2025-2033 (Forecast Period). The analysis includes key players like Airbus SE, Cobham Limited, Honeywell International Inc, Intelsat, L3Harris Technologies Inc, Maxar Technologies Inc, THALES, Viasat Inc, Inmarsat Global Limited, and Iridium Communications Inc, and offers actionable insights for industry professionals.
Sky Based Communication Industry Market Structure & Innovation Trends
This section analyzes the market's competitive landscape, identifying key trends shaping its evolution. The industry exhibits a moderately consolidated structure, with several major players holding significant market share. For example, Airbus SE and Boeing hold approximately xx% of the market share combined in the satellite manufacturing segment, while Viasat Inc and Inmarsat Global Limited lead in providing satellite communication services. M&A activity has been significant, with deals exceeding $XX Million in the past five years. Innovation is driven by advancements in satellite technology, including the rise of Low Earth Orbit (LEO) constellations and the development of high-throughput satellites (HTS). Regulatory frameworks, including spectrum allocation and international agreements, significantly impact industry growth. The industry faces competition from terrestrial communication technologies like 5G, but its unique advantages in remote areas and disaster relief ensure its continued relevance.
- Market Concentration: Moderately consolidated, with top players holding xx% combined market share.
- Innovation Drivers: LEO constellations, HTS technology, and improved data encryption.
- M&A Activity: Deals valued at over $XX Million in the past five years.
- Regulatory Landscape: Spectrum allocation, international agreements, and cybersecurity regulations.
- Product Substitutes: Terrestrial communication networks (e.g., 5G).
Sky Based Communication Industry Market Dynamics & Trends
The Sky Based Communication Industry is experiencing robust growth, driven by increasing demand for high-bandwidth connectivity across various sectors, including defense, aviation, maritime, and consumer markets. The Compound Annual Growth Rate (CAGR) is projected at xx% from 2025 to 2033, primarily fuelled by the expansion of LEO satellite constellations, improved satellite technology, and substantial investments in the sector. Market penetration is steadily increasing, particularly in underserved regions with limited terrestrial infrastructure. Consumer preferences are shifting toward higher data speeds and more reliable connectivity, further driving market growth. Competitive dynamics are characterized by technological advancements and strategic partnerships, fostering innovation.
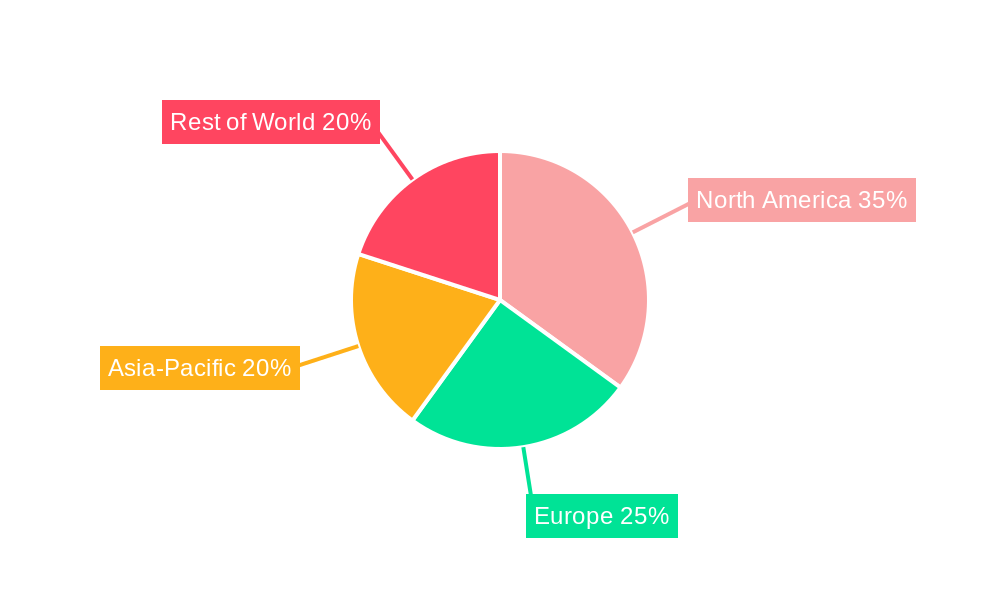
Dominant Regions & Segments in Sky Based Communication Industry
North America currently dominates the Sky Based Communication Industry, fueled by robust government investments in defense and aerospace, a well-developed infrastructure, and significant private sector participation.
- Key Drivers in North America:
- High government spending on defense and space programs.
- Advanced technological infrastructure.
- Strong private sector investment and innovation.
- Dominance Analysis: North America's early adoption of satellite technology and consistent government support contribute significantly to its leading position. Europe and Asia Pacific are also experiencing substantial growth, driven by expanding telecommunication infrastructure and the increasing demand for broadband connectivity in these regions.
Sky Based Communication Industry Product Innovations
Recent product innovations focus on higher throughput, enhanced security, and reduced latency. The development of LEO satellite constellations and the implementation of advanced data encryption techniques are key examples. These innovations address market demand for seamless, high-bandwidth connectivity across diverse applications, offering a competitive advantage through superior performance and reliability.
Report Scope & Segmentation Analysis
The report segments the market by type (e.g., GEO, LEO, MEO), application (e.g., aerospace, maritime, defense), and end-user (e.g., government, commercial). Growth projections vary across segments, with the LEO segment exhibiting the highest growth potential due to its capacity for higher bandwidth and lower latency. Market sizes are calculated based on revenue and number of units, considering competitive dynamics within each segment.
Key Drivers of Sky Based Communication Industry Growth
Several factors drive industry growth, including:
- Technological advancements: LEO constellations, HTS, and improved data encryption.
- Economic growth: Increased investment in infrastructure and expanding broadband access.
- Government regulations: Favorable policies and spectrum allocations.
Challenges in the Sky Based Communication Industry Sector
Challenges include:
- Regulatory hurdles: Complex licensing and spectrum allocation processes.
- Supply chain issues: Dependence on specialized components and manufacturing expertise.
- Competitive pressures: Intense rivalry among established players and emerging entrants.
Emerging Opportunities in Sky Based Communication Industry
Opportunities abound in:
- New market penetration: Expanding into underserved regions and emerging economies.
- Technological breakthroughs: Developing advanced satellite technologies and improving network performance.
- Innovative applications: Exploring new applications across various sectors (IoT, autonomous vehicles).
Leading Players in the Sky Based Communication Industry Market
Key Developments in Sky Based Communication Industry Industry
- February 2024: Northrop Grumman awarded Viasat Inc. a contract to integrate Viasat-3 Satellite Communications Network into US Air Force operations, enhancing military communications.
- October 2023: Honeywell secured a USD 900 Million contract from the US Space Force to support its Proliferated Low Earth Orbit program.
Future Outlook for Sky Based Communication Industry Market
The future of the Sky Based Communication Industry is bright, with continued growth fueled by technological advancements, increasing demand for global connectivity, and ongoing investments in satellite infrastructure. Strategic partnerships and innovation will play a crucial role in shaping the industry's future landscape, opening up new opportunities for market expansion and creating a more interconnected world.
Sky Based Communication Industry Segmentation
-
1. Application
- 1.1. Telecommunication
- 1.2. Broadband
- 1.3. Navigation
- 1.4. Remote Sensing
- 1.5. Broadcasting
- 1.6. Other Applications
-
2. Type
- 2.1. Low Earth Orbit (LEO)
- 2.2. Medium Earth Orbit (MEO)
-
3. End User
- 3.1. Military and Government
- 3.2. Commercial
Sky Based Communication Industry Segmentation By Geography
-
1. North America
- 1.1. United States
- 1.2. Canada
-
2. Europe
- 2.1. United Kingdom
- 2.2. France
- 2.3. Germany
- 2.4. Russia
- 2.5. Rest of Europe
-
3. Asia Pacific
- 3.1. India
- 3.2. China
- 3.3. Japan
- 3.4. South Korea
- 3.5. Rest of Asia Pacific
-
4. Latin America
- 4.1. Brazil
- 4.2. Rest of Latin America
-
5. Middle East and Africa
- 5.1. United Arab Emirates
- 5.2. Saudi Arabia
- 5.3. Israel
- 5.4. Rest of Middle East and Africa
Sky Based Communication Industry Regional Market Share
Geographic Coverage of Sky Based Communication Industry
Sky Based Communication Industry REPORT HIGHLIGHTS
| Aspects | Details |
|---|---|
| Study Period | 2020-2034 |
| Base Year | 2025 |
| Estimated Year | 2026 |
| Forecast Period | 2026-2034 |
| Historical Period | 2020-2025 |
| Growth Rate | CAGR of 25.53% from 2020-2034 |
| Segmentation |
|
Table of Contents
- 1. Introduction
- 1.1. Research Scope
- 1.2. Market Segmentation
- 1.3. Research Objective
- 1.4. Definitions and Assumptions
- 2. Executive Summary
- 2.1. Market Snapshot
- 3. Market Dynamics
- 3.1. Market Drivers
- 3.2. Market Restrains
- 3.3. Market Trends
- 3.4. Market Opportunities
- 4. Market Factor Analysis
- 4.1. Porters Five Forces
- 4.1.1. Bargaining Power of Suppliers
- 4.1.2. Bargaining Power of Buyers
- 4.1.3. Threat of New Entrants
- 4.1.4. Threat of Substitutes
- 4.1.5. Competitive Rivalry
- 4.2. PESTEL analysis
- 4.3. BCG Analysis
- 4.3.1. Stars (High Growth, High Market Share)
- 4.3.2. Cash Cows (Low Growth, High Market Share)
- 4.3.3. Question Mark (High Growth, Low Market Share)
- 4.3.4. Dogs (Low Growth, Low Market Share)
- 4.4. Ansoff Matrix Analysis
- 4.5. Supply Chain Analysis
- 4.6. Regulatory Landscape
- 4.7. Current Market Potential and Opportunity Assessment (TAM–SAM–SOM Framework)
- 4.8. PRI Analyst Note
- 4.1. Porters Five Forces
- 5. Market Analysis, Insights and Forecast 2021-2033
- 5.1. Market Analysis, Insights and Forecast - by Application
- 5.1.1. Telecommunication
- 5.1.2. Broadband
- 5.1.3. Navigation
- 5.1.4. Remote Sensing
- 5.1.5. Broadcasting
- 5.1.6. Other Applications
- 5.2. Market Analysis, Insights and Forecast - by Type
- 5.2.1. Low Earth Orbit (LEO)
- 5.2.2. Medium Earth Orbit (MEO)
- 5.3. Market Analysis, Insights and Forecast - by End User
- 5.3.1. Military and Government
- 5.3.2. Commercial
- 5.4. Market Analysis, Insights and Forecast - by Region
- 5.4.1. North America
- 5.4.2. Europe
- 5.4.3. Asia Pacific
- 5.4.4. Latin America
- 5.4.5. Middle East and Africa
- 5.1. Market Analysis, Insights and Forecast - by Application
- 6. Global Sky Based Communication Industry Analysis, Insights and Forecast, 2021-2033
- 6.1. Market Analysis, Insights and Forecast - by Application
- 6.1.1. Telecommunication
- 6.1.2. Broadband
- 6.1.3. Navigation
- 6.1.4. Remote Sensing
- 6.1.5. Broadcasting
- 6.1.6. Other Applications
- 6.2. Market Analysis, Insights and Forecast - by Type
- 6.2.1. Low Earth Orbit (LEO)
- 6.2.2. Medium Earth Orbit (MEO)
- 6.3. Market Analysis, Insights and Forecast - by End User
- 6.3.1. Military and Government
- 6.3.2. Commercial
- 6.1. Market Analysis, Insights and Forecast - by Application
- 7. North America Sky Based Communication Industry Analysis, Insights and Forecast, 2020-2032
- 7.1. Market Analysis, Insights and Forecast - by Application
- 7.1.1. Telecommunication
- 7.1.2. Broadband
- 7.1.3. Navigation
- 7.1.4. Remote Sensing
- 7.1.5. Broadcasting
- 7.1.6. Other Applications
- 7.2. Market Analysis, Insights and Forecast - by Type
- 7.2.1. Low Earth Orbit (LEO)
- 7.2.2. Medium Earth Orbit (MEO)
- 7.3. Market Analysis, Insights and Forecast - by End User
- 7.3.1. Military and Government
- 7.3.2. Commercial
- 7.1. Market Analysis, Insights and Forecast - by Application
- 8. Europe Sky Based Communication Industry Analysis, Insights and Forecast, 2020-2032
- 8.1. Market Analysis, Insights and Forecast - by Application
- 8.1.1. Telecommunication
- 8.1.2. Broadband
- 8.1.3. Navigation
- 8.1.4. Remote Sensing
- 8.1.5. Broadcasting
- 8.1.6. Other Applications
- 8.2. Market Analysis, Insights and Forecast - by Type
- 8.2.1. Low Earth Orbit (LEO)
- 8.2.2. Medium Earth Orbit (MEO)
- 8.3. Market Analysis, Insights and Forecast - by End User
- 8.3.1. Military and Government
- 8.3.2. Commercial
- 8.1. Market Analysis, Insights and Forecast - by Application
- 9. Asia Pacific Sky Based Communication Industry Analysis, Insights and Forecast, 2020-2032
- 9.1. Market Analysis, Insights and Forecast - by Application
- 9.1.1. Telecommunication
- 9.1.2. Broadband
- 9.1.3. Navigation
- 9.1.4. Remote Sensing
- 9.1.5. Broadcasting
- 9.1.6. Other Applications
- 9.2. Market Analysis, Insights and Forecast - by Type
- 9.2.1. Low Earth Orbit (LEO)
- 9.2.2. Medium Earth Orbit (MEO)
- 9.3. Market Analysis, Insights and Forecast - by End User
- 9.3.1. Military and Government
- 9.3.2. Commercial
- 9.1. Market Analysis, Insights and Forecast - by Application
- 10. Latin America Sky Based Communication Industry Analysis, Insights and Forecast, 2020-2032
- 10.1. Market Analysis, Insights and Forecast - by Application
- 10.1.1. Telecommunication
- 10.1.2. Broadband
- 10.1.3. Navigation
- 10.1.4. Remote Sensing
- 10.1.5. Broadcasting
- 10.1.6. Other Applications
- 10.2. Market Analysis, Insights and Forecast - by Type
- 10.2.1. Low Earth Orbit (LEO)
- 10.2.2. Medium Earth Orbit (MEO)
- 10.3. Market Analysis, Insights and Forecast - by End User
- 10.3.1. Military and Government
- 10.3.2. Commercial
- 10.1. Market Analysis, Insights and Forecast - by Application
- 11. Middle East and Africa Sky Based Communication Industry Analysis, Insights and Forecast, 2020-2032
- 11.1. Market Analysis, Insights and Forecast - by Application
- 11.1.1. Telecommunication
- 11.1.2. Broadband
- 11.1.3. Navigation
- 11.1.4. Remote Sensing
- 11.1.5. Broadcasting
- 11.1.6. Other Applications
- 11.2. Market Analysis, Insights and Forecast - by Type
- 11.2.1. Low Earth Orbit (LEO)
- 11.2.2. Medium Earth Orbit (MEO)
- 11.3. Market Analysis, Insights and Forecast - by End User
- 11.3.1. Military and Government
- 11.3.2. Commercial
- 11.1. Market Analysis, Insights and Forecast - by Application
- 12. Competitive Analysis
- 12.1. Company Profiles
- 12.1.1 Airbus SE
- 12.1.1.1. Company Overview
- 12.1.1.2. Products
- 12.1.1.3. Company Financials
- 12.1.1.4. SWOT Analysis
- 12.1.2 Cobham Limited
- 12.1.2.1. Company Overview
- 12.1.2.2. Products
- 12.1.2.3. Company Financials
- 12.1.2.4. SWOT Analysis
- 12.1.3 Honeywell International Inc
- 12.1.3.1. Company Overview
- 12.1.3.2. Products
- 12.1.3.3. Company Financials
- 12.1.3.4. SWOT Analysis
- 12.1.4 Intelsat
- 12.1.4.1. Company Overview
- 12.1.4.2. Products
- 12.1.4.3. Company Financials
- 12.1.4.4. SWOT Analysis
- 12.1.5 L3Harris Technologies Inc
- 12.1.5.1. Company Overview
- 12.1.5.2. Products
- 12.1.5.3. Company Financials
- 12.1.5.4. SWOT Analysis
- 12.1.6 Maxar Technologies Inc
- 12.1.6.1. Company Overview
- 12.1.6.2. Products
- 12.1.6.3. Company Financials
- 12.1.6.4. SWOT Analysis
- 12.1.7 THALES
- 12.1.7.1. Company Overview
- 12.1.7.2. Products
- 12.1.7.3. Company Financials
- 12.1.7.4. SWOT Analysis
- 12.1.8 Viasat Inc
- 12.1.8.1. Company Overview
- 12.1.8.2. Products
- 12.1.8.3. Company Financials
- 12.1.8.4. SWOT Analysis
- 12.1.9 Inmarsat Global Limited
- 12.1.9.1. Company Overview
- 12.1.9.2. Products
- 12.1.9.3. Company Financials
- 12.1.9.4. SWOT Analysis
- 12.1.10 Iridium Communications Inc
- 12.1.10.1. Company Overview
- 12.1.10.2. Products
- 12.1.10.3. Company Financials
- 12.1.10.4. SWOT Analysis
- 12.1.1 Airbus SE
- 12.2. Market Entropy
- 12.2.1 Company's Key Areas Served
- 12.2.2 Recent Developments
- 12.3. Company Market Share Analysis 2025
- 12.3.1 Top 5 Companies Market Share Analysis
- 12.3.2 Top 3 Companies Market Share Analysis
- 12.4. List of Potential Customers
- 13. Research Methodology
List of Figures
- Figure 1: Global Sky Based Communication Industry Revenue Breakdown (Million, %) by Region 2025 & 2033
- Figure 2: Global Sky Based Communication Industry Volume Breakdown (Billion, %) by Region 2025 & 2033
- Figure 3: North America Sky Based Communication Industry Revenue (Million), by Application 2025 & 2033
- Figure 4: North America Sky Based Communication Industry Volume (Billion), by Application 2025 & 2033
- Figure 5: North America Sky Based Communication Industry Revenue Share (%), by Application 2025 & 2033
- Figure 6: North America Sky Based Communication Industry Volume Share (%), by Application 2025 & 2033
- Figure 7: North America Sky Based Communication Industry Revenue (Million), by Type 2025 & 2033
- Figure 8: North America Sky Based Communication Industry Volume (Billion), by Type 2025 & 2033
- Figure 9: North America Sky Based Communication Industry Revenue Share (%), by Type 2025 & 2033
- Figure 10: North America Sky Based Communication Industry Volume Share (%), by Type 2025 & 2033
- Figure 11: North America Sky Based Communication Industry Revenue (Million), by End User 2025 & 2033
- Figure 12: North America Sky Based Communication Industry Volume (Billion), by End User 2025 & 2033
- Figure 13: North America Sky Based Communication Industry Revenue Share (%), by End User 2025 & 2033
- Figure 14: North America Sky Based Communication Industry Volume Share (%), by End User 2025 & 2033
- Figure 15: North America Sky Based Communication Industry Revenue (Million), by Country 2025 & 2033
- Figure 16: North America Sky Based Communication Industry Volume (Billion), by Country 2025 & 2033
- Figure 17: North America Sky Based Communication Industry Revenue Share (%), by Country 2025 & 2033
- Figure 18: North America Sky Based Communication Industry Volume Share (%), by Country 2025 & 2033
- Figure 19: Europe Sky Based Communication Industry Revenue (Million), by Application 2025 & 2033
- Figure 20: Europe Sky Based Communication Industry Volume (Billion), by Application 2025 & 2033
- Figure 21: Europe Sky Based Communication Industry Revenue Share (%), by Application 2025 & 2033
- Figure 22: Europe Sky Based Communication Industry Volume Share (%), by Application 2025 & 2033
- Figure 23: Europe Sky Based Communication Industry Revenue (Million), by Type 2025 & 2033
- Figure 24: Europe Sky Based Communication Industry Volume (Billion), by Type 2025 & 2033
- Figure 25: Europe Sky Based Communication Industry Revenue Share (%), by Type 2025 & 2033
- Figure 26: Europe Sky Based Communication Industry Volume Share (%), by Type 2025 & 2033
- Figure 27: Europe Sky Based Communication Industry Revenue (Million), by End User 2025 & 2033
- Figure 28: Europe Sky Based Communication Industry Volume (Billion), by End User 2025 & 2033
- Figure 29: Europe Sky Based Communication Industry Revenue Share (%), by End User 2025 & 2033
- Figure 30: Europe Sky Based Communication Industry Volume Share (%), by End User 2025 & 2033
- Figure 31: Europe Sky Based Communication Industry Revenue (Million), by Country 2025 & 2033
- Figure 32: Europe Sky Based Communication Industry Volume (Billion), by Country 2025 & 2033
- Figure 33: Europe Sky Based Communication Industry Revenue Share (%), by Country 2025 & 2033
- Figure 34: Europe Sky Based Communication Industry Volume Share (%), by Country 2025 & 2033
- Figure 35: Asia Pacific Sky Based Communication Industry Revenue (Million), by Application 2025 & 2033
- Figure 36: Asia Pacific Sky Based Communication Industry Volume (Billion), by Application 2025 & 2033
- Figure 37: Asia Pacific Sky Based Communication Industry Revenue Share (%), by Application 2025 & 2033
- Figure 38: Asia Pacific Sky Based Communication Industry Volume Share (%), by Application 2025 & 2033
- Figure 39: Asia Pacific Sky Based Communication Industry Revenue (Million), by Type 2025 & 2033
- Figure 40: Asia Pacific Sky Based Communication Industry Volume (Billion), by Type 2025 & 2033
- Figure 41: Asia Pacific Sky Based Communication Industry Revenue Share (%), by Type 2025 & 2033
- Figure 42: Asia Pacific Sky Based Communication Industry Volume Share (%), by Type 2025 & 2033
- Figure 43: Asia Pacific Sky Based Communication Industry Revenue (Million), by End User 2025 & 2033
- Figure 44: Asia Pacific Sky Based Communication Industry Volume (Billion), by End User 2025 & 2033
- Figure 45: Asia Pacific Sky Based Communication Industry Revenue Share (%), by End User 2025 & 2033
- Figure 46: Asia Pacific Sky Based Communication Industry Volume Share (%), by End User 2025 & 2033
- Figure 47: Asia Pacific Sky Based Communication Industry Revenue (Million), by Country 2025 & 2033
- Figure 48: Asia Pacific Sky Based Communication Industry Volume (Billion), by Country 2025 & 2033
- Figure 49: Asia Pacific Sky Based Communication Industry Revenue Share (%), by Country 2025 & 2033
- Figure 50: Asia Pacific Sky Based Communication Industry Volume Share (%), by Country 2025 & 2033
- Figure 51: Latin America Sky Based Communication Industry Revenue (Million), by Application 2025 & 2033
- Figure 52: Latin America Sky Based Communication Industry Volume (Billion), by Application 2025 & 2033
- Figure 53: Latin America Sky Based Communication Industry Revenue Share (%), by Application 2025 & 2033
- Figure 54: Latin America Sky Based Communication Industry Volume Share (%), by Application 2025 & 2033
- Figure 55: Latin America Sky Based Communication Industry Revenue (Million), by Type 2025 & 2033
- Figure 56: Latin America Sky Based Communication Industry Volume (Billion), by Type 2025 & 2033
- Figure 57: Latin America Sky Based Communication Industry Revenue Share (%), by Type 2025 & 2033
- Figure 58: Latin America Sky Based Communication Industry Volume Share (%), by Type 2025 & 2033
- Figure 59: Latin America Sky Based Communication Industry Revenue (Million), by End User 2025 & 2033
- Figure 60: Latin America Sky Based Communication Industry Volume (Billion), by End User 2025 & 2033
- Figure 61: Latin America Sky Based Communication Industry Revenue Share (%), by End User 2025 & 2033
- Figure 62: Latin America Sky Based Communication Industry Volume Share (%), by End User 2025 & 2033
- Figure 63: Latin America Sky Based Communication Industry Revenue (Million), by Country 2025 & 2033
- Figure 64: Latin America Sky Based Communication Industry Volume (Billion), by Country 2025 & 2033
- Figure 65: Latin America Sky Based Communication Industry Revenue Share (%), by Country 2025 & 2033
- Figure 66: Latin America Sky Based Communication Industry Volume Share (%), by Country 2025 & 2033
- Figure 67: Middle East and Africa Sky Based Communication Industry Revenue (Million), by Application 2025 & 2033
- Figure 68: Middle East and Africa Sky Based Communication Industry Volume (Billion), by Application 2025 & 2033
- Figure 69: Middle East and Africa Sky Based Communication Industry Revenue Share (%), by Application 2025 & 2033
- Figure 70: Middle East and Africa Sky Based Communication Industry Volume Share (%), by Application 2025 & 2033
- Figure 71: Middle East and Africa Sky Based Communication Industry Revenue (Million), by Type 2025 & 2033
- Figure 72: Middle East and Africa Sky Based Communication Industry Volume (Billion), by Type 2025 & 2033
- Figure 73: Middle East and Africa Sky Based Communication Industry Revenue Share (%), by Type 2025 & 2033
- Figure 74: Middle East and Africa Sky Based Communication Industry Volume Share (%), by Type 2025 & 2033
- Figure 75: Middle East and Africa Sky Based Communication Industry Revenue (Million), by End User 2025 & 2033
- Figure 76: Middle East and Africa Sky Based Communication Industry Volume (Billion), by End User 2025 & 2033
- Figure 77: Middle East and Africa Sky Based Communication Industry Revenue Share (%), by End User 2025 & 2033
- Figure 78: Middle East and Africa Sky Based Communication Industry Volume Share (%), by End User 2025 & 2033
- Figure 79: Middle East and Africa Sky Based Communication Industry Revenue (Million), by Country 2025 & 2033
- Figure 80: Middle East and Africa Sky Based Communication Industry Volume (Billion), by Country 2025 & 2033
- Figure 81: Middle East and Africa Sky Based Communication Industry Revenue Share (%), by Country 2025 & 2033
- Figure 82: Middle East and Africa Sky Based Communication Industry Volume Share (%), by Country 2025 & 2033
List of Tables
- Table 1: Global Sky Based Communication Industry Revenue Million Forecast, by Application 2020 & 2033
- Table 2: Global Sky Based Communication Industry Volume Billion Forecast, by Application 2020 & 2033
- Table 3: Global Sky Based Communication Industry Revenue Million Forecast, by Type 2020 & 2033
- Table 4: Global Sky Based Communication Industry Volume Billion Forecast, by Type 2020 & 2033
- Table 5: Global Sky Based Communication Industry Revenue Million Forecast, by End User 2020 & 2033
- Table 6: Global Sky Based Communication Industry Volume Billion Forecast, by End User 2020 & 2033
- Table 7: Global Sky Based Communication Industry Revenue Million Forecast, by Region 2020 & 2033
- Table 8: Global Sky Based Communication Industry Volume Billion Forecast, by Region 2020 & 2033
- Table 9: Global Sky Based Communication Industry Revenue Million Forecast, by Application 2020 & 2033
- Table 10: Global Sky Based Communication Industry Volume Billion Forecast, by Application 2020 & 2033
- Table 11: Global Sky Based Communication Industry Revenue Million Forecast, by Type 2020 & 2033
- Table 12: Global Sky Based Communication Industry Volume Billion Forecast, by Type 2020 & 2033
- Table 13: Global Sky Based Communication Industry Revenue Million Forecast, by End User 2020 & 2033
- Table 14: Global Sky Based Communication Industry Volume Billion Forecast, by End User 2020 & 2033
- Table 15: Global Sky Based Communication Industry Revenue Million Forecast, by Country 2020 & 2033
- Table 16: Global Sky Based Communication Industry Volume Billion Forecast, by Country 2020 & 2033
- Table 17: United States Sky Based Communication Industry Revenue (Million) Forecast, by Application 2020 & 2033
- Table 18: United States Sky Based Communication Industry Volume (Billion) Forecast, by Application 2020 & 2033
- Table 19: Canada Sky Based Communication Industry Revenue (Million) Forecast, by Application 2020 & 2033
- Table 20: Canada Sky Based Communication Industry Volume (Billion) Forecast, by Application 2020 & 2033
- Table 21: Global Sky Based Communication Industry Revenue Million Forecast, by Application 2020 & 2033
- Table 22: Global Sky Based Communication Industry Volume Billion Forecast, by Application 2020 & 2033
- Table 23: Global Sky Based Communication Industry Revenue Million Forecast, by Type 2020 & 2033
- Table 24: Global Sky Based Communication Industry Volume Billion Forecast, by Type 2020 & 2033
- Table 25: Global Sky Based Communication Industry Revenue Million Forecast, by End User 2020 & 2033
- Table 26: Global Sky Based Communication Industry Volume Billion Forecast, by End User 2020 & 2033
- Table 27: Global Sky Based Communication Industry Revenue Million Forecast, by Country 2020 & 2033
- Table 28: Global Sky Based Communication Industry Volume Billion Forecast, by Country 2020 & 2033
- Table 29: United Kingdom Sky Based Communication Industry Revenue (Million) Forecast, by Application 2020 & 2033
- Table 30: United Kingdom Sky Based Communication Industry Volume (Billion) Forecast, by Application 2020 & 2033
- Table 31: France Sky Based Communication Industry Revenue (Million) Forecast, by Application 2020 & 2033
- Table 32: France Sky Based Communication Industry Volume (Billion) Forecast, by Application 2020 & 2033
- Table 33: Germany Sky Based Communication Industry Revenue (Million) Forecast, by Application 2020 & 2033
- Table 34: Germany Sky Based Communication Industry Volume (Billion) Forecast, by Application 2020 & 2033
- Table 35: Russia Sky Based Communication Industry Revenue (Million) Forecast, by Application 2020 & 2033
- Table 36: Russia Sky Based Communication Industry Volume (Billion) Forecast, by Application 2020 & 2033
- Table 37: Rest of Europe Sky Based Communication Industry Revenue (Million) Forecast, by Application 2020 & 2033
- Table 38: Rest of Europe Sky Based Communication Industry Volume (Billion) Forecast, by Application 2020 & 2033
- Table 39: Global Sky Based Communication Industry Revenue Million Forecast, by Application 2020 & 2033
- Table 40: Global Sky Based Communication Industry Volume Billion Forecast, by Application 2020 & 2033
- Table 41: Global Sky Based Communication Industry Revenue Million Forecast, by Type 2020 & 2033
- Table 42: Global Sky Based Communication Industry Volume Billion Forecast, by Type 2020 & 2033
- Table 43: Global Sky Based Communication Industry Revenue Million Forecast, by End User 2020 & 2033
- Table 44: Global Sky Based Communication Industry Volume Billion Forecast, by End User 2020 & 2033
- Table 45: Global Sky Based Communication Industry Revenue Million Forecast, by Country 2020 & 2033
- Table 46: Global Sky Based Communication Industry Volume Billion Forecast, by Country 2020 & 2033
- Table 47: India Sky Based Communication Industry Revenue (Million) Forecast, by Application 2020 & 2033
- Table 48: India Sky Based Communication Industry Volume (Billion) Forecast, by Application 2020 & 2033
- Table 49: China Sky Based Communication Industry Revenue (Million) Forecast, by Application 2020 & 2033
- Table 50: China Sky Based Communication Industry Volume (Billion) Forecast, by Application 2020 & 2033
- Table 51: Japan Sky Based Communication Industry Revenue (Million) Forecast, by Application 2020 & 2033
- Table 52: Japan Sky Based Communication Industry Volume (Billion) Forecast, by Application 2020 & 2033
- Table 53: South Korea Sky Based Communication Industry Revenue (Million) Forecast, by Application 2020 & 2033
- Table 54: South Korea Sky Based Communication Industry Volume (Billion) Forecast, by Application 2020 & 2033
- Table 55: Rest of Asia Pacific Sky Based Communication Industry Revenue (Million) Forecast, by Application 2020 & 2033
- Table 56: Rest of Asia Pacific Sky Based Communication Industry Volume (Billion) Forecast, by Application 2020 & 2033
- Table 57: Global Sky Based Communication Industry Revenue Million Forecast, by Application 2020 & 2033
- Table 58: Global Sky Based Communication Industry Volume Billion Forecast, by Application 2020 & 2033
- Table 59: Global Sky Based Communication Industry Revenue Million Forecast, by Type 2020 & 2033
- Table 60: Global Sky Based Communication Industry Volume Billion Forecast, by Type 2020 & 2033
- Table 61: Global Sky Based Communication Industry Revenue Million Forecast, by End User 2020 & 2033
- Table 62: Global Sky Based Communication Industry Volume Billion Forecast, by End User 2020 & 2033
- Table 63: Global Sky Based Communication Industry Revenue Million Forecast, by Country 2020 & 2033
- Table 64: Global Sky Based Communication Industry Volume Billion Forecast, by Country 2020 & 2033
- Table 65: Brazil Sky Based Communication Industry Revenue (Million) Forecast, by Application 2020 & 2033
- Table 66: Brazil Sky Based Communication Industry Volume (Billion) Forecast, by Application 2020 & 2033
- Table 67: Rest of Latin America Sky Based Communication Industry Revenue (Million) Forecast, by Application 2020 & 2033
- Table 68: Rest of Latin America Sky Based Communication Industry Volume (Billion) Forecast, by Application 2020 & 2033
- Table 69: Global Sky Based Communication Industry Revenue Million Forecast, by Application 2020 & 2033
- Table 70: Global Sky Based Communication Industry Volume Billion Forecast, by Application 2020 & 2033
- Table 71: Global Sky Based Communication Industry Revenue Million Forecast, by Type 2020 & 2033
- Table 72: Global Sky Based Communication Industry Volume Billion Forecast, by Type 2020 & 2033
- Table 73: Global Sky Based Communication Industry Revenue Million Forecast, by End User 2020 & 2033
- Table 74: Global Sky Based Communication Industry Volume Billion Forecast, by End User 2020 & 2033
- Table 75: Global Sky Based Communication Industry Revenue Million Forecast, by Country 2020 & 2033
- Table 76: Global Sky Based Communication Industry Volume Billion Forecast, by Country 2020 & 2033
- Table 77: United Arab Emirates Sky Based Communication Industry Revenue (Million) Forecast, by Application 2020 & 2033
- Table 78: United Arab Emirates Sky Based Communication Industry Volume (Billion) Forecast, by Application 2020 & 2033
- Table 79: Saudi Arabia Sky Based Communication Industry Revenue (Million) Forecast, by Application 2020 & 2033
- Table 80: Saudi Arabia Sky Based Communication Industry Volume (Billion) Forecast, by Application 2020 & 2033
- Table 81: Israel Sky Based Communication Industry Revenue (Million) Forecast, by Application 2020 & 2033
- Table 82: Israel Sky Based Communication Industry Volume (Billion) Forecast, by Application 2020 & 2033
- Table 83: Rest of Middle East and Africa Sky Based Communication Industry Revenue (Million) Forecast, by Application 2020 & 2033
- Table 84: Rest of Middle East and Africa Sky Based Communication Industry Volume (Billion) Forecast, by Application 2020 & 2033
Frequently Asked Questions
1. What is the projected Compound Annual Growth Rate (CAGR) of the Sky Based Communication Industry?
The projected CAGR is approximately 25.53%.
2. Which companies are prominent players in the Sky Based Communication Industry?
Key companies in the market include Airbus SE, Cobham Limited, Honeywell International Inc, Intelsat, L3Harris Technologies Inc, Maxar Technologies Inc, THALES, Viasat Inc, Inmarsat Global Limited, Iridium Communications Inc.
3. What are the main segments of the Sky Based Communication Industry?
The market segments include Application, Type, End User.
4. Can you provide details about the market size?
The market size is estimated to be USD 136.81 Million as of 2022.
5. What are some drivers contributing to market growth?
N/A
6. What are the notable trends driving market growth?
The Low Earth Orbit (LEO) Segment is Expected to Dominate the Market During the Forecast Period.
7. Are there any restraints impacting market growth?
N/A
8. Can you provide examples of recent developments in the market?
February 2024: Northrop Grumman awarded Viasat Inc. a contract to bolster the US Air Force Research Laboratory (AFRL) initiative. Under this agreement, Viasat will deploy its ViaSat-3 Satellite Communications Network, facilitating seamless, high-bandwidth satellite internet access for military personnel aboard USAF aircraft and ground vehicles.
9. What pricing options are available for accessing the report?
Pricing options include single-user, multi-user, and enterprise licenses priced at USD 4750, USD 5250, and USD 8750 respectively.
10. Is the market size provided in terms of value or volume?
The market size is provided in terms of value, measured in Million and volume, measured in Billion.
11. Are there any specific market keywords associated with the report?
Yes, the market keyword associated with the report is "Sky Based Communication Industry," which aids in identifying and referencing the specific market segment covered.
12. How do I determine which pricing option suits my needs best?
The pricing options vary based on user requirements and access needs. Individual users may opt for single-user licenses, while businesses requiring broader access may choose multi-user or enterprise licenses for cost-effective access to the report.
13. Are there any additional resources or data provided in the Sky Based Communication Industry report?
While the report offers comprehensive insights, it's advisable to review the specific contents or supplementary materials provided to ascertain if additional resources or data are available.
14. How can I stay updated on further developments or reports in the Sky Based Communication Industry?
To stay informed about further developments, trends, and reports in the Sky Based Communication Industry, consider subscribing to industry newsletters, following relevant companies and organizations, or regularly checking reputable industry news sources and publications.
Methodology
Step 1 - Identification of Relevant Samples Size from Population Database


Step 2 - Approaches for Defining Global Market Size (Value, Volume* & Price*)

Note*: In applicable scenarios
Step 3 - Data Sources
Primary Research
- Web Analytics
- Survey Reports
- Research Institute
- Latest Research Reports
- Opinion Leaders
Secondary Research
- Annual Reports
- White Paper
- Latest Press Release
- Industry Association
- Paid Database
- Investor Presentations

Step 4 - Data Triangulation
Involves using different sources of information in order to increase the validity of a study
These sources are likely to be stakeholders in a program - participants, other researchers, program staff, other community members, and so on.
Then we put all data in single framework & apply various statistical tools to find out the dynamic on the market.
During the analysis stage, feedback from the stakeholder groups would be compared to determine areas of agreement as well as areas of divergence