

Key Insights
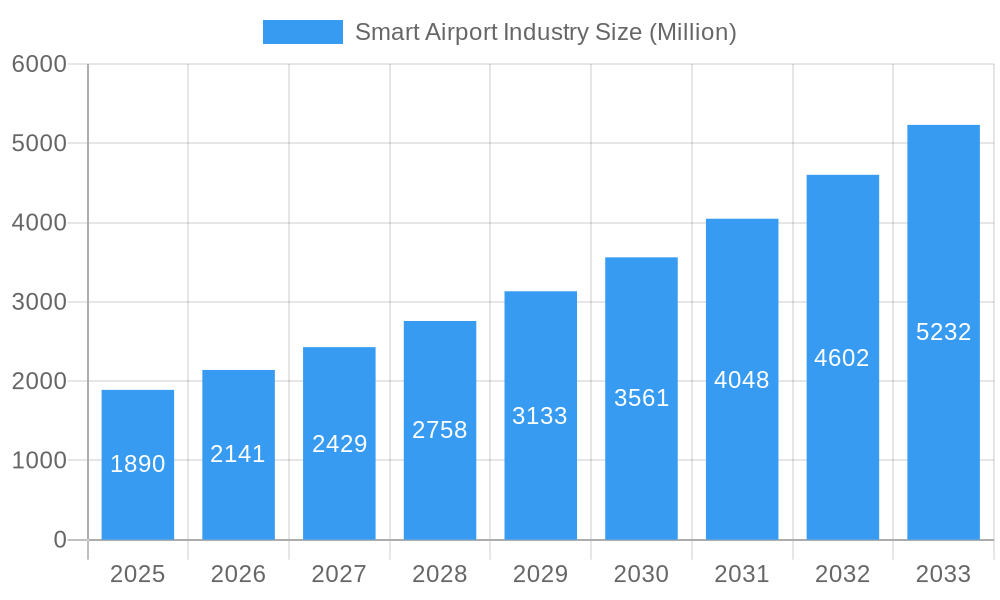
The smart airport market, valued at $1.89 billion in 2025, is experiencing robust growth, projected to expand at a compound annual growth rate (CAGR) of 13.63% from 2025 to 2033. This surge is driven by the increasing need for enhanced operational efficiency, improved passenger experience, and strengthened security measures within airports globally. Key technological advancements in areas such as security systems (biometric screening, intelligent surveillance), communication systems (high-speed internet, real-time data analytics), and air and ground traffic control (ATM modernization, AI-powered predictive maintenance) are significant contributors to this market expansion. Furthermore, the rising adoption of passenger and baggage handling automation, along with the integration of smart technologies across landside, airside, and terminal-side operations, is fueling market growth. The increasing focus on optimizing airport resource allocation and enhancing sustainability initiatives further contributes to this upward trajectory.
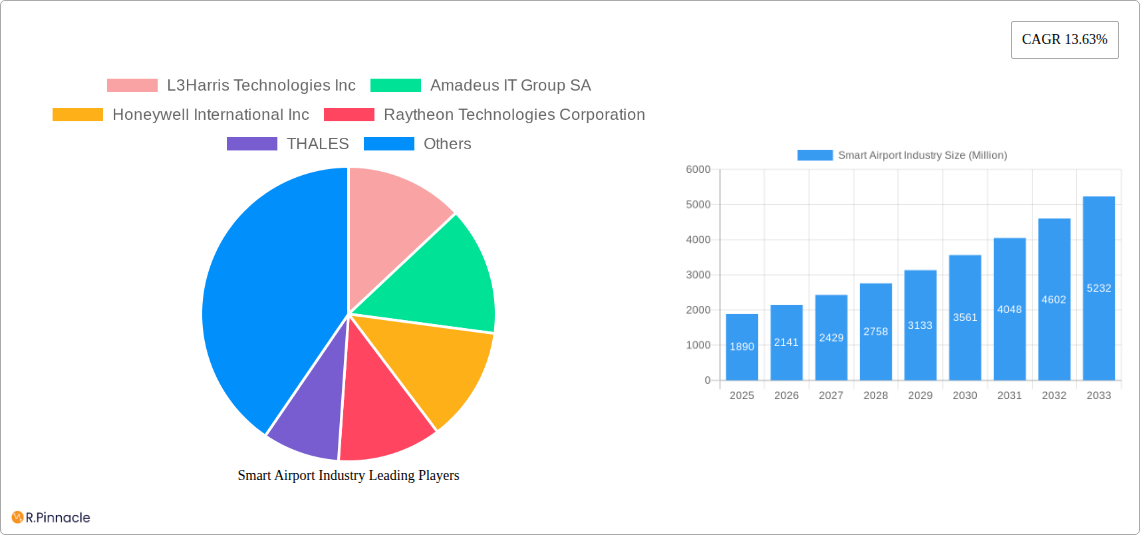
Smart Airport Industry Market Size (In Billion)
Growth is geographically diverse, with North America and Europe currently holding significant market shares due to early adoption of smart technologies and robust infrastructure investments. However, the Asia-Pacific region is poised for substantial growth, driven by rapid infrastructure development and increasing air passenger traffic in countries like China and India. While challenges exist, such as high initial investment costs for implementing smart airport solutions and the need for robust cybersecurity measures, the long-term benefits of improved efficiency, enhanced passenger satisfaction, and reduced operational costs are compelling drivers, ensuring continued market expansion throughout the forecast period. Competition is intense, with major players like L3Harris Technologies, Amadeus IT Group, Honeywell International, and Thales vying for market share, driving innovation and fostering the development of sophisticated and integrated smart airport solutions.
Smart Airport Industry Company Market Share
Smart Airport Industry Market Report: 2019-2033
This comprehensive report provides an in-depth analysis of the Smart Airport Industry, projecting a market value exceeding $XX Million by 2033. Leveraging data from 2019-2024 (Historical Period), with 2025 as the Base and Estimated Year, and forecasting to 2033 (Forecast Period), this report offers actionable insights for industry professionals and investors. Key players such as L3Harris Technologies Inc, Amadeus IT Group SA, Honeywell International Inc, and others are profiled, providing a 360-degree view of this rapidly evolving sector.
Smart Airport Industry Market Structure & Innovation Trends
The Smart Airport market is characterized by a moderately concentrated structure, with several key players holding significant market share. L3Harris Technologies Inc, Amadeus IT Group SA, and Honeywell International Inc are among the leading companies, commanding a combined market share estimated at XX%. Innovation is driven by the need for enhanced security, improved operational efficiency, and enhanced passenger experience. Regulatory frameworks, such as those concerning data privacy and cybersecurity, play a crucial role. Product substitutes are limited, primarily focusing on legacy systems which are gradually being replaced. End-user demographics are predominantly airports and airlines, along with ground handling operators. M&A activity has been significant, with deal values exceeding $XX Million in recent years, driving consolidation and technological advancements.
- Market Share: L3Harris Technologies Inc (XX%), Amadeus IT Group SA (XX%), Honeywell International Inc (XX%), Others (XX%)
- M&A Deal Value (2019-2024): $XX Million
- Key Innovation Drivers: Enhanced Security, Operational Efficiency, Passenger Experience
Smart Airport Industry Market Dynamics & Trends
The Smart Airport market is experiencing robust growth, with a projected Compound Annual Growth Rate (CAGR) of XX% during the forecast period (2025-2033). This growth is fueled by increasing air passenger traffic, rising demand for improved airport security, and the adoption of advanced technologies like AI and IoT. Technological disruptions, such as the integration of 5G networks and the emergence of autonomous ground vehicles, are reshaping the industry landscape. Consumer preferences are shifting towards seamless travel experiences, personalized services, and reduced wait times. Competitive dynamics are intense, with companies investing heavily in R&D and strategic partnerships to gain a competitive edge. Market penetration of smart airport technologies is steadily increasing, with a significant portion of major airports already implementing these solutions, pushing the value to surpass $XX Million in the forecast period.
Dominant Regions & Segments in Smart Airport Industry
The North American region currently holds the largest market share in the Smart Airport industry, driven by substantial investments in airport infrastructure and technological advancements. However, the Asia-Pacific region is projected to experience the fastest growth in the coming years, fueled by rapid economic development and increasing air travel demand.
Dominant Segments:
- By Technology: Security Systems (Largest Market Share due to stringent security regulations and the integration of advanced screening technologies), Communication Systems (significant value due to increasing need for seamless communication).
- By Airport Operation: Airside (due to critical need for air traffic management and ground operations) and Terminal Side (owing to passenger processing optimization needs).
Key Drivers for Dominant Regions:
- North America: Robust investment in airport infrastructure, advanced technology adoption, stringent security regulations.
- Asia-Pacific: Rapid economic growth, increasing air passenger traffic, government initiatives promoting smart city development.
Detailed Dominance Analysis:
North America's dominance stems from early adoption of smart technologies and well-established infrastructure. However, rapid urbanization and rising disposable incomes in the Asia-Pacific region are driving substantial investment in airport modernization, resulting in the fastest growth projection for the region. Europe, while mature, continues to demonstrate significant activity due to stringent security protocols and emphasis on passenger experience improvement.
Smart Airport Industry Product Innovations
Recent product innovations focus on enhancing passenger experience, improving operational efficiency, and strengthening security measures. This includes advanced passenger processing systems, AI-powered baggage handling, and predictive maintenance solutions. The integration of IoT and AI is central to these innovations, enabling real-time data analysis and proactive problem-solving. The market is witnessing a shift towards cloud-based solutions to improve scalability, flexibility, and cost-effectiveness. These solutions often offer competitive advantages in terms of reduced operational costs, improved security, and enhanced passenger satisfaction, directly impacting the market's growth trajectory towards $XX Million.
Report Scope & Segmentation Analysis
This report segments the Smart Airport market by technology (Security Systems, Communication Systems, Air and Ground Traffic Control, Passenger, Cargo & Baggage Ground Handling) and by airport operation (Landside, Airside, Terminal Side). Each segment is analyzed in detail, providing market size, growth projections, and competitive dynamics. Security Systems and Airside operations currently hold the largest market shares, but all segments are poised for significant growth during the forecast period. Growth projections vary by segment, with some experiencing more rapid expansion than others due to factors like technological advancements and regulatory changes.
Growth projections are estimated at $XX Million for the entire market, with individual segment projections available within the full report.
Key Drivers of Smart Airport Industry Growth
Several factors drive the growth of the Smart Airport industry: Firstly, the increasing volume of air passengers globally necessitates efficient airport operations and enhanced passenger experience, which smart technologies address directly. Secondly, stringent security regulations and the rising threat of terrorism are driving demand for advanced security systems. Thirdly, technological advancements, such as AI, IoT, and big data analytics, enable data-driven decision-making and optimize airport operations, generating cost savings and improving performance. Finally, government initiatives and investments in airport infrastructure are stimulating market growth.
Challenges in the Smart Airport Industry Sector
The Smart Airport industry faces various challenges, including the high initial investment costs associated with implementing smart technologies. Integration complexities across different systems and platforms, as well as data security and privacy concerns, pose significant hurdles. Moreover, the need for skilled workforce to manage and maintain the complex systems adds to the challenges. These factors hinder widespread adoption and contribute to slower growth in certain regions or segments, limiting the market's approach to its projected value of $XX Million.
Emerging Opportunities in Smart Airport Industry
The Smart Airport industry presents several emerging opportunities. The rising adoption of biometric technologies for passenger identification and security screening presents a significant opportunity. The growth of Artificial Intelligence (AI) and Machine Learning (ML) applications in predictive maintenance and passenger flow optimization are additional growth areas. The integration of 5G networks for seamless connectivity and improved data transmission speed will revolutionize airport operations, driving further growth. These innovations are set to fuel the market's expansion towards $XX Million, further supported by increasing investments in sustainable and environmentally friendly airport operations.
Leading Players in the Smart Airport Industry Market
- L3Harris Technologies Inc
- Amadeus IT Group SA
- Honeywell International Inc
- Raytheon Technologies Corporation
- THALES
- Sabre GLBL Inc
- IBM Corporation
- Cisco Systems Inc
- Siemens AG
- NATS Holdings Limited
- SITA
- T-Systems International GmbH
Key Developments in Smart Airport Industry
- February 2023: Smiths Detection wins contract to provide security technology to five major New Zealand airports. This highlights the growing demand for advanced security solutions.
- June 2022: Fiumicino Airport implements a new baggage handling system with 100% X-ray baggage control. This showcases advancements in baggage handling efficiency.
- June 2022: SITA partners with Alstef Group to launch Swift Drop, a self-bag drop solution adopted by Mexico City's new airport. This signifies the increasing adoption of self-service technologies for improved passenger experience.
Future Outlook for Smart Airport Industry Market
The future of the Smart Airport industry is bright, driven by continued technological advancements, growing air passenger traffic, and increasing investments in airport infrastructure. Strategic partnerships and collaborations among technology providers and airport operators are expected to accelerate market growth. The integration of sustainable and environmentally friendly technologies will play a crucial role in shaping the industry's future. The market is poised for substantial growth, exceeding $XX Million by 2033, driven by the factors mentioned and continued innovation.
Smart Airport Industry Segmentation
-
1. Technology
- 1.1. Security Systems
- 1.2. Communication Systems
- 1.3. Air and Ground Traffic Control
- 1.4. Passenger, Cargo, and Baggage Ground Handling
-
2. Airport Operation
- 2.1. Landside
- 2.2. Airside
- 2.3. Terminal Side
Smart Airport Industry Segmentation By Geography
-
1. North America
- 1.1. United States
- 1.2. Canada
-
2. Europe
- 2.1. United Kingdom
- 2.2. France
- 2.3. Germany
- 2.4. Italy
- 2.5. Rest of Europe
-
3. Asia Pacific
- 3.1. China
- 3.2. India
- 3.3. Japan
- 3.4. South Korea
- 3.5. Rest of Asia Pacific
-
4. Latin America
- 4.1. Brazil
- 4.2. Rest of Latin America
-
5. Middle East and Africa
- 5.1. Saudi Arabia
- 5.2. United Arab Emirates
- 5.3. Rest of Middle East and Africa
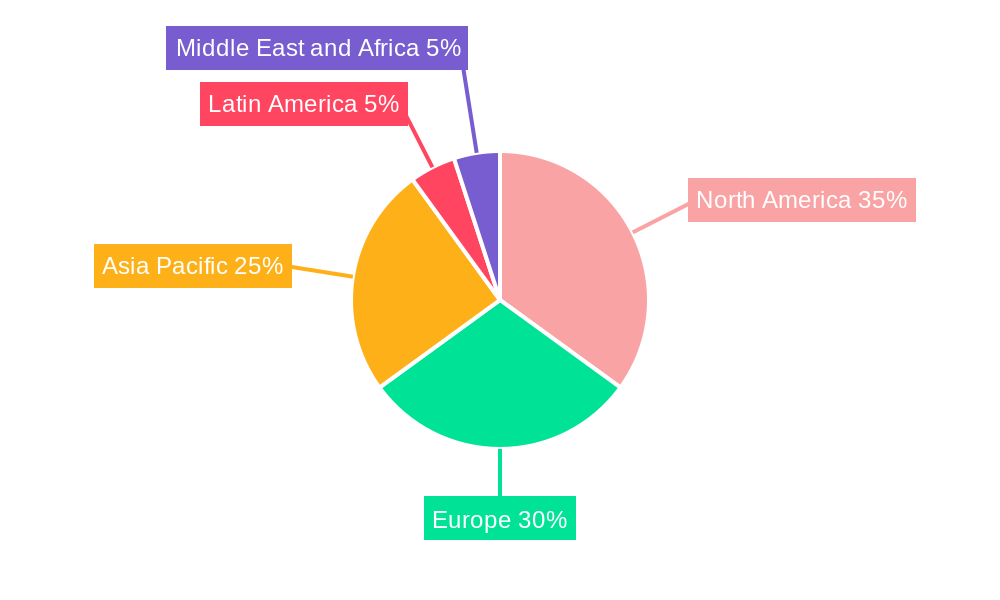
Smart Airport Industry Regional Market Share
Geographic Coverage of Smart Airport Industry
Smart Airport Industry REPORT HIGHLIGHTS
| Aspects | Details |
|---|---|
| Study Period | 2020-2034 |
| Base Year | 2025 |
| Estimated Year | 2026 |
| Forecast Period | 2026-2034 |
| Historical Period | 2020-2025 |
| Growth Rate | CAGR of 13.63% from 2020-2034 |
| Segmentation |
|
Table of Contents
- 1. Introduction
- 1.1. Research Scope
- 1.2. Market Segmentation
- 1.3. Research Objective
- 1.4. Definitions and Assumptions
- 2. Executive Summary
- 2.1. Market Snapshot
- 3. Market Dynamics
- 3.1. Market Drivers
- 3.2. Market Restrains
- 3.3. Market Trends
- 3.4. Market Opportunities
- 4. Market Factor Analysis
- 4.1. Porters Five Forces
- 4.1.1. Bargaining Power of Suppliers
- 4.1.2. Bargaining Power of Buyers
- 4.1.3. Threat of New Entrants
- 4.1.4. Threat of Substitutes
- 4.1.5. Competitive Rivalry
- 4.2. PESTEL analysis
- 4.3. BCG Analysis
- 4.3.1. Stars (High Growth, High Market Share)
- 4.3.2. Cash Cows (Low Growth, High Market Share)
- 4.3.3. Question Mark (High Growth, Low Market Share)
- 4.3.4. Dogs (Low Growth, Low Market Share)
- 4.4. Ansoff Matrix Analysis
- 4.5. Supply Chain Analysis
- 4.6. Regulatory Landscape
- 4.7. Current Market Potential and Opportunity Assessment (TAM–SAM–SOM Framework)
- 4.8. PRI Analyst Note
- 4.1. Porters Five Forces
- 5. Market Analysis, Insights and Forecast 2021-2033
- 5.1. Market Analysis, Insights and Forecast - by Technology
- 5.1.1. Security Systems
- 5.1.2. Communication Systems
- 5.1.3. Air and Ground Traffic Control
- 5.1.4. Passenger, Cargo, and Baggage Ground Handling
- 5.2. Market Analysis, Insights and Forecast - by Airport Operation
- 5.2.1. Landside
- 5.2.2. Airside
- 5.2.3. Terminal Side
- 5.3. Market Analysis, Insights and Forecast - by Region
- 5.3.1. North America
- 5.3.2. Europe
- 5.3.3. Asia Pacific
- 5.3.4. Latin America
- 5.3.5. Middle East and Africa
- 5.1. Market Analysis, Insights and Forecast - by Technology
- 6. Global Smart Airport Industry Analysis, Insights and Forecast, 2021-2033
- 6.1. Market Analysis, Insights and Forecast - by Technology
- 6.1.1. Security Systems
- 6.1.2. Communication Systems
- 6.1.3. Air and Ground Traffic Control
- 6.1.4. Passenger, Cargo, and Baggage Ground Handling
- 6.2. Market Analysis, Insights and Forecast - by Airport Operation
- 6.2.1. Landside
- 6.2.2. Airside
- 6.2.3. Terminal Side
- 6.1. Market Analysis, Insights and Forecast - by Technology
- 7. North America Smart Airport Industry Analysis, Insights and Forecast, 2020-2032
- 7.1. Market Analysis, Insights and Forecast - by Technology
- 7.1.1. Security Systems
- 7.1.2. Communication Systems
- 7.1.3. Air and Ground Traffic Control
- 7.1.4. Passenger, Cargo, and Baggage Ground Handling
- 7.2. Market Analysis, Insights and Forecast - by Airport Operation
- 7.2.1. Landside
- 7.2.2. Airside
- 7.2.3. Terminal Side
- 7.1. Market Analysis, Insights and Forecast - by Technology
- 8. Europe Smart Airport Industry Analysis, Insights and Forecast, 2020-2032
- 8.1. Market Analysis, Insights and Forecast - by Technology
- 8.1.1. Security Systems
- 8.1.2. Communication Systems
- 8.1.3. Air and Ground Traffic Control
- 8.1.4. Passenger, Cargo, and Baggage Ground Handling
- 8.2. Market Analysis, Insights and Forecast - by Airport Operation
- 8.2.1. Landside
- 8.2.2. Airside
- 8.2.3. Terminal Side
- 8.1. Market Analysis, Insights and Forecast - by Technology
- 9. Asia Pacific Smart Airport Industry Analysis, Insights and Forecast, 2020-2032
- 9.1. Market Analysis, Insights and Forecast - by Technology
- 9.1.1. Security Systems
- 9.1.2. Communication Systems
- 9.1.3. Air and Ground Traffic Control
- 9.1.4. Passenger, Cargo, and Baggage Ground Handling
- 9.2. Market Analysis, Insights and Forecast - by Airport Operation
- 9.2.1. Landside
- 9.2.2. Airside
- 9.2.3. Terminal Side
- 9.1. Market Analysis, Insights and Forecast - by Technology
- 10. Latin America Smart Airport Industry Analysis, Insights and Forecast, 2020-2032
- 10.1. Market Analysis, Insights and Forecast - by Technology
- 10.1.1. Security Systems
- 10.1.2. Communication Systems
- 10.1.3. Air and Ground Traffic Control
- 10.1.4. Passenger, Cargo, and Baggage Ground Handling
- 10.2. Market Analysis, Insights and Forecast - by Airport Operation
- 10.2.1. Landside
- 10.2.2. Airside
- 10.2.3. Terminal Side
- 10.1. Market Analysis, Insights and Forecast - by Technology
- 11. Middle East and Africa Smart Airport Industry Analysis, Insights and Forecast, 2020-2032
- 11.1. Market Analysis, Insights and Forecast - by Technology
- 11.1.1. Security Systems
- 11.1.2. Communication Systems
- 11.1.3. Air and Ground Traffic Control
- 11.1.4. Passenger, Cargo, and Baggage Ground Handling
- 11.2. Market Analysis, Insights and Forecast - by Airport Operation
- 11.2.1. Landside
- 11.2.2. Airside
- 11.2.3. Terminal Side
- 11.1. Market Analysis, Insights and Forecast - by Technology
- 12. Competitive Analysis
- 12.1. Company Profiles
- 12.1.1 L3Harris Technologies Inc
- 12.1.1.1. Company Overview
- 12.1.1.2. Products
- 12.1.1.3. Company Financials
- 12.1.1.4. SWOT Analysis
- 12.1.2 Amadeus IT Group SA
- 12.1.2.1. Company Overview
- 12.1.2.2. Products
- 12.1.2.3. Company Financials
- 12.1.2.4. SWOT Analysis
- 12.1.3 Honeywell International Inc
- 12.1.3.1. Company Overview
- 12.1.3.2. Products
- 12.1.3.3. Company Financials
- 12.1.3.4. SWOT Analysis
- 12.1.4 Raytheon Technologies Corporation
- 12.1.4.1. Company Overview
- 12.1.4.2. Products
- 12.1.4.3. Company Financials
- 12.1.4.4. SWOT Analysis
- 12.1.5 THALES
- 12.1.5.1. Company Overview
- 12.1.5.2. Products
- 12.1.5.3. Company Financials
- 12.1.5.4. SWOT Analysis
- 12.1.6 Sabre GLBL Inc
- 12.1.6.1. Company Overview
- 12.1.6.2. Products
- 12.1.6.3. Company Financials
- 12.1.6.4. SWOT Analysis
- 12.1.7 IBM Corporation
- 12.1.7.1. Company Overview
- 12.1.7.2. Products
- 12.1.7.3. Company Financials
- 12.1.7.4. SWOT Analysis
- 12.1.8 Cisco Systems Inc
- 12.1.8.1. Company Overview
- 12.1.8.2. Products
- 12.1.8.3. Company Financials
- 12.1.8.4. SWOT Analysis
- 12.1.9 Siemens AG
- 12.1.9.1. Company Overview
- 12.1.9.2. Products
- 12.1.9.3. Company Financials
- 12.1.9.4. SWOT Analysis
- 12.1.10 NATS Holdings Limited
- 12.1.10.1. Company Overview
- 12.1.10.2. Products
- 12.1.10.3. Company Financials
- 12.1.10.4. SWOT Analysis
- 12.1.11 SITA
- 12.1.11.1. Company Overview
- 12.1.11.2. Products
- 12.1.11.3. Company Financials
- 12.1.11.4. SWOT Analysis
- 12.1.12 T-Systems International GmbH
- 12.1.12.1. Company Overview
- 12.1.12.2. Products
- 12.1.12.3. Company Financials
- 12.1.12.4. SWOT Analysis
- 12.1.1 L3Harris Technologies Inc
- 12.2. Market Entropy
- 12.2.1 Company's Key Areas Served
- 12.2.2 Recent Developments
- 12.3. Company Market Share Analysis 2025
- 12.3.1 Top 5 Companies Market Share Analysis
- 12.3.2 Top 3 Companies Market Share Analysis
- 12.4. List of Potential Customers
- 13. Research Methodology
List of Figures
- Figure 1: Global Smart Airport Industry Revenue Breakdown (Million, %) by Region 2025 & 2033
- Figure 2: North America Smart Airport Industry Revenue (Million), by Technology 2025 & 2033
- Figure 3: North America Smart Airport Industry Revenue Share (%), by Technology 2025 & 2033
- Figure 4: North America Smart Airport Industry Revenue (Million), by Airport Operation 2025 & 2033
- Figure 5: North America Smart Airport Industry Revenue Share (%), by Airport Operation 2025 & 2033
- Figure 6: North America Smart Airport Industry Revenue (Million), by Country 2025 & 2033
- Figure 7: North America Smart Airport Industry Revenue Share (%), by Country 2025 & 2033
- Figure 8: Europe Smart Airport Industry Revenue (Million), by Technology 2025 & 2033
- Figure 9: Europe Smart Airport Industry Revenue Share (%), by Technology 2025 & 2033
- Figure 10: Europe Smart Airport Industry Revenue (Million), by Airport Operation 2025 & 2033
- Figure 11: Europe Smart Airport Industry Revenue Share (%), by Airport Operation 2025 & 2033
- Figure 12: Europe Smart Airport Industry Revenue (Million), by Country 2025 & 2033
- Figure 13: Europe Smart Airport Industry Revenue Share (%), by Country 2025 & 2033
- Figure 14: Asia Pacific Smart Airport Industry Revenue (Million), by Technology 2025 & 2033
- Figure 15: Asia Pacific Smart Airport Industry Revenue Share (%), by Technology 2025 & 2033
- Figure 16: Asia Pacific Smart Airport Industry Revenue (Million), by Airport Operation 2025 & 2033
- Figure 17: Asia Pacific Smart Airport Industry Revenue Share (%), by Airport Operation 2025 & 2033
- Figure 18: Asia Pacific Smart Airport Industry Revenue (Million), by Country 2025 & 2033
- Figure 19: Asia Pacific Smart Airport Industry Revenue Share (%), by Country 2025 & 2033
- Figure 20: Latin America Smart Airport Industry Revenue (Million), by Technology 2025 & 2033
- Figure 21: Latin America Smart Airport Industry Revenue Share (%), by Technology 2025 & 2033
- Figure 22: Latin America Smart Airport Industry Revenue (Million), by Airport Operation 2025 & 2033
- Figure 23: Latin America Smart Airport Industry Revenue Share (%), by Airport Operation 2025 & 2033
- Figure 24: Latin America Smart Airport Industry Revenue (Million), by Country 2025 & 2033
- Figure 25: Latin America Smart Airport Industry Revenue Share (%), by Country 2025 & 2033
- Figure 26: Middle East and Africa Smart Airport Industry Revenue (Million), by Technology 2025 & 2033
- Figure 27: Middle East and Africa Smart Airport Industry Revenue Share (%), by Technology 2025 & 2033
- Figure 28: Middle East and Africa Smart Airport Industry Revenue (Million), by Airport Operation 2025 & 2033
- Figure 29: Middle East and Africa Smart Airport Industry Revenue Share (%), by Airport Operation 2025 & 2033
- Figure 30: Middle East and Africa Smart Airport Industry Revenue (Million), by Country 2025 & 2033
- Figure 31: Middle East and Africa Smart Airport Industry Revenue Share (%), by Country 2025 & 2033
List of Tables
- Table 1: Global Smart Airport Industry Revenue Million Forecast, by Technology 2020 & 2033
- Table 2: Global Smart Airport Industry Revenue Million Forecast, by Airport Operation 2020 & 2033
- Table 3: Global Smart Airport Industry Revenue Million Forecast, by Region 2020 & 2033
- Table 4: Global Smart Airport Industry Revenue Million Forecast, by Technology 2020 & 2033
- Table 5: Global Smart Airport Industry Revenue Million Forecast, by Airport Operation 2020 & 2033
- Table 6: Global Smart Airport Industry Revenue Million Forecast, by Country 2020 & 2033
- Table 7: United States Smart Airport Industry Revenue (Million) Forecast, by Application 2020 & 2033
- Table 8: Canada Smart Airport Industry Revenue (Million) Forecast, by Application 2020 & 2033
- Table 9: Global Smart Airport Industry Revenue Million Forecast, by Technology 2020 & 2033
- Table 10: Global Smart Airport Industry Revenue Million Forecast, by Airport Operation 2020 & 2033
- Table 11: Global Smart Airport Industry Revenue Million Forecast, by Country 2020 & 2033
- Table 12: United Kingdom Smart Airport Industry Revenue (Million) Forecast, by Application 2020 & 2033
- Table 13: France Smart Airport Industry Revenue (Million) Forecast, by Application 2020 & 2033
- Table 14: Germany Smart Airport Industry Revenue (Million) Forecast, by Application 2020 & 2033
- Table 15: Italy Smart Airport Industry Revenue (Million) Forecast, by Application 2020 & 2033
- Table 16: Rest of Europe Smart Airport Industry Revenue (Million) Forecast, by Application 2020 & 2033
- Table 17: Global Smart Airport Industry Revenue Million Forecast, by Technology 2020 & 2033
- Table 18: Global Smart Airport Industry Revenue Million Forecast, by Airport Operation 2020 & 2033
- Table 19: Global Smart Airport Industry Revenue Million Forecast, by Country 2020 & 2033
- Table 20: China Smart Airport Industry Revenue (Million) Forecast, by Application 2020 & 2033
- Table 21: India Smart Airport Industry Revenue (Million) Forecast, by Application 2020 & 2033
- Table 22: Japan Smart Airport Industry Revenue (Million) Forecast, by Application 2020 & 2033
- Table 23: South Korea Smart Airport Industry Revenue (Million) Forecast, by Application 2020 & 2033
- Table 24: Rest of Asia Pacific Smart Airport Industry Revenue (Million) Forecast, by Application 2020 & 2033
- Table 25: Global Smart Airport Industry Revenue Million Forecast, by Technology 2020 & 2033
- Table 26: Global Smart Airport Industry Revenue Million Forecast, by Airport Operation 2020 & 2033
- Table 27: Global Smart Airport Industry Revenue Million Forecast, by Country 2020 & 2033
- Table 28: Brazil Smart Airport Industry Revenue (Million) Forecast, by Application 2020 & 2033
- Table 29: Rest of Latin America Smart Airport Industry Revenue (Million) Forecast, by Application 2020 & 2033
- Table 30: Global Smart Airport Industry Revenue Million Forecast, by Technology 2020 & 2033
- Table 31: Global Smart Airport Industry Revenue Million Forecast, by Airport Operation 2020 & 2033
- Table 32: Global Smart Airport Industry Revenue Million Forecast, by Country 2020 & 2033
- Table 33: Saudi Arabia Smart Airport Industry Revenue (Million) Forecast, by Application 2020 & 2033
- Table 34: United Arab Emirates Smart Airport Industry Revenue (Million) Forecast, by Application 2020 & 2033
- Table 35: Rest of Middle East and Africa Smart Airport Industry Revenue (Million) Forecast, by Application 2020 & 2033
Frequently Asked Questions
1. What is the projected Compound Annual Growth Rate (CAGR) of the Smart Airport Industry?
The projected CAGR is approximately 13.63%.
2. Which companies are prominent players in the Smart Airport Industry?
Key companies in the market include L3Harris Technologies Inc, Amadeus IT Group SA, Honeywell International Inc, Raytheon Technologies Corporation, THALES, Sabre GLBL Inc, IBM Corporation, Cisco Systems Inc, Siemens AG, NATS Holdings Limited, SITA, T-Systems International GmbH.
3. What are the main segments of the Smart Airport Industry?
The market segments include Technology, Airport Operation.
4. Can you provide details about the market size?
The market size is estimated to be USD 1.89 Million as of 2022.
5. What are some drivers contributing to market growth?
N/A
6. What are the notable trends driving market growth?
The Passenger. Cargo & Baggage Ground Handling Segment to Dominate the Market During the Forecasted Period.
7. Are there any restraints impacting market growth?
N/A
8. Can you provide examples of recent developments in the market?
In February 2023, the Aviation Security Service (AvSec) of New Zealand awarded a contract to Smiths Detection, a leader in threat detection and security inspection technologies, to provide cutting-edge checkpoint security technology for its five main international airports: Auckland, Christchurch, Dunedin, Queenstown, and Wellington.
9. What pricing options are available for accessing the report?
Pricing options include single-user, multi-user, and enterprise licenses priced at USD 4750, USD 5250, and USD 8750 respectively.
10. Is the market size provided in terms of value or volume?
The market size is provided in terms of value, measured in Million.
11. Are there any specific market keywords associated with the report?
Yes, the market keyword associated with the report is "Smart Airport Industry," which aids in identifying and referencing the specific market segment covered.
12. How do I determine which pricing option suits my needs best?
The pricing options vary based on user requirements and access needs. Individual users may opt for single-user licenses, while businesses requiring broader access may choose multi-user or enterprise licenses for cost-effective access to the report.
13. Are there any additional resources or data provided in the Smart Airport Industry report?
While the report offers comprehensive insights, it's advisable to review the specific contents or supplementary materials provided to ascertain if additional resources or data are available.
14. How can I stay updated on further developments or reports in the Smart Airport Industry?
To stay informed about further developments, trends, and reports in the Smart Airport Industry, consider subscribing to industry newsletters, following relevant companies and organizations, or regularly checking reputable industry news sources and publications.
Methodology
Step 1 - Identification of Relevant Samples Size from Population Database


Step 2 - Approaches for Defining Global Market Size (Value, Volume* & Price*)

Note*: In applicable scenarios
Step 3 - Data Sources
Primary Research
- Web Analytics
- Survey Reports
- Research Institute
- Latest Research Reports
- Opinion Leaders
Secondary Research
- Annual Reports
- White Paper
- Latest Press Release
- Industry Association
- Paid Database
- Investor Presentations

Step 4 - Data Triangulation
Involves using different sources of information in order to increase the validity of a study
These sources are likely to be stakeholders in a program - participants, other researchers, program staff, other community members, and so on.
Then we put all data in single framework & apply various statistical tools to find out the dynamic on the market.
During the analysis stage, feedback from the stakeholder groups would be compared to determine areas of agreement as well as areas of divergence