

Key Insights
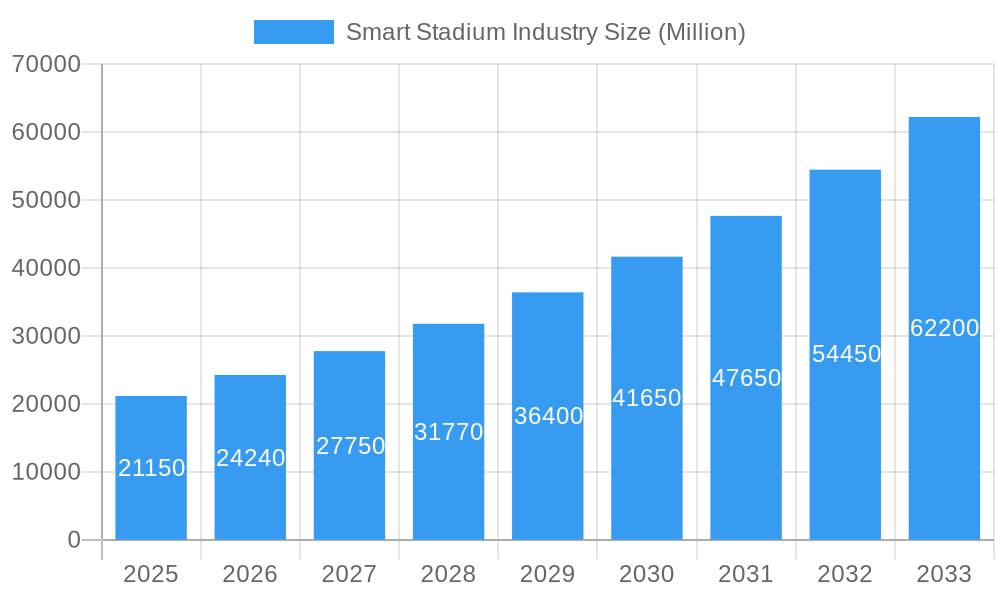
The Smart Stadium Industry is poised for remarkable expansion, with an estimated market size of $21.15 billion in 2025. This growth trajectory is further underscored by a robust CAGR of 14.5%, projecting a substantial increase in market value through 2033. This rapid ascent is fueled by a confluence of transformative drivers, including the escalating demand for enhanced fan experiences through integrated digital technologies like AI-powered analytics, personalized content delivery, and seamless connectivity. The integration of the Internet of Things (IoT) plays a pivotal role, enabling smart ticketing, cashless payments, real-time crowd management, and intelligent building systems that optimize energy consumption and security. Furthermore, the increasing adoption of 5G infrastructure within stadiums is unlocking new possibilities for immersive augmented reality (AR) and virtual reality (VR) applications, creating unparalleled engagement opportunities for spectators. The drive towards sustainable operations, with smart building management systems and efficient resource utilization, also contributes significantly to market growth.
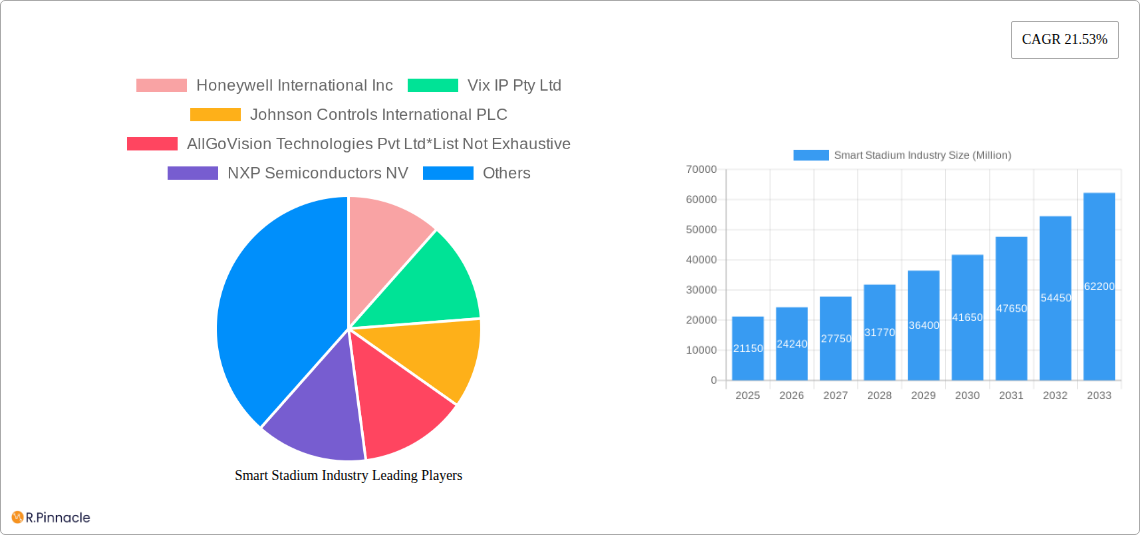
Smart Stadium Industry Market Size (In Billion)
While the industry is on a strong upward trend, certain restraints need careful navigation. The substantial initial investment required for upgrading existing infrastructure to smart capabilities can pose a barrier for some venues. Data security and privacy concerns, particularly with the vast amounts of personal data collected, necessitate robust cybersecurity measures and transparent data handling policies. The need for standardized protocols and interoperability across different smart stadium solutions also presents a challenge, as fragmentation can hinder seamless integration. However, the overwhelming potential for revenue generation through new digital services, enhanced operational efficiencies, and improved attendee satisfaction continues to propel investment and innovation. Key players are actively developing cutting-edge solutions in areas such as advanced connectivity, data analytics, and immersive fan engagement technologies, shaping the future of sports and entertainment venues worldwide. The market's segmented approach, encompassing production, consumption, imports, exports, and price trends, highlights a dynamic ecosystem where technological advancements and evolving consumer expectations are key determinants of future success.
Smart Stadium Industry Company Market Share
Smart Stadium Industry Report: Comprehensive Market Analysis & Future Outlook (2019-2033)
Unlock the potential of the evolving smart stadium landscape with this in-depth industry report. This comprehensive analysis delves into market structure, dynamics, innovations, and future projections for the global smart stadium industry. Covering the historical period from 2019 to 2024, a base year of 2025, and a robust forecast period extending to 2033, this report provides actionable insights for stakeholders seeking to capitalize on this multi-billion dollar market.
Smart Stadium Industry Market Structure & Innovation Trends
The smart stadium industry is characterized by a moderate to high market concentration, with key players investing heavily in technological advancements to gain a competitive edge. Innovation drivers are primarily fueled by the demand for enhanced fan experience, operational efficiency, and robust security systems. Regulatory frameworks, while evolving, are crucial in shaping deployment and data privacy standards. Product substitutes exist, such as traditional stadium upgrades, but the unique value proposition of integrated smart solutions is increasingly dominant. End-user demographics span a wide range, from tech-savvy millennials seeking personalized experiences to older generations valuing enhanced accessibility and safety. Mergers and Acquisitions (M&A) activity is a significant trend, with substantial deal values indicative of strategic consolidation and market expansion. For instance, notable M&A deals in recent years have amounted to over XX billion, signifying a healthy appetite for market share acquisition and technological integration. Market share for leading entities is estimated to be between 15% and 25%, reflecting a competitive yet consolidated ecosystem.
Smart Stadium Industry Market Dynamics & Trends
The smart stadium industry is poised for remarkable growth, driven by a confluence of technological advancements and evolving consumer expectations. The global smart stadium market size is projected to reach over $75 billion by 2033, with a projected Compound Annual Growth Rate (CAGR) of approximately 18.5% during the forecast period (2025-2033). This surge is propelled by the increasing adoption of Internet of Things (IoT) devices, 5G connectivity, Artificial Intelligence (AI), and augmented reality (AR) within stadium infrastructure. These technologies are revolutionizing the fan experience through personalized ticketing, seamless navigation, immersive entertainment, and real-time engagement. Operational efficiencies are also a significant growth catalyst, with smart stadiums leveraging data analytics for optimized energy consumption, crowd management, security surveillance, and maintenance. The competitive landscape is dynamic, with established technology giants and specialized smart solutions providers vying for market dominance. Consumer preferences are shifting towards connected, convenient, and engaging experiences, making smart stadium features a key differentiator for attracting and retaining attendees. Market penetration is steadily increasing as venues recognize the long-term ROI and competitive advantage offered by smart technologies. The integration of cashless payment systems, personalized in-seat ordering, and interactive fan zones are becoming standard expectations, further accelerating market adoption. The ongoing development of AI-powered analytics for real-time decision-making, predictive maintenance, and enhanced safety protocols will continue to shape market trends, creating a more intelligent and responsive stadium environment.
Dominant Regions & Segments in Smart Stadium Industry
The smart stadium industry exhibits distinct regional dominance and segment leadership, driven by a combination of economic policies, infrastructure development, and consumer demand.
Production Analysis:
North America, particularly the United States, is a dominant region in smart stadium technology production, driven by significant investments in sports infrastructure and technological innovation. The production of advanced sensor networks, AI-driven analytics platforms, and high-speed connectivity solutions is concentrated here, supporting a vibrant ecosystem of technology providers.
Consumption Analysis:
Similarly, North America leads in consumption, with a high appetite for cutting-edge fan experiences and operational efficiencies. Major sports leagues and entertainment venues are at the forefront of adopting smart technologies, making this region a key market for smart ticketing, in-stadium mobile applications, and integrated building management systems. The estimated consumption value is expected to exceed $40 billion by 2033.
Import Market Analysis (Value & Volume):
While North America is a major producer, the import market for specialized components and software solutions remains robust globally. Asia-Pacific, especially China and South Korea, plays a significant role in the import of manufacturing components for smart stadium technologies. The global import market value is estimated to reach approximately $15 billion by 2033, with volume driven by the expansion of new smart stadium projects across developing economies.
Export Market Analysis (Value & Volume):
North American and European companies are leading exporters of sophisticated smart stadium solutions, including integrated software platforms, advanced security systems, and AI-powered analytics. The global export market value is projected to be around $20 billion by 2033, with key export destinations being emerging markets undertaking stadium modernization projects.
Price Trend Analysis:
The price trend for smart stadium solutions has been one of gradual decrease for individual components due to economies of scale and technological maturity, while integrated, comprehensive solutions command premium pricing. However, the overall cost of implementing smart stadium technology is expected to become more accessible as adoption grows. For instance, the average cost per smart stadium installation has seen a reduction of approximately 15% over the historical period, with further declines anticipated. This trend makes smart stadium technology more attractive to a wider range of venues.
Smart Stadium Industry Product Innovations
Product innovations in the smart stadium industry are focused on delivering seamless, immersive, and efficient experiences for both fans and operators. Key developments include AI-powered crowd management systems, advanced video analytics for real-time security monitoring, and personalized mobile applications offering integrated ticketing, concessions ordering, and interactive content. The integration of 5G networks enables ultra-low latency for enhanced AR/VR experiences and real-time data streaming. Furthermore, sustainable technology solutions, such as smart energy management systems and advanced waste tracking, are gaining traction. These innovations aim to create connected, intelligent venues that prioritize fan engagement, operational excellence, and environmental responsibility, offering a significant competitive advantage.
Report Scope & Segmentation Analysis
This report meticulously segments the smart stadium industry across critical areas, providing granular insights into market dynamics. The Production Analysis examines the manufacturing hubs and key technologies produced. Consumption Analysis details the demand drivers and geographical uptake of smart stadium solutions. The Import Market Analysis (Value & Volume) quantifies the flow of components and finished products into various regions, highlighting key trading partners and their contributions. Conversely, the Export Market Analysis (Value & Volume) maps the global reach of smart stadium technology providers. Finally, the Price Trend Analysis offers a comprehensive view of cost evolution for smart stadium technologies and services. Each segment is analyzed for growth projections and competitive dynamics, providing a holistic understanding of the market's current state and future trajectory. The estimated market size for specific segments like IoT integration is projected to grow by over 20% annually.
Key Drivers of Smart Stadium Industry Growth
Several pivotal factors are accelerating the growth of the smart stadium industry. Technological advancements, particularly the widespread availability of 5G, AI, and IoT, are foundational, enabling sophisticated functionalities like real-time data analytics, personalized fan engagement, and enhanced security. Increasing demand for superior fan experiences is a critical driver, as venues compete to attract and retain attendees by offering seamless connectivity, interactive content, and personalized services. Operational efficiency and cost reduction are also paramount, with smart stadium solutions optimizing energy consumption, streamlining staff management, and improving maintenance protocols. Furthermore, growing investments in sports and entertainment infrastructure, especially in emerging economies, coupled with favorable government initiatives promoting technological adoption, are creating a fertile ground for market expansion.
Challenges in the Smart Stadium Industry Sector
Despite its immense growth potential, the smart stadium industry faces several significant challenges. High initial investment costs for deploying advanced technologies can be a substantial barrier for some venues, particularly smaller or older facilities. Data privacy and cybersecurity concerns are paramount, requiring robust measures to protect sensitive fan and operational data from breaches. Interoperability issues between different technology systems and platforms can lead to integration complexities and hinder seamless operation. Furthermore, the need for skilled personnel to manage and maintain these sophisticated systems presents a challenge in talent acquisition and development. Regulatory hurdles and evolving standards related to data usage and public safety can also impact deployment timelines and operational strategies, demanding adaptability from industry players.
Emerging Opportunities in Smart Stadium Industry
The smart stadium industry is ripe with emerging opportunities. The burgeoning demand for sustainable and eco-friendly stadium operations presents a significant avenue for growth, with smart technologies playing a crucial role in energy management and waste reduction. The increasing integration of augmented and virtual reality (AR/VR) for immersive fan experiences, from pre-game entertainment to virtual stadium tours, offers immense potential. The development of smart city integration, where stadiums become hubs for data exchange and connectivity within the broader urban ecosystem, opens new revenue streams and service offerings. Furthermore, the focus on personalized fan engagement through data analytics and AI is creating opportunities for highly tailored content, marketing, and in-stadium services, driving loyalty and revenue. The expansion of non-sporting events hosted in smart stadiums, facilitated by flexible and adaptable technology infrastructure, also broadens market reach.
Leading Players in the Smart Stadium Industry Market
- Honeywell International Inc
- Vix IP Pty Ltd
- Johnson Controls International PLC
- AllGoVision Technologies Pvt Ltd
- NXP Semiconductors NV
- IBM Corporation
- CenturyLink Inc
- John Mezzalingua Associates LLC
- Huawei Technologies Co Ltd
- Cisco Systems Inc
- Schneider Electric SE
- Aruba Networks (Hewlett Packard Enterprise)
- Intel Corporation
Key Developments in Smart Stadium Industry Industry
- 2023/08: Cisco Systems Inc. announced a major partnership with a leading stadium in North America to upgrade its Wi-Fi infrastructure, enabling enhanced fan connectivity and data analytics capabilities.
- 2023/06: Huawei Technologies Co Ltd unveiled its latest 5G-powered smart stadium solutions, focusing on ultra-high definition video streaming and real-time AR experiences for attendees.
- 2023/04: Johnson Controls International PLC expanded its smart building solutions portfolio to include advanced integrated security and access control systems tailored for large venues.
- 2023/01: Intel Corporation showcased its AI-powered analytics platform for real-time crowd monitoring and safety management in smart stadiums.
- 2022/12: Aruba Networks (Hewlett Packard Enterprise) secured a contract to provide high-density Wi-Fi 6E solutions for a prominent European sports arena, significantly boosting on-site connectivity.
- 2022/10: Honeywell International Inc. introduced its latest building automation system designed for energy efficiency and optimized operations in large-scale entertainment venues.
Future Outlook for Smart Stadium Industry Market
The future outlook for the smart stadium industry is exceptionally bright, characterized by sustained growth and transformative innovation. Continued advancements in AI, IoT, and 5G will drive the creation of truly intelligent, connected, and immersive venues. The focus will increasingly shift towards hyper-personalization of the fan experience, leveraging data analytics to cater to individual preferences in real-time. Furthermore, the integration of smart stadiums with smart city initiatives will unlock new functionalities and revenue streams. Sustainability will become an even more critical aspect, with smart technologies playing a vital role in creating environmentally conscious venues. Strategic collaborations and technological integration will be key to navigating the evolving landscape, ensuring that smart stadiums remain at the forefront of entertainment, operational efficiency, and community engagement for decades to come.
Smart Stadium Industry Segmentation
- 1. Production Analysis
- 2. Consumption Analysis
- 3. Import Market Analysis (Value & Volume)
- 4. Export Market Analysis (Value & Volume)
- 5. Price Trend Analysis
Smart Stadium Industry Segmentation By Geography
- 1. North America
- 2. Europe
- 3. Asia Pacific
- 4. Rest of the World
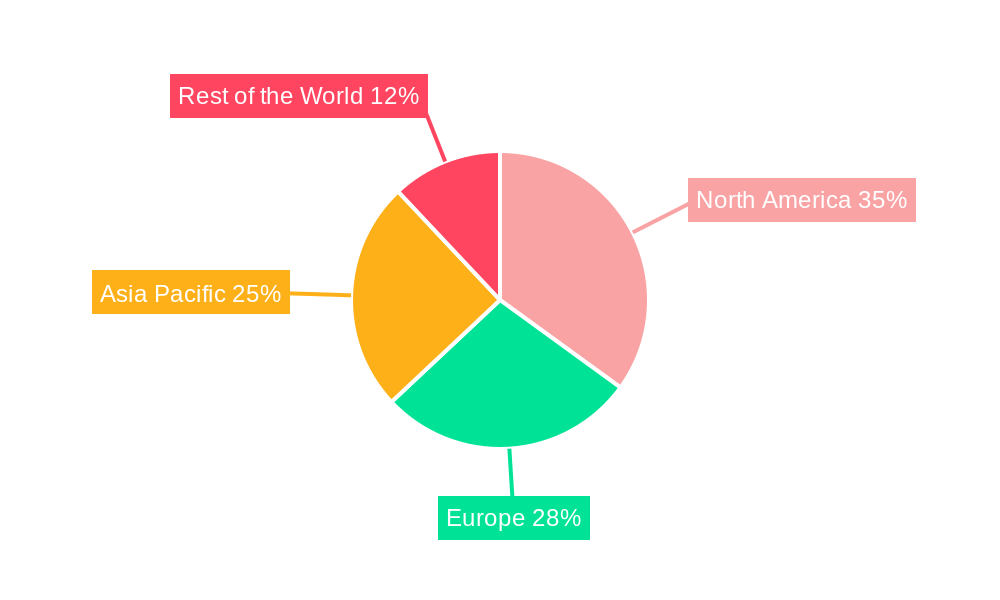
Smart Stadium Industry Regional Market Share
Geographic Coverage of Smart Stadium Industry
Smart Stadium Industry REPORT HIGHLIGHTS
| Aspects | Details |
|---|---|
| Study Period | 2020-2034 |
| Base Year | 2025 |
| Estimated Year | 2026 |
| Forecast Period | 2026-2034 |
| Historical Period | 2020-2025 |
| Growth Rate | CAGR of 22.5% from 2020-2034 |
| Segmentation |
|
Table of Contents
- 1. Introduction
- 1.1. Research Scope
- 1.2. Market Segmentation
- 1.3. Research Objective
- 1.4. Definitions and Assumptions
- 2. Executive Summary
- 2.1. Market Snapshot
- 3. Market Dynamics
- 3.1. Market Drivers
- 3.2. Market Restrains
- 3.3. Market Trends
- 3.4. Market Opportunities
- 4. Market Factor Analysis
- 4.1. Porters Five Forces
- 4.1.1. Bargaining Power of Suppliers
- 4.1.2. Bargaining Power of Buyers
- 4.1.3. Threat of New Entrants
- 4.1.4. Threat of Substitutes
- 4.1.5. Competitive Rivalry
- 4.2. PESTEL analysis
- 4.3. BCG Analysis
- 4.3.1. Stars (High Growth, High Market Share)
- 4.3.2. Cash Cows (Low Growth, High Market Share)
- 4.3.3. Question Mark (High Growth, Low Market Share)
- 4.3.4. Dogs (Low Growth, Low Market Share)
- 4.4. Ansoff Matrix Analysis
- 4.5. Supply Chain Analysis
- 4.6. Regulatory Landscape
- 4.7. Current Market Potential and Opportunity Assessment (TAM–SAM–SOM Framework)
- 4.8. PRI Analyst Note
- 4.1. Porters Five Forces
- 5. Market Analysis, Insights and Forecast 2021-2033
- 5.1. Market Analysis, Insights and Forecast - by Production Analysis
- 5.2. Market Analysis, Insights and Forecast - by Consumption Analysis
- 5.3. Market Analysis, Insights and Forecast - by Import Market Analysis (Value & Volume)
- 5.4. Market Analysis, Insights and Forecast - by Export Market Analysis (Value & Volume)
- 5.5. Market Analysis, Insights and Forecast - by Price Trend Analysis
- 5.6. Market Analysis, Insights and Forecast - by Region
- 5.6.1. North America
- 5.6.2. Europe
- 5.6.3. Asia Pacific
- 5.6.4. Rest of the World
- 6. Global Smart Stadium Industry Analysis, Insights and Forecast, 2021-2033
- 6.1. Market Analysis, Insights and Forecast - by Production Analysis
- 6.2. Market Analysis, Insights and Forecast - by Consumption Analysis
- 6.3. Market Analysis, Insights and Forecast - by Import Market Analysis (Value & Volume)
- 6.4. Market Analysis, Insights and Forecast - by Export Market Analysis (Value & Volume)
- 6.5. Market Analysis, Insights and Forecast - by Price Trend Analysis
- 7. North America Smart Stadium Industry Analysis, Insights and Forecast, 2020-2032
- 7.1. Market Analysis, Insights and Forecast - by Production Analysis
- 7.2. Market Analysis, Insights and Forecast - by Consumption Analysis
- 7.3. Market Analysis, Insights and Forecast - by Import Market Analysis (Value & Volume)
- 7.4. Market Analysis, Insights and Forecast - by Export Market Analysis (Value & Volume)
- 7.5. Market Analysis, Insights and Forecast - by Price Trend Analysis
- 8. Europe Smart Stadium Industry Analysis, Insights and Forecast, 2020-2032
- 8.1. Market Analysis, Insights and Forecast - by Production Analysis
- 8.2. Market Analysis, Insights and Forecast - by Consumption Analysis
- 8.3. Market Analysis, Insights and Forecast - by Import Market Analysis (Value & Volume)
- 8.4. Market Analysis, Insights and Forecast - by Export Market Analysis (Value & Volume)
- 8.5. Market Analysis, Insights and Forecast - by Price Trend Analysis
- 9. Asia Pacific Smart Stadium Industry Analysis, Insights and Forecast, 2020-2032
- 9.1. Market Analysis, Insights and Forecast - by Production Analysis
- 9.2. Market Analysis, Insights and Forecast - by Consumption Analysis
- 9.3. Market Analysis, Insights and Forecast - by Import Market Analysis (Value & Volume)
- 9.4. Market Analysis, Insights and Forecast - by Export Market Analysis (Value & Volume)
- 9.5. Market Analysis, Insights and Forecast - by Price Trend Analysis
- 10. Rest of the World Smart Stadium Industry Analysis, Insights and Forecast, 2020-2032
- 10.1. Market Analysis, Insights and Forecast - by Production Analysis
- 10.2. Market Analysis, Insights and Forecast - by Consumption Analysis
- 10.3. Market Analysis, Insights and Forecast - by Import Market Analysis (Value & Volume)
- 10.4. Market Analysis, Insights and Forecast - by Export Market Analysis (Value & Volume)
- 10.5. Market Analysis, Insights and Forecast - by Price Trend Analysis
- 11. Competitive Analysis
- 11.1. Company Profiles
- 11.1.1 Honeywell International Inc
- 11.1.1.1. Company Overview
- 11.1.1.2. Products
- 11.1.1.3. Company Financials
- 11.1.1.4. SWOT Analysis
- 11.1.2 Vix IP Pty Ltd
- 11.1.2.1. Company Overview
- 11.1.2.2. Products
- 11.1.2.3. Company Financials
- 11.1.2.4. SWOT Analysis
- 11.1.3 Johnson Controls International PLC
- 11.1.3.1. Company Overview
- 11.1.3.2. Products
- 11.1.3.3. Company Financials
- 11.1.3.4. SWOT Analysis
- 11.1.4 AllGoVision Technologies Pvt Ltd*List Not Exhaustive
- 11.1.4.1. Company Overview
- 11.1.4.2. Products
- 11.1.4.3. Company Financials
- 11.1.4.4. SWOT Analysis
- 11.1.5 NXP Semiconductors NV
- 11.1.5.1. Company Overview
- 11.1.5.2. Products
- 11.1.5.3. Company Financials
- 11.1.5.4. SWOT Analysis
- 11.1.6 IBM Corporation
- 11.1.6.1. Company Overview
- 11.1.6.2. Products
- 11.1.6.3. Company Financials
- 11.1.6.4. SWOT Analysis
- 11.1.7 CenturyLink Inc
- 11.1.7.1. Company Overview
- 11.1.7.2. Products
- 11.1.7.3. Company Financials
- 11.1.7.4. SWOT Analysis
- 11.1.8 John Mezzalingua Associates LLC
- 11.1.8.1. Company Overview
- 11.1.8.2. Products
- 11.1.8.3. Company Financials
- 11.1.8.4. SWOT Analysis
- 11.1.9 Huawei Technologies Co Ltd
- 11.1.9.1. Company Overview
- 11.1.9.2. Products
- 11.1.9.3. Company Financials
- 11.1.9.4. SWOT Analysis
- 11.1.10 Cisco Systems Inc
- 11.1.10.1. Company Overview
- 11.1.10.2. Products
- 11.1.10.3. Company Financials
- 11.1.10.4. SWOT Analysis
- 11.1.11 Schneider Electric SE
- 11.1.11.1. Company Overview
- 11.1.11.2. Products
- 11.1.11.3. Company Financials
- 11.1.11.4. SWOT Analysis
- 11.1.12 Aruba Networks (Hewlett Packard Enterprise)
- 11.1.12.1. Company Overview
- 11.1.12.2. Products
- 11.1.12.3. Company Financials
- 11.1.12.4. SWOT Analysis
- 11.1.13 Intel Corporation
- 11.1.13.1. Company Overview
- 11.1.13.2. Products
- 11.1.13.3. Company Financials
- 11.1.13.4. SWOT Analysis
- 11.1.1 Honeywell International Inc
- 11.2. Market Entropy
- 11.2.1 Company's Key Areas Served
- 11.2.2 Recent Developments
- 11.3. Company Market Share Analysis 2025
- 11.3.1 Top 5 Companies Market Share Analysis
- 11.3.2 Top 3 Companies Market Share Analysis
- 11.4. List of Potential Customers
- 12. Research Methodology
List of Figures
- Figure 1: Global Smart Stadium Industry Revenue Breakdown (billion, %) by Region 2025 & 2033
- Figure 2: North America Smart Stadium Industry Revenue (billion), by Production Analysis 2025 & 2033
- Figure 3: North America Smart Stadium Industry Revenue Share (%), by Production Analysis 2025 & 2033
- Figure 4: North America Smart Stadium Industry Revenue (billion), by Consumption Analysis 2025 & 2033
- Figure 5: North America Smart Stadium Industry Revenue Share (%), by Consumption Analysis 2025 & 2033
- Figure 6: North America Smart Stadium Industry Revenue (billion), by Import Market Analysis (Value & Volume) 2025 & 2033
- Figure 7: North America Smart Stadium Industry Revenue Share (%), by Import Market Analysis (Value & Volume) 2025 & 2033
- Figure 8: North America Smart Stadium Industry Revenue (billion), by Export Market Analysis (Value & Volume) 2025 & 2033
- Figure 9: North America Smart Stadium Industry Revenue Share (%), by Export Market Analysis (Value & Volume) 2025 & 2033
- Figure 10: North America Smart Stadium Industry Revenue (billion), by Price Trend Analysis 2025 & 2033
- Figure 11: North America Smart Stadium Industry Revenue Share (%), by Price Trend Analysis 2025 & 2033
- Figure 12: North America Smart Stadium Industry Revenue (billion), by Country 2025 & 2033
- Figure 13: North America Smart Stadium Industry Revenue Share (%), by Country 2025 & 2033
- Figure 14: Europe Smart Stadium Industry Revenue (billion), by Production Analysis 2025 & 2033
- Figure 15: Europe Smart Stadium Industry Revenue Share (%), by Production Analysis 2025 & 2033
- Figure 16: Europe Smart Stadium Industry Revenue (billion), by Consumption Analysis 2025 & 2033
- Figure 17: Europe Smart Stadium Industry Revenue Share (%), by Consumption Analysis 2025 & 2033
- Figure 18: Europe Smart Stadium Industry Revenue (billion), by Import Market Analysis (Value & Volume) 2025 & 2033
- Figure 19: Europe Smart Stadium Industry Revenue Share (%), by Import Market Analysis (Value & Volume) 2025 & 2033
- Figure 20: Europe Smart Stadium Industry Revenue (billion), by Export Market Analysis (Value & Volume) 2025 & 2033
- Figure 21: Europe Smart Stadium Industry Revenue Share (%), by Export Market Analysis (Value & Volume) 2025 & 2033
- Figure 22: Europe Smart Stadium Industry Revenue (billion), by Price Trend Analysis 2025 & 2033
- Figure 23: Europe Smart Stadium Industry Revenue Share (%), by Price Trend Analysis 2025 & 2033
- Figure 24: Europe Smart Stadium Industry Revenue (billion), by Country 2025 & 2033
- Figure 25: Europe Smart Stadium Industry Revenue Share (%), by Country 2025 & 2033
- Figure 26: Asia Pacific Smart Stadium Industry Revenue (billion), by Production Analysis 2025 & 2033
- Figure 27: Asia Pacific Smart Stadium Industry Revenue Share (%), by Production Analysis 2025 & 2033
- Figure 28: Asia Pacific Smart Stadium Industry Revenue (billion), by Consumption Analysis 2025 & 2033
- Figure 29: Asia Pacific Smart Stadium Industry Revenue Share (%), by Consumption Analysis 2025 & 2033
- Figure 30: Asia Pacific Smart Stadium Industry Revenue (billion), by Import Market Analysis (Value & Volume) 2025 & 2033
- Figure 31: Asia Pacific Smart Stadium Industry Revenue Share (%), by Import Market Analysis (Value & Volume) 2025 & 2033
- Figure 32: Asia Pacific Smart Stadium Industry Revenue (billion), by Export Market Analysis (Value & Volume) 2025 & 2033
- Figure 33: Asia Pacific Smart Stadium Industry Revenue Share (%), by Export Market Analysis (Value & Volume) 2025 & 2033
- Figure 34: Asia Pacific Smart Stadium Industry Revenue (billion), by Price Trend Analysis 2025 & 2033
- Figure 35: Asia Pacific Smart Stadium Industry Revenue Share (%), by Price Trend Analysis 2025 & 2033
- Figure 36: Asia Pacific Smart Stadium Industry Revenue (billion), by Country 2025 & 2033
- Figure 37: Asia Pacific Smart Stadium Industry Revenue Share (%), by Country 2025 & 2033
- Figure 38: Rest of the World Smart Stadium Industry Revenue (billion), by Production Analysis 2025 & 2033
- Figure 39: Rest of the World Smart Stadium Industry Revenue Share (%), by Production Analysis 2025 & 2033
- Figure 40: Rest of the World Smart Stadium Industry Revenue (billion), by Consumption Analysis 2025 & 2033
- Figure 41: Rest of the World Smart Stadium Industry Revenue Share (%), by Consumption Analysis 2025 & 2033
- Figure 42: Rest of the World Smart Stadium Industry Revenue (billion), by Import Market Analysis (Value & Volume) 2025 & 2033
- Figure 43: Rest of the World Smart Stadium Industry Revenue Share (%), by Import Market Analysis (Value & Volume) 2025 & 2033
- Figure 44: Rest of the World Smart Stadium Industry Revenue (billion), by Export Market Analysis (Value & Volume) 2025 & 2033
- Figure 45: Rest of the World Smart Stadium Industry Revenue Share (%), by Export Market Analysis (Value & Volume) 2025 & 2033
- Figure 46: Rest of the World Smart Stadium Industry Revenue (billion), by Price Trend Analysis 2025 & 2033
- Figure 47: Rest of the World Smart Stadium Industry Revenue Share (%), by Price Trend Analysis 2025 & 2033
- Figure 48: Rest of the World Smart Stadium Industry Revenue (billion), by Country 2025 & 2033
- Figure 49: Rest of the World Smart Stadium Industry Revenue Share (%), by Country 2025 & 2033
List of Tables
- Table 1: Global Smart Stadium Industry Revenue billion Forecast, by Production Analysis 2020 & 2033
- Table 2: Global Smart Stadium Industry Revenue billion Forecast, by Consumption Analysis 2020 & 2033
- Table 3: Global Smart Stadium Industry Revenue billion Forecast, by Import Market Analysis (Value & Volume) 2020 & 2033
- Table 4: Global Smart Stadium Industry Revenue billion Forecast, by Export Market Analysis (Value & Volume) 2020 & 2033
- Table 5: Global Smart Stadium Industry Revenue billion Forecast, by Price Trend Analysis 2020 & 2033
- Table 6: Global Smart Stadium Industry Revenue billion Forecast, by Region 2020 & 2033
- Table 7: Global Smart Stadium Industry Revenue billion Forecast, by Production Analysis 2020 & 2033
- Table 8: Global Smart Stadium Industry Revenue billion Forecast, by Consumption Analysis 2020 & 2033
- Table 9: Global Smart Stadium Industry Revenue billion Forecast, by Import Market Analysis (Value & Volume) 2020 & 2033
- Table 10: Global Smart Stadium Industry Revenue billion Forecast, by Export Market Analysis (Value & Volume) 2020 & 2033
- Table 11: Global Smart Stadium Industry Revenue billion Forecast, by Price Trend Analysis 2020 & 2033
- Table 12: Global Smart Stadium Industry Revenue billion Forecast, by Country 2020 & 2033
- Table 13: Global Smart Stadium Industry Revenue billion Forecast, by Production Analysis 2020 & 2033
- Table 14: Global Smart Stadium Industry Revenue billion Forecast, by Consumption Analysis 2020 & 2033
- Table 15: Global Smart Stadium Industry Revenue billion Forecast, by Import Market Analysis (Value & Volume) 2020 & 2033
- Table 16: Global Smart Stadium Industry Revenue billion Forecast, by Export Market Analysis (Value & Volume) 2020 & 2033
- Table 17: Global Smart Stadium Industry Revenue billion Forecast, by Price Trend Analysis 2020 & 2033
- Table 18: Global Smart Stadium Industry Revenue billion Forecast, by Country 2020 & 2033
- Table 19: Global Smart Stadium Industry Revenue billion Forecast, by Production Analysis 2020 & 2033
- Table 20: Global Smart Stadium Industry Revenue billion Forecast, by Consumption Analysis 2020 & 2033
- Table 21: Global Smart Stadium Industry Revenue billion Forecast, by Import Market Analysis (Value & Volume) 2020 & 2033
- Table 22: Global Smart Stadium Industry Revenue billion Forecast, by Export Market Analysis (Value & Volume) 2020 & 2033
- Table 23: Global Smart Stadium Industry Revenue billion Forecast, by Price Trend Analysis 2020 & 2033
- Table 24: Global Smart Stadium Industry Revenue billion Forecast, by Country 2020 & 2033
- Table 25: Global Smart Stadium Industry Revenue billion Forecast, by Production Analysis 2020 & 2033
- Table 26: Global Smart Stadium Industry Revenue billion Forecast, by Consumption Analysis 2020 & 2033
- Table 27: Global Smart Stadium Industry Revenue billion Forecast, by Import Market Analysis (Value & Volume) 2020 & 2033
- Table 28: Global Smart Stadium Industry Revenue billion Forecast, by Export Market Analysis (Value & Volume) 2020 & 2033
- Table 29: Global Smart Stadium Industry Revenue billion Forecast, by Price Trend Analysis 2020 & 2033
- Table 30: Global Smart Stadium Industry Revenue billion Forecast, by Country 2020 & 2033
Frequently Asked Questions
1. What is the projected Compound Annual Growth Rate (CAGR) of the Smart Stadium Industry?
The projected CAGR is approximately 22.5%.
2. Which companies are prominent players in the Smart Stadium Industry?
Key companies in the market include Honeywell International Inc, Vix IP Pty Ltd, Johnson Controls International PLC, AllGoVision Technologies Pvt Ltd*List Not Exhaustive, NXP Semiconductors NV, IBM Corporation, CenturyLink Inc, John Mezzalingua Associates LLC, Huawei Technologies Co Ltd, Cisco Systems Inc, Schneider Electric SE, Aruba Networks (Hewlett Packard Enterprise), Intel Corporation.
3. What are the main segments of the Smart Stadium Industry?
The market segments include Production Analysis, Consumption Analysis, Import Market Analysis (Value & Volume), Export Market Analysis (Value & Volume), Price Trend Analysis.
4. Can you provide details about the market size?
The market size is estimated to be USD 8.78 billion as of 2022.
5. What are some drivers contributing to market growth?
; Growing Number of Sports Events.
6. What are the notable trends driving market growth?
Increasing Number of Sports Events Globally Drive the Smart Stadium Market Growth.
7. Are there any restraints impacting market growth?
; Higher Initial Investments.
8. Can you provide examples of recent developments in the market?
N/A
9. What pricing options are available for accessing the report?
Pricing options include single-user, multi-user, and enterprise licenses priced at USD 4750, USD 5250, and USD 8750 respectively.
10. Is the market size provided in terms of value or volume?
The market size is provided in terms of value, measured in billion.
11. Are there any specific market keywords associated with the report?
Yes, the market keyword associated with the report is "Smart Stadium Industry," which aids in identifying and referencing the specific market segment covered.
12. How do I determine which pricing option suits my needs best?
The pricing options vary based on user requirements and access needs. Individual users may opt for single-user licenses, while businesses requiring broader access may choose multi-user or enterprise licenses for cost-effective access to the report.
13. Are there any additional resources or data provided in the Smart Stadium Industry report?
While the report offers comprehensive insights, it's advisable to review the specific contents or supplementary materials provided to ascertain if additional resources or data are available.
14. How can I stay updated on further developments or reports in the Smart Stadium Industry?
To stay informed about further developments, trends, and reports in the Smart Stadium Industry, consider subscribing to industry newsletters, following relevant companies and organizations, or regularly checking reputable industry news sources and publications.
Methodology
Step 1 - Identification of Relevant Samples Size from Population Database


Step 2 - Approaches for Defining Global Market Size (Value, Volume* & Price*)

Note*: In applicable scenarios
Step 3 - Data Sources
Primary Research
- Web Analytics
- Survey Reports
- Research Institute
- Latest Research Reports
- Opinion Leaders
Secondary Research
- Annual Reports
- White Paper
- Latest Press Release
- Industry Association
- Paid Database
- Investor Presentations

Step 4 - Data Triangulation
Involves using different sources of information in order to increase the validity of a study
These sources are likely to be stakeholders in a program - participants, other researchers, program staff, other community members, and so on.
Then we put all data in single framework & apply various statistical tools to find out the dynamic on the market.
During the analysis stage, feedback from the stakeholder groups would be compared to determine areas of agreement as well as areas of divergence