

Key Insights
The global soft starter market, valued at approximately 2.3 billion in 2025, is projected to expand at a Compound Annual Growth Rate (CAGR) of 5.53% from 2025 to 2033. Key drivers include the accelerating adoption of automation across vital sectors such as mining, food and beverage, energy, and oil and gas. Soft starters enhance operational efficiency by reducing energy consumption, prolonging motor lifespan, and improving process control. Additionally, stringent energy efficiency regulations and the integration of smart technologies are further stimulating market growth. Leading manufacturers are actively investing in R&D to introduce innovative solutions, fostering a competitive and dynamic market landscape.
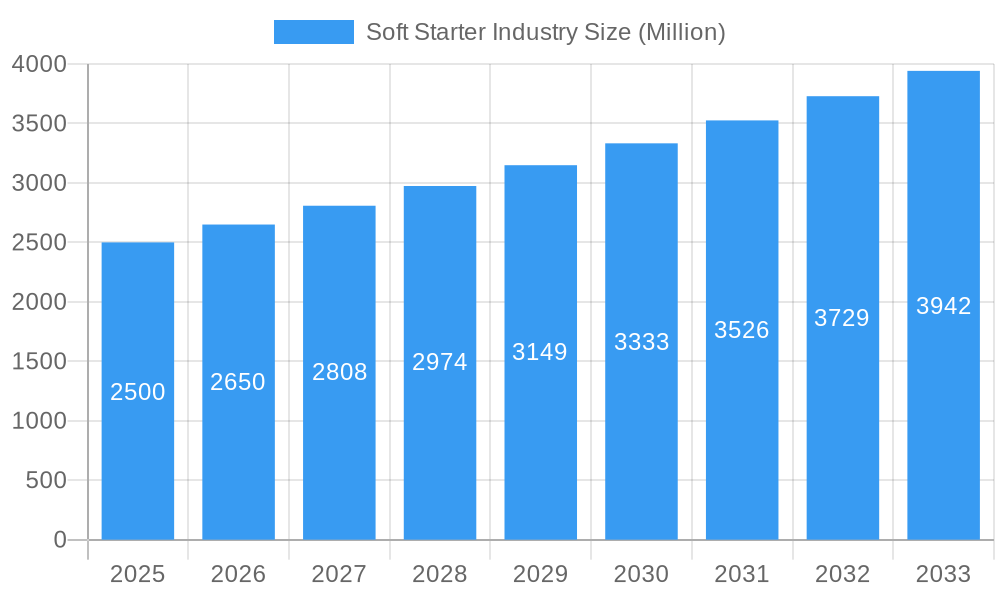
Soft Starter Industry Market Size (In Billion)
Despite positive growth trajectories, potential restraints include the significant initial investment required for soft starter implementation, particularly for small and medium-sized enterprises. Fluctuations in raw material prices and the risk of technological obsolescence present further challenges. Nevertheless, the market's long-term outlook remains robust, propelled by sustained industrial automation expansion, a growing emphasis on sustainability, and continuous technological advancements. The market demonstrates strong performance across key end-user industries, with mining, food and beverage, and energy sectors being dominant. Geographically, North America, Europe, and Asia-Pacific are expected to lead due to established industrial infrastructure and high automation levels, with developing economies poised for increased adoption.
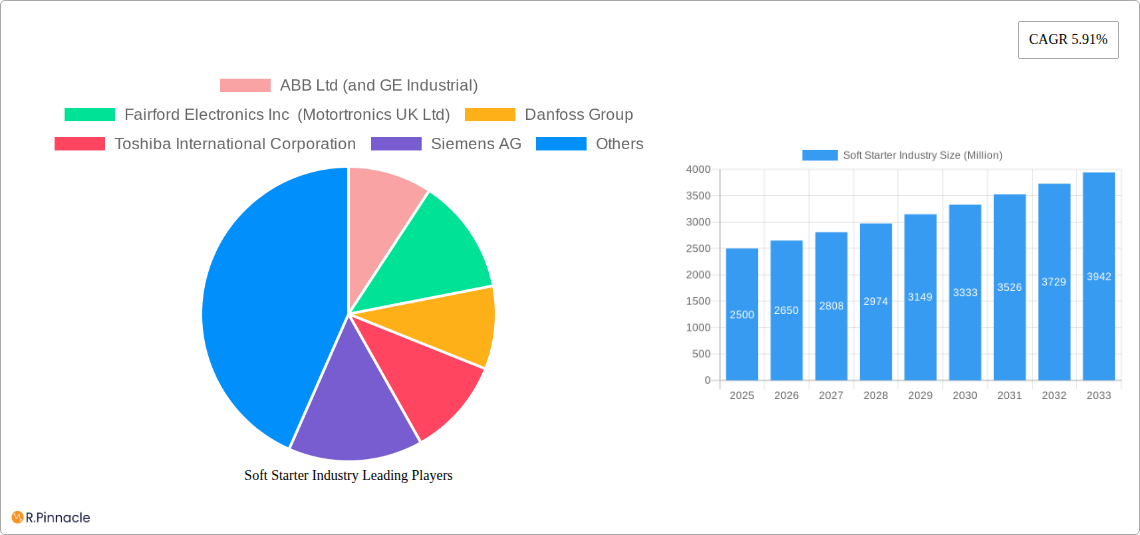
Soft Starter Industry Company Market Share
Soft Starter Market Analysis: Forecast 2025-2033
This report offers a comprehensive analysis of the global soft starter industry, providing critical insights for stakeholders. Covering the period from 2025 to 2033, with 2025 as the base year, this study utilizes extensive data and market intelligence to deliver actionable strategies and growth forecasts. The global soft starter market size is estimated at 2.3 billion in 2025 and is projected to grow at a CAGR of 5.53% from 2025 to 2033.
Soft Starter Industry Market Structure & Innovation Trends
The soft starter market exhibits a moderately concentrated structure, with key players such as ABB Ltd (and GE Industrial), ABB Ltd, GE Industrial, Danfoss Group, Danfoss Group, Toshiba International Corporation, Toshiba International Corporation, Siemens AG, Siemens AG, Schneider Electric SE, Schneider Electric SE, Eaton Corporation PLC, Eaton Corporation PLC, Rockwell Automation Inc, Rockwell Automation Inc, and others holding significant market share. Market share distribution fluctuates based on technological advancements, M&A activities, and regional demand. ABB Ltd and GE Industrial collectively hold an estimated xx% market share in 2025.
- Market Concentration: Moderately concentrated, with top players holding approximately xx% of the market share in 2025.
- Innovation Drivers: Growing demand for energy efficiency, advancements in power electronics, and increasing automation across industries.
- Regulatory Frameworks: Stringent environmental regulations promoting energy-efficient technologies are driving market growth.
- Product Substitutes: Variable frequency drives (VFDs) pose a primary competitive threat, though soft starters maintain advantages in specific applications.
- End-User Demographics: Diverse end-user industries with varying needs and technological adoption rates.
- M&A Activities: The past five years have witnessed xx M&A deals valued at approximately $XX Million, primarily focused on expanding product portfolios and geographical reach. These deals have largely been focused on smaller companies being acquired by larger players.
Soft Starter Industry Market Dynamics & Trends
The soft starter market is experiencing robust growth, fueled by several key factors. Increased industrial automation across sectors like mining, food & beverage, and energy & power are driving demand. Technological advancements, particularly in power electronics and control systems, are enhancing the efficiency and reliability of soft starters. Growing concerns over energy efficiency and the rising adoption of renewable energy sources are further bolstering market growth. Competitive dynamics are characterized by intense rivalry among established players and the emergence of new entrants offering specialized solutions. The market penetration rate in developing economies is expected to increase significantly over the forecast period.
Dominant Regions & Segments in Soft Starter Industry
The Asia-Pacific region is projected to dominate the soft starter market during the forecast period, driven by rapid industrialization, robust infrastructure development, and substantial investments in energy and power sectors. North America and Europe also hold significant market shares. Within end-user industries, the Energy & Power segment accounts for the largest share, followed by the Mining and Metal sector.
- Energy & Power: Strong growth driven by increasing demand for reliable power supply and grid stabilization.
- Mining and Metal: High demand for robust and energy-efficient motor control solutions.
- Food & Beverage: Growing focus on automation and process optimization in food processing plants.
- Oil & Gas: Need for reliable and efficient equipment for pumping and drilling applications.
- Other End-user Industries: Diverse applications across various sectors contribute to a steadily growing segment.
Soft Starter Industry Product Innovations
Recent innovations focus on enhancing energy efficiency, improving control precision, and simplifying installation and maintenance. Compact designs, advanced control algorithms, and integrated communication capabilities are key trends. Soft starters with integrated monitoring and diagnostic features are gaining popularity, enabling predictive maintenance and reducing downtime. The market is also witnessing the emergence of smart soft starters incorporating IoT capabilities for remote monitoring and control.
Report Scope & Segmentation Analysis
This report segments the soft starter market by end-user industry (Mining and Metal, Food & Beverage, Energy & Power, Oil & Gas, Other End-user Industries), product type (low voltage, medium voltage, high voltage), and region. Each segment’s growth trajectory is analyzed individually, providing granular insights into market size, competitive dynamics, and key trends. Growth projections are presented for each segment, offering valuable forecasting data for strategic planning.
Key Drivers of Soft Starter Industry Growth
Key growth drivers include the rising demand for energy-efficient motor control solutions, the increasing adoption of automation technologies in various industries, and the stringent environmental regulations promoting energy conservation. Government initiatives aimed at fostering industrial development, particularly in emerging economies, also contribute significantly to market expansion.
Challenges in the Soft Starter Industry Sector
The soft starter industry faces challenges such as fluctuating raw material prices, supply chain disruptions, and intense competition from established players and new entrants. Furthermore, the industry is constantly evolving, necessitating continuous innovation to maintain a competitive edge. Stringent safety and environmental regulations also pose challenges for manufacturers.
Emerging Opportunities in Soft Starter Industry
Emerging opportunities include the growing demand for smart and connected soft starters, the expansion of applications in renewable energy sectors, and the increasing penetration in developing economies. The development of customized solutions tailored to specific end-user needs and the integration of advanced technologies, such as artificial intelligence and machine learning, present significant growth potential.
Leading Players in the Soft Starter Industry Market
- ABB Ltd (and GE Industrial)
- Fairford Electronics Inc (Motortronics UK Ltd)
- Danfoss Group
- Toshiba International Corporation
- Siemens AG
- Schneider Electric SE
- Eaton Corporation PLC
- AuCom Electronics Ltd
- Rockwell Automation Inc
- IGEL Electric GmbH
- CG Power and Industrial Solutions Ltd
Key Developments in Soft Starter Industry Industry
- 2022: ABB launched a new line of energy-efficient soft starters.
- 2023: Schneider Electric acquired a smaller soft starter manufacturer, expanding its market presence.
- 2024: Several new entrants introduced innovative soft starter solutions incorporating AI capabilities. (Further key developments for 2020-2021 will be included in the final report)
Future Outlook for Soft Starter Industry Market
The future of the soft starter market is bright, driven by ongoing technological advancements, the expanding adoption of automation across industries, and the need for energy-efficient solutions. Strategic partnerships, technological innovations, and focused expansion into emerging markets will be critical success factors for companies operating in this industry.
Soft Starter Industry Segmentation
-
1. End-user Industry
- 1.1. Mining and Metal
- 1.2. Food & Beveerage
- 1.3. Energy & Power
- 1.4. Oil & Gas
- 1.5. Other End-user Industries
Soft Starter Industry Segmentation By Geography
- 1. North America
- 2. Europe
- 3. Asia Pacific
- 4. Latin America
- 5. Middle East and Africa
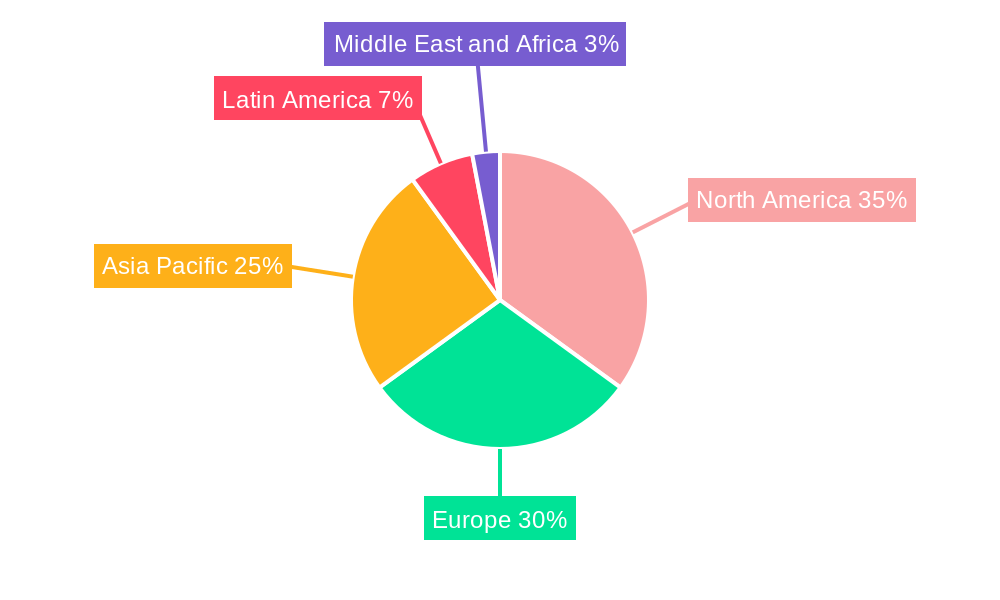
Soft Starter Industry Regional Market Share
Geographic Coverage of Soft Starter Industry
Soft Starter Industry REPORT HIGHLIGHTS
| Aspects | Details |
|---|---|
| Study Period | 2020-2034 |
| Base Year | 2025 |
| Estimated Year | 2026 |
| Forecast Period | 2026-2034 |
| Historical Period | 2020-2025 |
| Growth Rate | CAGR of 5.53% from 2020-2034 |
| Segmentation |
|
Table of Contents
- 1. Introduction
- 1.1. Research Scope
- 1.2. Market Segmentation
- 1.3. Research Objective
- 1.4. Definitions and Assumptions
- 2. Executive Summary
- 2.1. Market Snapshot
- 3. Market Dynamics
- 3.1. Market Drivers
- 3.2. Market Restrains
- 3.3. Market Trends
- 3.4. Market Opportunities
- 4. Market Factor Analysis
- 4.1. Porters Five Forces
- 4.1.1. Bargaining Power of Suppliers
- 4.1.2. Bargaining Power of Buyers
- 4.1.3. Threat of New Entrants
- 4.1.4. Threat of Substitutes
- 4.1.5. Competitive Rivalry
- 4.2. PESTEL analysis
- 4.3. BCG Analysis
- 4.3.1. Stars (High Growth, High Market Share)
- 4.3.2. Cash Cows (Low Growth, High Market Share)
- 4.3.3. Question Mark (High Growth, Low Market Share)
- 4.3.4. Dogs (Low Growth, Low Market Share)
- 4.4. Ansoff Matrix Analysis
- 4.5. Supply Chain Analysis
- 4.6. Regulatory Landscape
- 4.7. Current Market Potential and Opportunity Assessment (TAM–SAM–SOM Framework)
- 4.8. PRI Analyst Note
- 4.1. Porters Five Forces
- 5. Market Analysis, Insights and Forecast 2021-2033
- 5.1. Market Analysis, Insights and Forecast - by End-user Industry
- 5.1.1. Mining and Metal
- 5.1.2. Food & Beveerage
- 5.1.3. Energy & Power
- 5.1.4. Oil & Gas
- 5.1.5. Other End-user Industries
- 5.2. Market Analysis, Insights and Forecast - by Region
- 5.2.1. North America
- 5.2.2. Europe
- 5.2.3. Asia Pacific
- 5.2.4. Latin America
- 5.2.5. Middle East and Africa
- 5.1. Market Analysis, Insights and Forecast - by End-user Industry
- 6. Global Soft Starter Industry Analysis, Insights and Forecast, 2021-2033
- 6.1. Market Analysis, Insights and Forecast - by End-user Industry
- 6.1.1. Mining and Metal
- 6.1.2. Food & Beveerage
- 6.1.3. Energy & Power
- 6.1.4. Oil & Gas
- 6.1.5. Other End-user Industries
- 6.1. Market Analysis, Insights and Forecast - by End-user Industry
- 7. North America Soft Starter Industry Analysis, Insights and Forecast, 2020-2032
- 7.1. Market Analysis, Insights and Forecast - by End-user Industry
- 7.1.1. Mining and Metal
- 7.1.2. Food & Beveerage
- 7.1.3. Energy & Power
- 7.1.4. Oil & Gas
- 7.1.5. Other End-user Industries
- 7.1. Market Analysis, Insights and Forecast - by End-user Industry
- 8. Europe Soft Starter Industry Analysis, Insights and Forecast, 2020-2032
- 8.1. Market Analysis, Insights and Forecast - by End-user Industry
- 8.1.1. Mining and Metal
- 8.1.2. Food & Beveerage
- 8.1.3. Energy & Power
- 8.1.4. Oil & Gas
- 8.1.5. Other End-user Industries
- 8.1. Market Analysis, Insights and Forecast - by End-user Industry
- 9. Asia Pacific Soft Starter Industry Analysis, Insights and Forecast, 2020-2032
- 9.1. Market Analysis, Insights and Forecast - by End-user Industry
- 9.1.1. Mining and Metal
- 9.1.2. Food & Beveerage
- 9.1.3. Energy & Power
- 9.1.4. Oil & Gas
- 9.1.5. Other End-user Industries
- 9.1. Market Analysis, Insights and Forecast - by End-user Industry
- 10. Latin America Soft Starter Industry Analysis, Insights and Forecast, 2020-2032
- 10.1. Market Analysis, Insights and Forecast - by End-user Industry
- 10.1.1. Mining and Metal
- 10.1.2. Food & Beveerage
- 10.1.3. Energy & Power
- 10.1.4. Oil & Gas
- 10.1.5. Other End-user Industries
- 10.1. Market Analysis, Insights and Forecast - by End-user Industry
- 11. Middle East and Africa Soft Starter Industry Analysis, Insights and Forecast, 2020-2032
- 11.1. Market Analysis, Insights and Forecast - by End-user Industry
- 11.1.1. Mining and Metal
- 11.1.2. Food & Beveerage
- 11.1.3. Energy & Power
- 11.1.4. Oil & Gas
- 11.1.5. Other End-user Industries
- 11.1. Market Analysis, Insights and Forecast - by End-user Industry
- 12. Competitive Analysis
- 12.1. Company Profiles
- 12.1.1 ABB Ltd (and GE Industrial)
- 12.1.1.1. Company Overview
- 12.1.1.2. Products
- 12.1.1.3. Company Financials
- 12.1.1.4. SWOT Analysis
- 12.1.2 Fairford Electronics Inc (Motortronics UK Ltd)
- 12.1.2.1. Company Overview
- 12.1.2.2. Products
- 12.1.2.3. Company Financials
- 12.1.2.4. SWOT Analysis
- 12.1.3 Danfoss Group
- 12.1.3.1. Company Overview
- 12.1.3.2. Products
- 12.1.3.3. Company Financials
- 12.1.3.4. SWOT Analysis
- 12.1.4 Toshiba International Corporation
- 12.1.4.1. Company Overview
- 12.1.4.2. Products
- 12.1.4.3. Company Financials
- 12.1.4.4. SWOT Analysis
- 12.1.5 Siemens AG
- 12.1.5.1. Company Overview
- 12.1.5.2. Products
- 12.1.5.3. Company Financials
- 12.1.5.4. SWOT Analysis
- 12.1.6 Schneider Electric SE
- 12.1.6.1. Company Overview
- 12.1.6.2. Products
- 12.1.6.3. Company Financials
- 12.1.6.4. SWOT Analysis
- 12.1.7 Eaton Corporation PLC
- 12.1.7.1. Company Overview
- 12.1.7.2. Products
- 12.1.7.3. Company Financials
- 12.1.7.4. SWOT Analysis
- 12.1.8 AuCom Electronics Ltd*List Not Exhaustive
- 12.1.8.1. Company Overview
- 12.1.8.2. Products
- 12.1.8.3. Company Financials
- 12.1.8.4. SWOT Analysis
- 12.1.9 Rockwell Automation Inc
- 12.1.9.1. Company Overview
- 12.1.9.2. Products
- 12.1.9.3. Company Financials
- 12.1.9.4. SWOT Analysis
- 12.1.10 IGEL Electric GmbH
- 12.1.10.1. Company Overview
- 12.1.10.2. Products
- 12.1.10.3. Company Financials
- 12.1.10.4. SWOT Analysis
- 12.1.11 CG Power and Industrial Solutions Ltd
- 12.1.11.1. Company Overview
- 12.1.11.2. Products
- 12.1.11.3. Company Financials
- 12.1.11.4. SWOT Analysis
- 12.1.1 ABB Ltd (and GE Industrial)
- 12.2. Market Entropy
- 12.2.1 Company's Key Areas Served
- 12.2.2 Recent Developments
- 12.3. Company Market Share Analysis 2025
- 12.3.1 Top 5 Companies Market Share Analysis
- 12.3.2 Top 3 Companies Market Share Analysis
- 12.4. List of Potential Customers
- 13. Research Methodology
List of Figures
- Figure 1: Global Soft Starter Industry Revenue Breakdown (billion, %) by Region 2025 & 2033
- Figure 2: North America Soft Starter Industry Revenue (billion), by End-user Industry 2025 & 2033
- Figure 3: North America Soft Starter Industry Revenue Share (%), by End-user Industry 2025 & 2033
- Figure 4: North America Soft Starter Industry Revenue (billion), by Country 2025 & 2033
- Figure 5: North America Soft Starter Industry Revenue Share (%), by Country 2025 & 2033
- Figure 6: Europe Soft Starter Industry Revenue (billion), by End-user Industry 2025 & 2033
- Figure 7: Europe Soft Starter Industry Revenue Share (%), by End-user Industry 2025 & 2033
- Figure 8: Europe Soft Starter Industry Revenue (billion), by Country 2025 & 2033
- Figure 9: Europe Soft Starter Industry Revenue Share (%), by Country 2025 & 2033
- Figure 10: Asia Pacific Soft Starter Industry Revenue (billion), by End-user Industry 2025 & 2033
- Figure 11: Asia Pacific Soft Starter Industry Revenue Share (%), by End-user Industry 2025 & 2033
- Figure 12: Asia Pacific Soft Starter Industry Revenue (billion), by Country 2025 & 2033
- Figure 13: Asia Pacific Soft Starter Industry Revenue Share (%), by Country 2025 & 2033
- Figure 14: Latin America Soft Starter Industry Revenue (billion), by End-user Industry 2025 & 2033
- Figure 15: Latin America Soft Starter Industry Revenue Share (%), by End-user Industry 2025 & 2033
- Figure 16: Latin America Soft Starter Industry Revenue (billion), by Country 2025 & 2033
- Figure 17: Latin America Soft Starter Industry Revenue Share (%), by Country 2025 & 2033
- Figure 18: Middle East and Africa Soft Starter Industry Revenue (billion), by End-user Industry 2025 & 2033
- Figure 19: Middle East and Africa Soft Starter Industry Revenue Share (%), by End-user Industry 2025 & 2033
- Figure 20: Middle East and Africa Soft Starter Industry Revenue (billion), by Country 2025 & 2033
- Figure 21: Middle East and Africa Soft Starter Industry Revenue Share (%), by Country 2025 & 2033
List of Tables
- Table 1: Global Soft Starter Industry Revenue billion Forecast, by End-user Industry 2020 & 2033
- Table 2: Global Soft Starter Industry Revenue billion Forecast, by Region 2020 & 2033
- Table 3: Global Soft Starter Industry Revenue billion Forecast, by End-user Industry 2020 & 2033
- Table 4: Global Soft Starter Industry Revenue billion Forecast, by Country 2020 & 2033
- Table 5: Global Soft Starter Industry Revenue billion Forecast, by End-user Industry 2020 & 2033
- Table 6: Global Soft Starter Industry Revenue billion Forecast, by Country 2020 & 2033
- Table 7: Global Soft Starter Industry Revenue billion Forecast, by End-user Industry 2020 & 2033
- Table 8: Global Soft Starter Industry Revenue billion Forecast, by Country 2020 & 2033
- Table 9: Global Soft Starter Industry Revenue billion Forecast, by End-user Industry 2020 & 2033
- Table 10: Global Soft Starter Industry Revenue billion Forecast, by Country 2020 & 2033
- Table 11: Global Soft Starter Industry Revenue billion Forecast, by End-user Industry 2020 & 2033
- Table 12: Global Soft Starter Industry Revenue billion Forecast, by Country 2020 & 2033
Frequently Asked Questions
1. What is the projected Compound Annual Growth Rate (CAGR) of the Soft Starter Industry?
The projected CAGR is approximately 5.53%.
2. Which companies are prominent players in the Soft Starter Industry?
Key companies in the market include ABB Ltd (and GE Industrial), Fairford Electronics Inc (Motortronics UK Ltd), Danfoss Group, Toshiba International Corporation, Siemens AG, Schneider Electric SE, Eaton Corporation PLC, AuCom Electronics Ltd*List Not Exhaustive, Rockwell Automation Inc, IGEL Electric GmbH, CG Power and Industrial Solutions Ltd.
3. What are the main segments of the Soft Starter Industry?
The market segments include End-user Industry.
4. Can you provide details about the market size?
The market size is estimated to be USD 2.3 billion as of 2022.
5. What are some drivers contributing to market growth?
Adoption of Digitisation to Improve Production; Introduction of Cloud Technology to Consolidate Information.
6. What are the notable trends driving market growth?
Oil and Gas Industry to Drive the Market Growth.
7. Are there any restraints impacting market growth?
High Investment and Running Costs Involved in Implementation and Upgrade of Manufacturing Execution Systems for Small-Scale Production; Lack of Awareness Regarding Benefits of MES Solutions Among SMEs.
8. Can you provide examples of recent developments in the market?
N/A
9. What pricing options are available for accessing the report?
Pricing options include single-user, multi-user, and enterprise licenses priced at USD 4750, USD 5250, and USD 8750 respectively.
10. Is the market size provided in terms of value or volume?
The market size is provided in terms of value, measured in billion.
11. Are there any specific market keywords associated with the report?
Yes, the market keyword associated with the report is "Soft Starter Industry," which aids in identifying and referencing the specific market segment covered.
12. How do I determine which pricing option suits my needs best?
The pricing options vary based on user requirements and access needs. Individual users may opt for single-user licenses, while businesses requiring broader access may choose multi-user or enterprise licenses for cost-effective access to the report.
13. Are there any additional resources or data provided in the Soft Starter Industry report?
While the report offers comprehensive insights, it's advisable to review the specific contents or supplementary materials provided to ascertain if additional resources or data are available.
14. How can I stay updated on further developments or reports in the Soft Starter Industry?
To stay informed about further developments, trends, and reports in the Soft Starter Industry, consider subscribing to industry newsletters, following relevant companies and organizations, or regularly checking reputable industry news sources and publications.
Methodology
Step 1 - Identification of Relevant Samples Size from Population Database


Step 2 - Approaches for Defining Global Market Size (Value, Volume* & Price*)

Note*: In applicable scenarios
Step 3 - Data Sources
Primary Research
- Web Analytics
- Survey Reports
- Research Institute
- Latest Research Reports
- Opinion Leaders
Secondary Research
- Annual Reports
- White Paper
- Latest Press Release
- Industry Association
- Paid Database
- Investor Presentations

Step 4 - Data Triangulation
Involves using different sources of information in order to increase the validity of a study
These sources are likely to be stakeholders in a program - participants, other researchers, program staff, other community members, and so on.
Then we put all data in single framework & apply various statistical tools to find out the dynamic on the market.
During the analysis stage, feedback from the stakeholder groups would be compared to determine areas of agreement as well as areas of divergence