

Key Insights
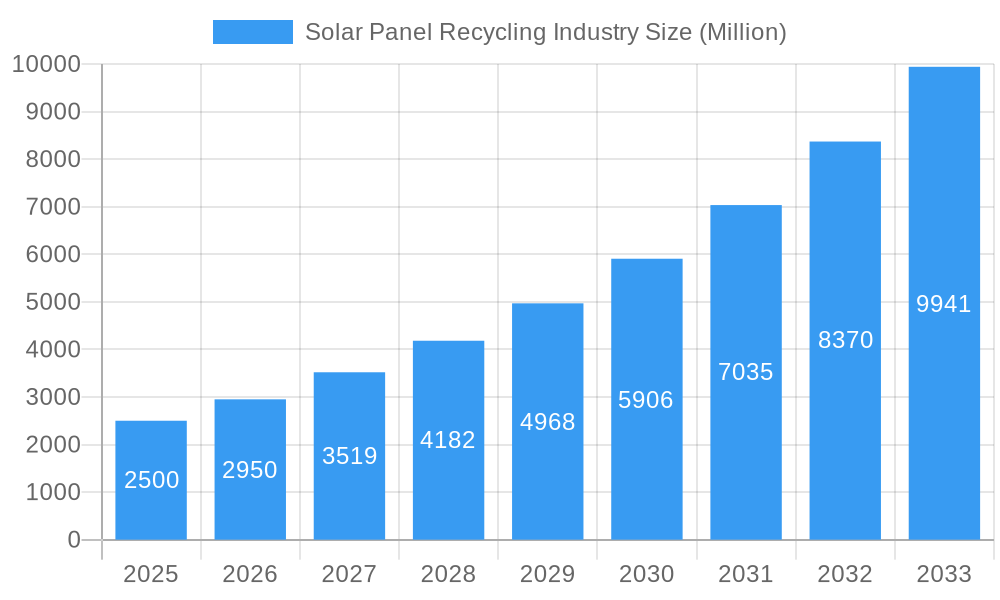
The global solar panel recycling market is experiencing substantial growth, driven by escalating solar installations and increasing environmental consciousness surrounding electronic waste. With an estimated market size of 353.88 million in 2025 and a Compound Annual Growth Rate (CAGR) of approximately 7.5%, the sector is projected for significant expansion through 2033. Key growth factors include stringent e-waste regulations, heightened environmental awareness regarding discarded solar panels, and the economic attractiveness of recovering valuable materials such as silver, silicon, and copper. Advances in recycling technologies, including enhanced thermal, mechanical, and laser-based methods, are also bolstering market expansion. Despite ongoing challenges like the developing recycling infrastructure and the diverse nature of solar panel technologies, the market outlook remains highly positive.
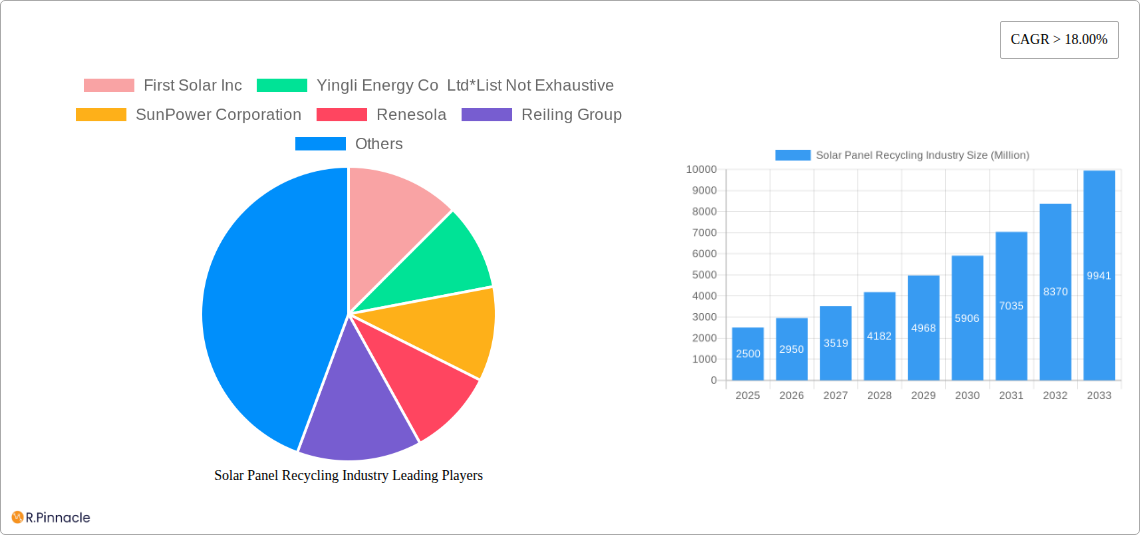
Solar Panel Recycling Industry Market Size (In Million)
Market segmentation reveals varied recycling approaches. Crystalline silicon panels, currently dominating installations, are anticipated to maintain their leading market share. Thin-film technologies present distinct opportunities for specialized recycling solutions. Segmentation by process – thermal, mechanical, and laser – reflects ongoing technological innovation, each offering unique cost-effectiveness and efficiency profiles. Geographically, North America, Europe, and Asia-Pacific are projected to be key growth drivers, attributed to high solar energy adoption rates and established recycling programs. Emerging markets in South America, the Middle East, and Africa are also expected to witness increased participation as solar energy penetration rises and regulatory frameworks mature. Leading companies, including First Solar, Yingli Energy, and SunPower, are spearheading innovation and expanding recycling capabilities to address escalating demand. This dynamic industry is characterized by continuous research and development, leading to improved recycling technologies and higher recovery rates of critical materials.
Solar Panel Recycling Industry Company Market Share
Solar Panel Recycling Industry Report: 2019-2033 Forecast
This comprehensive report provides an in-depth analysis of the solar panel recycling industry, projecting a market valued at $XX Million by 2033. Leveraging data from the historical period (2019-2024), base year (2025), and forecast period (2025-2033), this study offers crucial insights for industry professionals, investors, and stakeholders. Key players like First Solar Inc, Yingli Energy Co Ltd, SunPower Corporation, and others are profiled, offering a granular view of market dynamics and competitive landscapes.
Solar Panel Recycling Industry Market Structure & Innovation Trends
This section analyzes the competitive landscape, identifying key players and their market share. We examine innovation drivers such as advancements in recycling technologies (thermal, mechanical, laser) and the increasing demand for recycled materials. Regulatory frameworks influencing the industry, including policies promoting recycling and waste management, are assessed. The report also explores the impact of mergers and acquisitions (M&A) on market consolidation, analyzing deal values and their implications. Substitute products and their market penetration are also evaluated. End-user demographics and their evolving recycling practices are discussed.
- Market Concentration: The market is moderately concentrated, with a few major players holding significant market share. XX% of the market is controlled by the top 5 players in 2025.
- M&A Activity: The value of M&A deals in the solar panel recycling sector is estimated at $XX Million during 2019-2024, with an expected increase to $XX Million during 2025-2033.
- Innovation Drivers: Advancements in laser-based recycling and improved material recovery rates are driving industry innovation.
Solar Panel Recycling Industry Market Dynamics & Trends
This section delves into the market's growth trajectory, analyzing factors driving expansion and challenges hindering progress. We examine technological disruptions, shifting consumer preferences towards sustainable practices, and the evolving competitive dynamics. The report provides a detailed analysis of the Compound Annual Growth Rate (CAGR) and market penetration for various segments. Specific growth drivers and their impact are explored, along with an analysis of industry challenges and opportunities.
- The global solar panel recycling market is experiencing robust growth, driven by increasing solar panel installations and stringent environmental regulations.
- Technological advancements in recycling technologies contribute significantly to market expansion.
- The rising awareness of environmental sustainability amongst consumers further propels market growth.
Dominant Regions & Segments in Solar Panel Recycling Industry
This section pinpoints the leading geographical regions and segments within the solar panel recycling industry. We analyze dominance based on factors like economic policies, infrastructure development, and technological advancements. The leading segment (e.g., Crystalline Silicon) is evaluated against other segments (Thin Film) based on market size, growth rate and profitability. Process type dominance analysis (Thermal, Mechanical, Laser) is also explored.
- Leading Region: [Specify leading region, e.g., Europe] due to stringent environmental regulations and supportive government initiatives.
- Key Drivers in [Leading Region]:
- Strong governmental support for renewable energy and waste management.
- Well-established recycling infrastructure.
- High concentration of solar panel manufacturers and installers.
- Dominant Segment: Crystalline silicon panels currently dominate the market due to their higher market share and established recycling processes.
Solar Panel Recycling Industry Product Innovations
This section highlights recent product developments, focusing on technological advancements that enhance recycling efficiency and material recovery rates. We discuss the market fit of these innovations and their competitive advantages.
The industry is witnessing significant advancements in automated sorting and material recovery technologies, leading to higher efficiency and reduced costs. Laser-based recycling, in particular, is gaining traction due to its ability to separate valuable materials with high precision. These innovations are improving the overall economic viability of solar panel recycling and increasing the market appeal.
Report Scope & Segmentation Analysis
This report segments the solar panel recycling market based on panel type (Crystalline Silicon, Thin Film) and recycling process (Thermal, Mechanical, Laser). Each segment's growth projection, market size, and competitive dynamics are analyzed.
- Crystalline Silicon: This segment holds the largest market share due to the high volume of crystalline silicon panels installed globally. Growth is projected at XX% CAGR during the forecast period.
- Thin Film: This segment is expected to witness significant growth driven by increasing installations of thin-film solar panels. Market size is projected at $XX Million by 2033.
- Thermal Process: This process is currently dominant due to its established technology and cost-effectiveness.
- Mechanical Process: This process is gaining traction due to advancements in automation and improved material recovery rates.
- Laser Process: This process is emerging as a promising technology for precise material separation and higher value recovery.
Key Drivers of Solar Panel Recycling Industry Growth
Several factors are driving the growth of the solar panel recycling industry. Stringent environmental regulations globally are mandating responsible disposal of end-of-life panels. The increasing scarcity of raw materials and the rising cost of new solar panel production are incentivizing recycling. Furthermore, technological advancements in recycling technologies are improving efficiency and cost-effectiveness.
Challenges in the Solar Panel Recycling Industry Sector
The solar panel recycling industry faces challenges, including inconsistent regulatory frameworks across different regions, leading to variations in recycling standards and costs. Supply chain inefficiencies hinder the efficient collection and processing of end-of-life panels. High recycling costs and the lack of profitability for some recycling processes are also constraints.
Emerging Opportunities in Solar Panel Recycling Industry
The industry presents several opportunities. The development of more efficient and cost-effective recycling technologies, coupled with government incentives and policies, is driving expansion. The increasing demand for recycled materials in new solar panel manufacturing is creating a circular economy and reducing the environmental footprint of the solar energy industry.
Leading Players in the Solar Panel Recycling Industry Market
- First Solar Inc
- Yingli Energy Co Ltd
- SunPower Corporation
- Renesola
- Reiling Group
- Hanwha Group Co Ltd
- Canadian Solar Inc
- Sharp Corporation
- Trina Solar
- JA Solar Co Ltd
- Reclaim PV Recycling Pty Ltd
Key Developments in Solar Panel Recycling Industry
- [Month, Year]: [Company Name] launched a new recycling facility with advanced laser separation technology.
- [Month, Year]: New EU regulations mandated higher recycling rates for solar panels.
- [Month, Year]: [Company Name] and [Company Name] announced a strategic partnership to expand recycling capabilities. (Add more bullet points as needed)
Future Outlook for Solar Panel Recycling Industry Market
The future of the solar panel recycling industry is bright, driven by increasing solar panel installations, stricter environmental regulations, and technological advancements. The focus on a circular economy and the development of more efficient and cost-effective recycling technologies will continue to fuel market expansion. Strategic partnerships and investments in recycling infrastructure will further drive growth. The industry is poised for significant growth in the coming years, with substantial opportunities for both established players and new entrants.
Solar Panel Recycling Industry Segmentation
-
1. Process
- 1.1. Thermal
- 1.2. Mechanical
- 1.3. Laser
-
2. Type
- 2.1. Crystalline Silicon
- 2.2. Thin Film
Solar Panel Recycling Industry Segmentation By Geography
- 1. North America
- 2. Europe
- 3. Asia Pacific
- 4. South America
- 5. Middle East
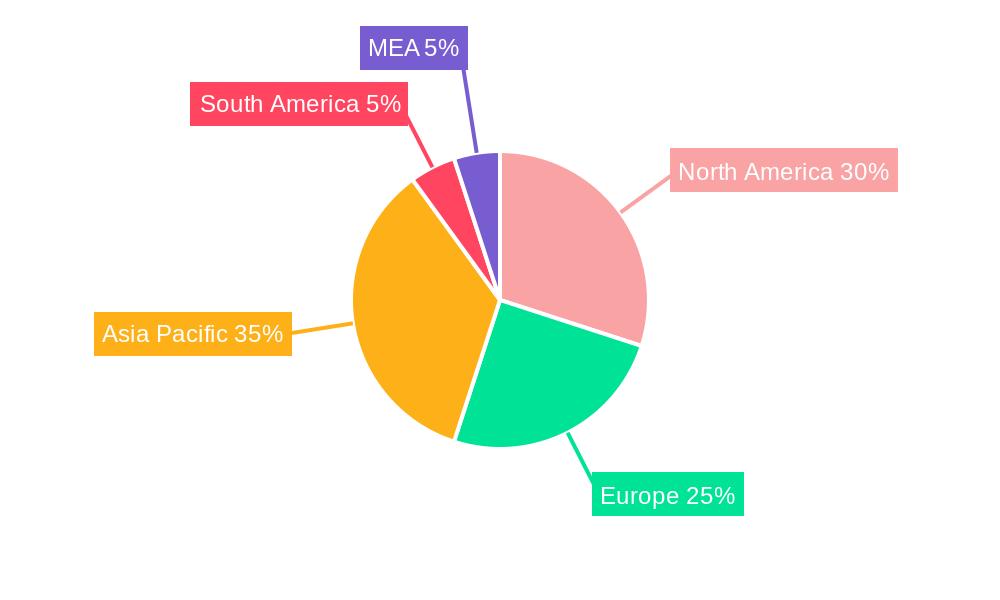
Solar Panel Recycling Industry Regional Market Share
Geographic Coverage of Solar Panel Recycling Industry
Solar Panel Recycling Industry REPORT HIGHLIGHTS
| Aspects | Details |
|---|---|
| Study Period | 2020-2034 |
| Base Year | 2025 |
| Estimated Year | 2026 |
| Forecast Period | 2026-2034 |
| Historical Period | 2020-2025 |
| Growth Rate | CAGR of 7.5% from 2020-2034 |
| Segmentation |
|
Table of Contents
- 1. Introduction
- 1.1. Research Scope
- 1.2. Market Segmentation
- 1.3. Research Objective
- 1.4. Definitions and Assumptions
- 2. Executive Summary
- 2.1. Market Snapshot
- 3. Market Dynamics
- 3.1. Market Drivers
- 3.2. Market Restrains
- 3.3. Market Trends
- 3.4. Market Opportunities
- 4. Market Factor Analysis
- 4.1. Porters Five Forces
- 4.1.1. Bargaining Power of Suppliers
- 4.1.2. Bargaining Power of Buyers
- 4.1.3. Threat of New Entrants
- 4.1.4. Threat of Substitutes
- 4.1.5. Competitive Rivalry
- 4.2. PESTEL analysis
- 4.3. BCG Analysis
- 4.3.1. Stars (High Growth, High Market Share)
- 4.3.2. Cash Cows (Low Growth, High Market Share)
- 4.3.3. Question Mark (High Growth, Low Market Share)
- 4.3.4. Dogs (Low Growth, Low Market Share)
- 4.4. Ansoff Matrix Analysis
- 4.5. Supply Chain Analysis
- 4.6. Regulatory Landscape
- 4.7. Current Market Potential and Opportunity Assessment (TAM–SAM–SOM Framework)
- 4.8. PRI Analyst Note
- 4.1. Porters Five Forces
- 5. Market Analysis, Insights and Forecast 2021-2033
- 5.1. Market Analysis, Insights and Forecast - by Process
- 5.1.1. Thermal
- 5.1.2. Mechanical
- 5.1.3. Laser
- 5.2. Market Analysis, Insights and Forecast - by Type
- 5.2.1. Crystalline Silicon
- 5.2.2. Thin Film
- 5.3. Market Analysis, Insights and Forecast - by Region
- 5.3.1. North America
- 5.3.2. Europe
- 5.3.3. Asia Pacific
- 5.3.4. South America
- 5.3.5. Middle East
- 5.1. Market Analysis, Insights and Forecast - by Process
- 6. Global Solar Panel Recycling Industry Analysis, Insights and Forecast, 2021-2033
- 6.1. Market Analysis, Insights and Forecast - by Process
- 6.1.1. Thermal
- 6.1.2. Mechanical
- 6.1.3. Laser
- 6.2. Market Analysis, Insights and Forecast - by Type
- 6.2.1. Crystalline Silicon
- 6.2.2. Thin Film
- 6.1. Market Analysis, Insights and Forecast - by Process
- 7. North America Solar Panel Recycling Industry Analysis, Insights and Forecast, 2020-2032
- 7.1. Market Analysis, Insights and Forecast - by Process
- 7.1.1. Thermal
- 7.1.2. Mechanical
- 7.1.3. Laser
- 7.2. Market Analysis, Insights and Forecast - by Type
- 7.2.1. Crystalline Silicon
- 7.2.2. Thin Film
- 7.1. Market Analysis, Insights and Forecast - by Process
- 8. Europe Solar Panel Recycling Industry Analysis, Insights and Forecast, 2020-2032
- 8.1. Market Analysis, Insights and Forecast - by Process
- 8.1.1. Thermal
- 8.1.2. Mechanical
- 8.1.3. Laser
- 8.2. Market Analysis, Insights and Forecast - by Type
- 8.2.1. Crystalline Silicon
- 8.2.2. Thin Film
- 8.1. Market Analysis, Insights and Forecast - by Process
- 9. Asia Pacific Solar Panel Recycling Industry Analysis, Insights and Forecast, 2020-2032
- 9.1. Market Analysis, Insights and Forecast - by Process
- 9.1.1. Thermal
- 9.1.2. Mechanical
- 9.1.3. Laser
- 9.2. Market Analysis, Insights and Forecast - by Type
- 9.2.1. Crystalline Silicon
- 9.2.2. Thin Film
- 9.1. Market Analysis, Insights and Forecast - by Process
- 10. South America Solar Panel Recycling Industry Analysis, Insights and Forecast, 2020-2032
- 10.1. Market Analysis, Insights and Forecast - by Process
- 10.1.1. Thermal
- 10.1.2. Mechanical
- 10.1.3. Laser
- 10.2. Market Analysis, Insights and Forecast - by Type
- 10.2.1. Crystalline Silicon
- 10.2.2. Thin Film
- 10.1. Market Analysis, Insights and Forecast - by Process
- 11. Middle East Solar Panel Recycling Industry Analysis, Insights and Forecast, 2020-2032
- 11.1. Market Analysis, Insights and Forecast - by Process
- 11.1.1. Thermal
- 11.1.2. Mechanical
- 11.1.3. Laser
- 11.2. Market Analysis, Insights and Forecast - by Type
- 11.2.1. Crystalline Silicon
- 11.2.2. Thin Film
- 11.1. Market Analysis, Insights and Forecast - by Process
- 12. Competitive Analysis
- 12.1. Company Profiles
- 12.1.1 First Solar Inc
- 12.1.1.1. Company Overview
- 12.1.1.2. Products
- 12.1.1.3. Company Financials
- 12.1.1.4. SWOT Analysis
- 12.1.2 Yingli Energy Co Ltd*List Not Exhaustive
- 12.1.2.1. Company Overview
- 12.1.2.2. Products
- 12.1.2.3. Company Financials
- 12.1.2.4. SWOT Analysis
- 12.1.3 SunPower Corporation
- 12.1.3.1. Company Overview
- 12.1.3.2. Products
- 12.1.3.3. Company Financials
- 12.1.3.4. SWOT Analysis
- 12.1.4 Renesola
- 12.1.4.1. Company Overview
- 12.1.4.2. Products
- 12.1.4.3. Company Financials
- 12.1.4.4. SWOT Analysis
- 12.1.5 Reiling Group
- 12.1.5.1. Company Overview
- 12.1.5.2. Products
- 12.1.5.3. Company Financials
- 12.1.5.4. SWOT Analysis
- 12.1.6 Hanwha Group Co Ltd
- 12.1.6.1. Company Overview
- 12.1.6.2. Products
- 12.1.6.3. Company Financials
- 12.1.6.4. SWOT Analysis
- 12.1.7 Canadian Solar Inc
- 12.1.7.1. Company Overview
- 12.1.7.2. Products
- 12.1.7.3. Company Financials
- 12.1.7.4. SWOT Analysis
- 12.1.8 Sharp Corporation
- 12.1.8.1. Company Overview
- 12.1.8.2. Products
- 12.1.8.3. Company Financials
- 12.1.8.4. SWOT Analysis
- 12.1.9 Trina Solar
- 12.1.9.1. Company Overview
- 12.1.9.2. Products
- 12.1.9.3. Company Financials
- 12.1.9.4. SWOT Analysis
- 12.1.10 JA Solar Co Ltd
- 12.1.10.1. Company Overview
- 12.1.10.2. Products
- 12.1.10.3. Company Financials
- 12.1.10.4. SWOT Analysis
- 12.1.11 Reclaim PV Recycling Pty Ltd
- 12.1.11.1. Company Overview
- 12.1.11.2. Products
- 12.1.11.3. Company Financials
- 12.1.11.4. SWOT Analysis
- 12.1.1 First Solar Inc
- 12.2. Market Entropy
- 12.2.1 Company's Key Areas Served
- 12.2.2 Recent Developments
- 12.3. Company Market Share Analysis 2025
- 12.3.1 Top 5 Companies Market Share Analysis
- 12.3.2 Top 3 Companies Market Share Analysis
- 12.4. List of Potential Customers
- 13. Research Methodology
List of Figures
- Figure 1: Global Solar Panel Recycling Industry Revenue Breakdown (million, %) by Region 2025 & 2033
- Figure 2: North America Solar Panel Recycling Industry Revenue (million), by Process 2025 & 2033
- Figure 3: North America Solar Panel Recycling Industry Revenue Share (%), by Process 2025 & 2033
- Figure 4: North America Solar Panel Recycling Industry Revenue (million), by Type 2025 & 2033
- Figure 5: North America Solar Panel Recycling Industry Revenue Share (%), by Type 2025 & 2033
- Figure 6: North America Solar Panel Recycling Industry Revenue (million), by Country 2025 & 2033
- Figure 7: North America Solar Panel Recycling Industry Revenue Share (%), by Country 2025 & 2033
- Figure 8: Europe Solar Panel Recycling Industry Revenue (million), by Process 2025 & 2033
- Figure 9: Europe Solar Panel Recycling Industry Revenue Share (%), by Process 2025 & 2033
- Figure 10: Europe Solar Panel Recycling Industry Revenue (million), by Type 2025 & 2033
- Figure 11: Europe Solar Panel Recycling Industry Revenue Share (%), by Type 2025 & 2033
- Figure 12: Europe Solar Panel Recycling Industry Revenue (million), by Country 2025 & 2033
- Figure 13: Europe Solar Panel Recycling Industry Revenue Share (%), by Country 2025 & 2033
- Figure 14: Asia Pacific Solar Panel Recycling Industry Revenue (million), by Process 2025 & 2033
- Figure 15: Asia Pacific Solar Panel Recycling Industry Revenue Share (%), by Process 2025 & 2033
- Figure 16: Asia Pacific Solar Panel Recycling Industry Revenue (million), by Type 2025 & 2033
- Figure 17: Asia Pacific Solar Panel Recycling Industry Revenue Share (%), by Type 2025 & 2033
- Figure 18: Asia Pacific Solar Panel Recycling Industry Revenue (million), by Country 2025 & 2033
- Figure 19: Asia Pacific Solar Panel Recycling Industry Revenue Share (%), by Country 2025 & 2033
- Figure 20: South America Solar Panel Recycling Industry Revenue (million), by Process 2025 & 2033
- Figure 21: South America Solar Panel Recycling Industry Revenue Share (%), by Process 2025 & 2033
- Figure 22: South America Solar Panel Recycling Industry Revenue (million), by Type 2025 & 2033
- Figure 23: South America Solar Panel Recycling Industry Revenue Share (%), by Type 2025 & 2033
- Figure 24: South America Solar Panel Recycling Industry Revenue (million), by Country 2025 & 2033
- Figure 25: South America Solar Panel Recycling Industry Revenue Share (%), by Country 2025 & 2033
- Figure 26: Middle East Solar Panel Recycling Industry Revenue (million), by Process 2025 & 2033
- Figure 27: Middle East Solar Panel Recycling Industry Revenue Share (%), by Process 2025 & 2033
- Figure 28: Middle East Solar Panel Recycling Industry Revenue (million), by Type 2025 & 2033
- Figure 29: Middle East Solar Panel Recycling Industry Revenue Share (%), by Type 2025 & 2033
- Figure 30: Middle East Solar Panel Recycling Industry Revenue (million), by Country 2025 & 2033
- Figure 31: Middle East Solar Panel Recycling Industry Revenue Share (%), by Country 2025 & 2033
List of Tables
- Table 1: Global Solar Panel Recycling Industry Revenue million Forecast, by Process 2020 & 2033
- Table 2: Global Solar Panel Recycling Industry Revenue million Forecast, by Type 2020 & 2033
- Table 3: Global Solar Panel Recycling Industry Revenue million Forecast, by Region 2020 & 2033
- Table 4: Global Solar Panel Recycling Industry Revenue million Forecast, by Process 2020 & 2033
- Table 5: Global Solar Panel Recycling Industry Revenue million Forecast, by Type 2020 & 2033
- Table 6: Global Solar Panel Recycling Industry Revenue million Forecast, by Country 2020 & 2033
- Table 7: Global Solar Panel Recycling Industry Revenue million Forecast, by Process 2020 & 2033
- Table 8: Global Solar Panel Recycling Industry Revenue million Forecast, by Type 2020 & 2033
- Table 9: Global Solar Panel Recycling Industry Revenue million Forecast, by Country 2020 & 2033
- Table 10: Global Solar Panel Recycling Industry Revenue million Forecast, by Process 2020 & 2033
- Table 11: Global Solar Panel Recycling Industry Revenue million Forecast, by Type 2020 & 2033
- Table 12: Global Solar Panel Recycling Industry Revenue million Forecast, by Country 2020 & 2033
- Table 13: Global Solar Panel Recycling Industry Revenue million Forecast, by Process 2020 & 2033
- Table 14: Global Solar Panel Recycling Industry Revenue million Forecast, by Type 2020 & 2033
- Table 15: Global Solar Panel Recycling Industry Revenue million Forecast, by Country 2020 & 2033
- Table 16: Global Solar Panel Recycling Industry Revenue million Forecast, by Process 2020 & 2033
- Table 17: Global Solar Panel Recycling Industry Revenue million Forecast, by Type 2020 & 2033
- Table 18: Global Solar Panel Recycling Industry Revenue million Forecast, by Country 2020 & 2033
Frequently Asked Questions
1. What is the projected Compound Annual Growth Rate (CAGR) of the Solar Panel Recycling Industry?
The projected CAGR is approximately 7.5%.
2. Which companies are prominent players in the Solar Panel Recycling Industry?
Key companies in the market include First Solar Inc, Yingli Energy Co Ltd*List Not Exhaustive, SunPower Corporation, Renesola, Reiling Group, Hanwha Group Co Ltd, Canadian Solar Inc, Sharp Corporation, Trina Solar, JA Solar Co Ltd, Reclaim PV Recycling Pty Ltd.
3. What are the main segments of the Solar Panel Recycling Industry?
The market segments include Process, Type.
4. Can you provide details about the market size?
The market size is estimated to be USD 353.88 million as of 2022.
5. What are some drivers contributing to market growth?
4.; Increasing Solar Energy Demand4.; Declining Cost of Solar PV Systems.
6. What are the notable trends driving market growth?
Crystalline Silicon to Dominate the Market.
7. Are there any restraints impacting market growth?
4.; Strong Dependence on Prevailing Weather Condition.
8. Can you provide examples of recent developments in the market?
N/A
9. What pricing options are available for accessing the report?
Pricing options include single-user, multi-user, and enterprise licenses priced at USD 4750, USD 5250, and USD 8750 respectively.
10. Is the market size provided in terms of value or volume?
The market size is provided in terms of value, measured in million.
11. Are there any specific market keywords associated with the report?
Yes, the market keyword associated with the report is "Solar Panel Recycling Industry," which aids in identifying and referencing the specific market segment covered.
12. How do I determine which pricing option suits my needs best?
The pricing options vary based on user requirements and access needs. Individual users may opt for single-user licenses, while businesses requiring broader access may choose multi-user or enterprise licenses for cost-effective access to the report.
13. Are there any additional resources or data provided in the Solar Panel Recycling Industry report?
While the report offers comprehensive insights, it's advisable to review the specific contents or supplementary materials provided to ascertain if additional resources or data are available.
14. How can I stay updated on further developments or reports in the Solar Panel Recycling Industry?
To stay informed about further developments, trends, and reports in the Solar Panel Recycling Industry, consider subscribing to industry newsletters, following relevant companies and organizations, or regularly checking reputable industry news sources and publications.
Methodology
Step 1 - Identification of Relevant Samples Size from Population Database


Step 2 - Approaches for Defining Global Market Size (Value, Volume* & Price*)

Note*: In applicable scenarios
Step 3 - Data Sources
Primary Research
- Web Analytics
- Survey Reports
- Research Institute
- Latest Research Reports
- Opinion Leaders
Secondary Research
- Annual Reports
- White Paper
- Latest Press Release
- Industry Association
- Paid Database
- Investor Presentations

Step 4 - Data Triangulation
Involves using different sources of information in order to increase the validity of a study
These sources are likely to be stakeholders in a program - participants, other researchers, program staff, other community members, and so on.
Then we put all data in single framework & apply various statistical tools to find out the dynamic on the market.
During the analysis stage, feedback from the stakeholder groups would be compared to determine areas of agreement as well as areas of divergence