

Key Insights
The global solar photovoltaic (PV) glass market is poised for substantial expansion, projected to reach $17.09 billion by 2025, with a compound annual growth rate (CAGR) of 31.2%. This growth is primarily driven by the expanding renewable energy sector and the increasing demand for sustainable energy solutions. Key growth catalysts include government incentives such as subsidies and tax credits, declining solar panel costs enhancing cost-competitiveness, and heightened environmental awareness among consumers and businesses. Advancements in glass manufacturing technology, improving PV glass efficiency and durability, also contribute significantly to market expansion. The market is segmented by glass type, with AR-coated, tempered, and TCO-coated glass leading. Crystalline silicon technology remains dominant, though thin-film technologies are gaining traction for their cost-effectiveness and flexible application potential. While the residential sector holds a considerable market share, non-residential applications, including commercial buildings and utility-scale solar farms, are experiencing rapid growth. The Asia Pacific region, particularly China and India, leads market presence due to large-scale solar projects and robust government support. North America and Europe also demonstrate significant contributions, reflecting a global shift towards solar energy adoption. Intense competition among key players, such as Nippon Sheet Glass, Saint-Gobain, and Xinyi Solar, stimulates innovation and competitive pricing strategies.
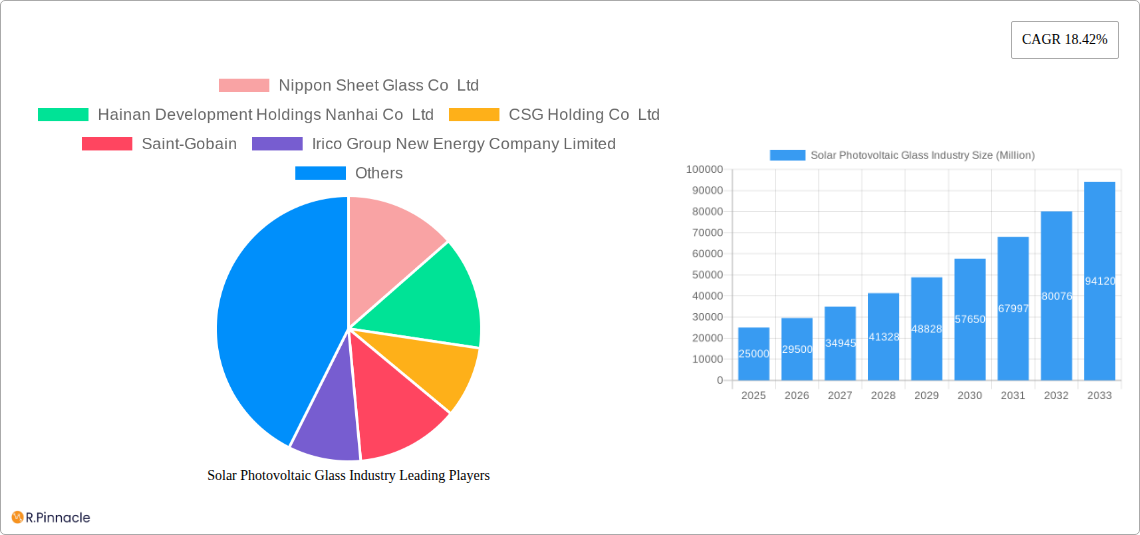
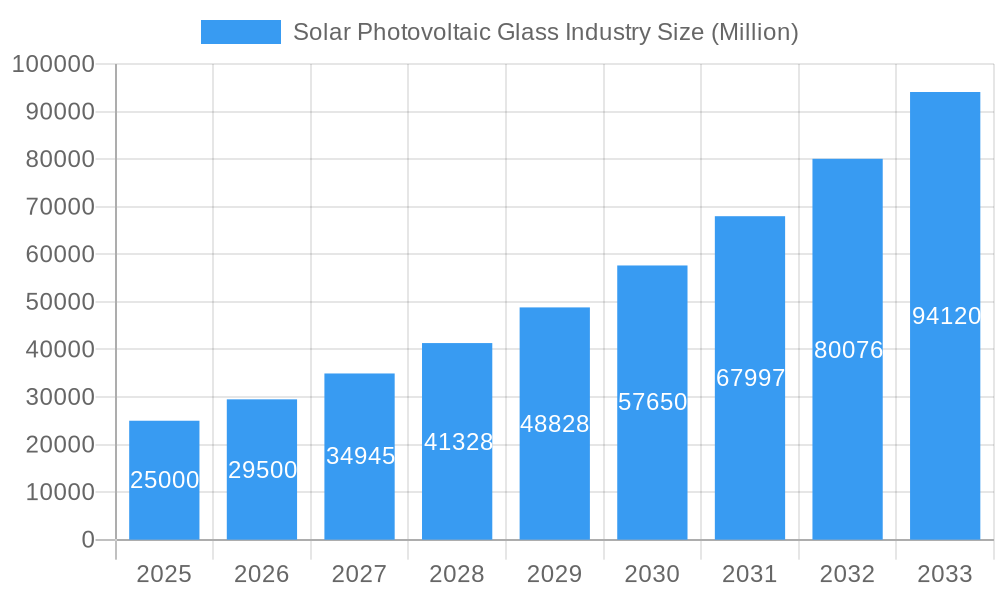
Solar Photovoltaic Glass Industry Market Size (In Billion)
Despite strong growth momentum, the market faces challenges including potential supply chain disruptions for raw materials and rising energy and labor costs impacting manufacturing. Emerging technologies, like perovskite solar cells, may introduce new opportunities and competitive dynamics. Nevertheless, the long-term outlook for the solar PV glass market remains highly positive, supported by global decarbonization efforts and continuous solar energy technology enhancements. Strategic collaborations, mergers, acquisitions, and ongoing technological innovation will be pivotal in shaping the future competitive landscape.
Solar Photovoltaic Glass Industry Company Market Share
Solar Photovoltaic Glass Industry Report: 2019-2033
This comprehensive report provides a detailed analysis of the global solar photovoltaic (PV) glass industry, offering invaluable insights for industry professionals, investors, and researchers. With a focus on market trends, key players, and future growth opportunities, this report covers the period from 2019 to 2033, with a base year of 2025. The report leverages extensive data and analysis to forecast market dynamics and identify key areas for strategic investment. The global market size is projected to reach xx Million by 2033.
Solar Photovoltaic Glass Industry Market Structure & Innovation Trends
This section analyzes the competitive landscape of the solar PV glass industry, encompassing market concentration, innovation drivers, regulatory frameworks, and recent M&A activities. The industry is characterized by a mix of large multinational corporations and smaller specialized players. Market share is distributed amongst key players, with the top five companies holding an estimated xx% of the global market in 2025. However, the market shows signs of consolidation, indicated by recent M&A activities.
- Market Concentration: The market shows moderate concentration, with a few major players dominating.
- Innovation Drivers: Technological advancements in glass coatings (AR, TCO), thin-film technologies, and improved manufacturing processes are driving innovation.
- Regulatory Frameworks: Government incentives and renewable energy targets significantly influence market growth. Stringent environmental regulations are also impacting manufacturing practices.
- Product Substitutes: While limited, alternative materials for PV applications are emerging, although glass remains the dominant choice due to its performance and cost-effectiveness.
- End-User Demographics: The residential, commercial, and utility-scale segments drive demand, with the non-residential segment showing significant growth potential.
- M&A Activities: Recent mergers and acquisitions, such as Borosil Renewables' acquisition of European solar glass manufacturers, illustrate the ongoing consolidation within the industry. Total M&A deal value in 2024 is estimated at xx Million. Several deals exceeding xx Million have been observed.
Solar Photovoltaic Glass Industry Market Dynamics & Trends
This section delves into the market dynamics driving the growth of the solar PV glass industry. The market demonstrates robust growth, fueled by the increasing global demand for renewable energy, supported by favorable government policies. Technological advancements continually improve the efficiency and cost-effectiveness of solar PV glass, further fueling market expansion.
The CAGR (Compound Annual Growth Rate) for the forecast period (2025-2033) is projected to be xx%, driven by:
- Increased adoption of solar energy: Global initiatives to combat climate change are boosting the demand for solar energy, directly impacting PV glass demand.
- Technological advancements: Continuous improvements in efficiency, durability, and cost-effectiveness of solar PV glass are key drivers.
- Government incentives and subsidies: Many governments offer tax credits, rebates, and other incentives to promote solar energy adoption.
- Falling costs of solar energy: The declining cost of solar energy makes it increasingly competitive with traditional energy sources.
- Growing awareness of environmental concerns: Consumers are increasingly aware of the environmental benefits of solar energy, driving adoption.
- Market penetration of solar PV technology: The penetration of solar PV technology continues to rise, translating to higher demand for PV glass.
Dominant Regions & Segments in Solar Photovoltaic Glass Industry
The Asia-Pacific region currently holds the largest market share in the solar PV glass industry, driven by robust solar energy deployment in China, India, and Japan. Europe and North America also exhibit significant growth, although at a slower pace compared to the Asia-Pacific region.
Key Drivers by Region:
- Asia-Pacific: Strong government support, substantial manufacturing capacity, and a rapidly growing solar energy market.
- Europe: Favorable regulatory frameworks, high energy prices, and increasing commitment to renewable energy targets.
- North America: Growing awareness of environmental concerns, increasing adoption of rooftop solar, and government incentives.
Segment Dominance:
- By Type: Crystalline silicon solar cells dominate the market, followed by thin-film technologies. AR coated glass holds a significant share in the "By Type" segment due to its enhanced light transmission properties.
- By Technology: Crystalline silicon technology holds the largest market share, owing to its high efficiency and established manufacturing infrastructure.
- By Application: The non-residential segment, encompassing commercial and industrial applications, is experiencing rapid growth, driven by large-scale solar installations.
Solar Photovoltaic Glass Industry Product Innovations
Recent advancements in solar PV glass include the development of self-cleaning glass, bifacial glass (absorbing light from both sides), and improved anti-reflective coatings that enhance energy efficiency. These innovations aim to improve energy harvesting, reduce maintenance requirements, and increase the lifespan of solar panels. The market is witnessing a transition toward higher efficiency and more durable glass types that can withstand harsh weather conditions.
Report Scope & Segmentation Analysis
This report segments the solar PV glass market by type (AR coated glass, tempered glass, TCO coated glass, other types), technology (crystalline silicon, cadmium telluride thin film, amorphous silicon solar, copper indium gallium diselenide (CIGS), other technologies), and application (residential, non-residential). Each segment’s growth projections, market size, and competitive landscape are analyzed in detail, considering factors such as technological advancements, regulatory changes, and consumer preferences. The market size for AR coated glass is projected to reach xx Million by 2033, while the crystalline silicon technology segment is expected to dominate the market with xx Million in revenue by 2033.
Key Drivers of Solar Photovoltaic Glass Industry Growth
The solar PV glass industry's growth is propelled by several key factors:
- Increasing demand for renewable energy: Driven by environmental concerns and the need for sustainable energy sources.
- Government policies and incentives: Governments worldwide are implementing policies to encourage the adoption of solar energy.
- Technological advancements: Continuous improvements in glass manufacturing techniques and coating technologies are improving efficiency and reducing costs.
- Decreasing cost of solar PV systems: Making solar energy increasingly accessible to a wider range of consumers.
Challenges in the Solar Photovoltaic Glass Industry Sector
The industry faces several challenges:
- Fluctuations in raw material prices: Impacting manufacturing costs and profitability.
- Intense competition: From both established players and new entrants.
- Supply chain disruptions: Potentially affecting production and delivery timelines.
- Technological advancements in competing technologies: Creating competitive pressure for innovation.
Emerging Opportunities in Solar Photovoltaic Glass Industry
Emerging opportunities include:
- Growth in emerging markets: Offering significant untapped potential for solar PV glass.
- Development of new glass types: With enhanced properties for improved efficiency and durability.
- Integration of smart technologies: For optimizing energy generation and management.
- Expansion into new applications: Such as building-integrated photovoltaics (BIPV).
Leading Players in the Solar Photovoltaic Glass Industry Market
- Nippon Sheet Glass Co Ltd
- Hainan Development Holdings Nanhai Co Ltd
- CSG Holding Co Ltd
- Saint-Gobain
- Irico Group New Energy Company Limited
- Sisecam
- Jinjing (Group) Co Ltd
- Taiwan Glass Ind Corp
- Onyx Solar Group LLC
- Guardian Industries Holdings
- Flat Glass Group Co Ltd
- Xinyi Solar Holdings Limited
- Kaneka Energy Management Solutions
- AGC Inc
- Borosil Limited
Key Developments in Solar Photovoltaic Glass Industry Industry
- October 2023: Borosil Renewables Limited acquired an 86% stake in Interfloat Corporation and Glasmanufaktur Brandenburg (GMB), boosting its European solar glass manufacturing capacity to 750 TPD from 450 TPD.
- July 2023: AGC Flat Glass Ibérica commissioned a 4,600 kW photovoltaic plant at the Port of Sagunto (Valencia), demonstrating the integration of PV glass in industrial applications.
Future Outlook for Solar Photovoltaic Glass Industry Market
The future of the solar PV glass industry is bright, with continued growth driven by increasing global demand for renewable energy, technological advancements, and supportive government policies. Strategic partnerships, investments in R&D, and expansion into new markets will play a crucial role in shaping the industry's future. The market is expected to experience sustained growth, with opportunities for innovation and expansion across various segments and geographic regions.
Solar Photovoltaic Glass Industry Segmentation
-
1. Type
- 1.1. AR Coated Glass
- 1.2. Tempered Glass
- 1.3. TCO Coated Glass
- 1.4. Other Types
-
2. Technology
- 2.1. Crystalline Silicon
- 2.2. Cadmium Telluride Thin Film
- 2.3. Amorphous Silicon Solar
- 2.4. Copper Indium Gallium Diselenide (cigs)
- 2.5. Other Technologies
-
3. Application
- 3.1. Residential
-
3.2. Non-residential
- 3.2.1. Commercial
- 3.2.2. Industrial/institutional
- 3.2.3. Other Applications
Solar Photovoltaic Glass Industry Segmentation By Geography
-
1. Asia Pacific
- 1.1. China
- 1.2. India
- 1.3. Japan
- 1.4. South Korea
- 1.5. Rest of Asia Pacific
-
2. North America
- 2.1. United States
- 2.2. Canada
- 2.3. Mexico
-
3. Europe
- 3.1. Germany
- 3.2. United Kingdom
- 3.3. France
- 3.4. Italy
- 3.5. Rest of Europe
-
4. South America
- 4.1. Brazil
- 4.2. Argentina
- 4.3. Rest of South America
-
5. Middle East and Africa
- 5.1. Saudi Arabia
- 5.2. South Africa
- 5.3. Morocco
- 5.4. Rest of Middle East and Africa
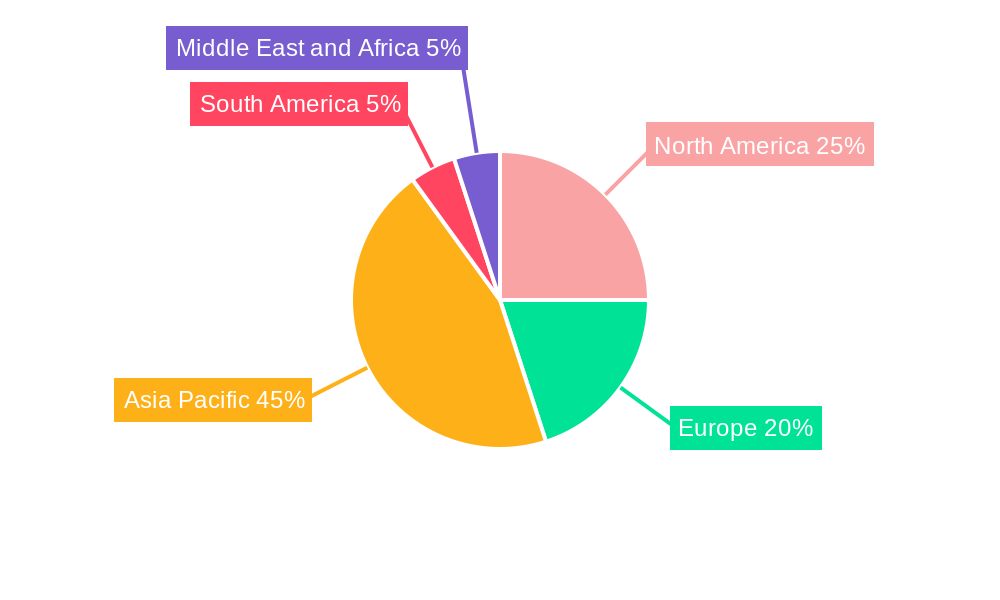
Solar Photovoltaic Glass Industry Regional Market Share
Geographic Coverage of Solar Photovoltaic Glass Industry
Solar Photovoltaic Glass Industry REPORT HIGHLIGHTS
| Aspects | Details |
|---|---|
| Study Period | 2020-2034 |
| Base Year | 2025 |
| Estimated Year | 2026 |
| Forecast Period | 2026-2034 |
| Historical Period | 2020-2025 |
| Growth Rate | CAGR of 31.2% from 2020-2034 |
| Segmentation |
|
Table of Contents
- 1. Introduction
- 1.1. Research Scope
- 1.2. Market Segmentation
- 1.3. Research Objective
- 1.4. Definitions and Assumptions
- 2. Executive Summary
- 2.1. Market Snapshot
- 3. Market Dynamics
- 3.1. Market Drivers
- 3.2. Market Restrains
- 3.3. Market Trends
- 3.4. Market Opportunities
- 4. Market Factor Analysis
- 4.1. Porters Five Forces
- 4.1.1. Bargaining Power of Suppliers
- 4.1.2. Bargaining Power of Buyers
- 4.1.3. Threat of New Entrants
- 4.1.4. Threat of Substitutes
- 4.1.5. Competitive Rivalry
- 4.2. PESTEL analysis
- 4.3. BCG Analysis
- 4.3.1. Stars (High Growth, High Market Share)
- 4.3.2. Cash Cows (Low Growth, High Market Share)
- 4.3.3. Question Mark (High Growth, Low Market Share)
- 4.3.4. Dogs (Low Growth, Low Market Share)
- 4.4. Ansoff Matrix Analysis
- 4.5. Supply Chain Analysis
- 4.6. Regulatory Landscape
- 4.7. Current Market Potential and Opportunity Assessment (TAM–SAM–SOM Framework)
- 4.8. PRI Analyst Note
- 4.1. Porters Five Forces
- 5. Market Analysis, Insights and Forecast 2021-2033
- 5.1. Market Analysis, Insights and Forecast - by Type
- 5.1.1. AR Coated Glass
- 5.1.2. Tempered Glass
- 5.1.3. TCO Coated Glass
- 5.1.4. Other Types
- 5.2. Market Analysis, Insights and Forecast - by Technology
- 5.2.1. Crystalline Silicon
- 5.2.2. Cadmium Telluride Thin Film
- 5.2.3. Amorphous Silicon Solar
- 5.2.4. Copper Indium Gallium Diselenide (cigs)
- 5.2.5. Other Technologies
- 5.3. Market Analysis, Insights and Forecast - by Application
- 5.3.1. Residential
- 5.3.2. Non-residential
- 5.3.2.1. Commercial
- 5.3.2.2. Industrial/institutional
- 5.3.2.3. Other Applications
- 5.4. Market Analysis, Insights and Forecast - by Region
- 5.4.1. Asia Pacific
- 5.4.2. North America
- 5.4.3. Europe
- 5.4.4. South America
- 5.4.5. Middle East and Africa
- 5.1. Market Analysis, Insights and Forecast - by Type
- 6. Global Solar Photovoltaic Glass Industry Analysis, Insights and Forecast, 2021-2033
- 6.1. Market Analysis, Insights and Forecast - by Type
- 6.1.1. AR Coated Glass
- 6.1.2. Tempered Glass
- 6.1.3. TCO Coated Glass
- 6.1.4. Other Types
- 6.2. Market Analysis, Insights and Forecast - by Technology
- 6.2.1. Crystalline Silicon
- 6.2.2. Cadmium Telluride Thin Film
- 6.2.3. Amorphous Silicon Solar
- 6.2.4. Copper Indium Gallium Diselenide (cigs)
- 6.2.5. Other Technologies
- 6.3. Market Analysis, Insights and Forecast - by Application
- 6.3.1. Residential
- 6.3.2. Non-residential
- 6.3.2.1. Commercial
- 6.3.2.2. Industrial/institutional
- 6.3.2.3. Other Applications
- 6.1. Market Analysis, Insights and Forecast - by Type
- 7. Asia Pacific Solar Photovoltaic Glass Industry Analysis, Insights and Forecast, 2020-2032
- 7.1. Market Analysis, Insights and Forecast - by Type
- 7.1.1. AR Coated Glass
- 7.1.2. Tempered Glass
- 7.1.3. TCO Coated Glass
- 7.1.4. Other Types
- 7.2. Market Analysis, Insights and Forecast - by Technology
- 7.2.1. Crystalline Silicon
- 7.2.2. Cadmium Telluride Thin Film
- 7.2.3. Amorphous Silicon Solar
- 7.2.4. Copper Indium Gallium Diselenide (cigs)
- 7.2.5. Other Technologies
- 7.3. Market Analysis, Insights and Forecast - by Application
- 7.3.1. Residential
- 7.3.2. Non-residential
- 7.3.2.1. Commercial
- 7.3.2.2. Industrial/institutional
- 7.3.2.3. Other Applications
- 7.1. Market Analysis, Insights and Forecast - by Type
- 8. North America Solar Photovoltaic Glass Industry Analysis, Insights and Forecast, 2020-2032
- 8.1. Market Analysis, Insights and Forecast - by Type
- 8.1.1. AR Coated Glass
- 8.1.2. Tempered Glass
- 8.1.3. TCO Coated Glass
- 8.1.4. Other Types
- 8.2. Market Analysis, Insights and Forecast - by Technology
- 8.2.1. Crystalline Silicon
- 8.2.2. Cadmium Telluride Thin Film
- 8.2.3. Amorphous Silicon Solar
- 8.2.4. Copper Indium Gallium Diselenide (cigs)
- 8.2.5. Other Technologies
- 8.3. Market Analysis, Insights and Forecast - by Application
- 8.3.1. Residential
- 8.3.2. Non-residential
- 8.3.2.1. Commercial
- 8.3.2.2. Industrial/institutional
- 8.3.2.3. Other Applications
- 8.1. Market Analysis, Insights and Forecast - by Type
- 9. Europe Solar Photovoltaic Glass Industry Analysis, Insights and Forecast, 2020-2032
- 9.1. Market Analysis, Insights and Forecast - by Type
- 9.1.1. AR Coated Glass
- 9.1.2. Tempered Glass
- 9.1.3. TCO Coated Glass
- 9.1.4. Other Types
- 9.2. Market Analysis, Insights and Forecast - by Technology
- 9.2.1. Crystalline Silicon
- 9.2.2. Cadmium Telluride Thin Film
- 9.2.3. Amorphous Silicon Solar
- 9.2.4. Copper Indium Gallium Diselenide (cigs)
- 9.2.5. Other Technologies
- 9.3. Market Analysis, Insights and Forecast - by Application
- 9.3.1. Residential
- 9.3.2. Non-residential
- 9.3.2.1. Commercial
- 9.3.2.2. Industrial/institutional
- 9.3.2.3. Other Applications
- 9.1. Market Analysis, Insights and Forecast - by Type
- 10. South America Solar Photovoltaic Glass Industry Analysis, Insights and Forecast, 2020-2032
- 10.1. Market Analysis, Insights and Forecast - by Type
- 10.1.1. AR Coated Glass
- 10.1.2. Tempered Glass
- 10.1.3. TCO Coated Glass
- 10.1.4. Other Types
- 10.2. Market Analysis, Insights and Forecast - by Technology
- 10.2.1. Crystalline Silicon
- 10.2.2. Cadmium Telluride Thin Film
- 10.2.3. Amorphous Silicon Solar
- 10.2.4. Copper Indium Gallium Diselenide (cigs)
- 10.2.5. Other Technologies
- 10.3. Market Analysis, Insights and Forecast - by Application
- 10.3.1. Residential
- 10.3.2. Non-residential
- 10.3.2.1. Commercial
- 10.3.2.2. Industrial/institutional
- 10.3.2.3. Other Applications
- 10.1. Market Analysis, Insights and Forecast - by Type
- 11. Middle East and Africa Solar Photovoltaic Glass Industry Analysis, Insights and Forecast, 2020-2032
- 11.1. Market Analysis, Insights and Forecast - by Type
- 11.1.1. AR Coated Glass
- 11.1.2. Tempered Glass
- 11.1.3. TCO Coated Glass
- 11.1.4. Other Types
- 11.2. Market Analysis, Insights and Forecast - by Technology
- 11.2.1. Crystalline Silicon
- 11.2.2. Cadmium Telluride Thin Film
- 11.2.3. Amorphous Silicon Solar
- 11.2.4. Copper Indium Gallium Diselenide (cigs)
- 11.2.5. Other Technologies
- 11.3. Market Analysis, Insights and Forecast - by Application
- 11.3.1. Residential
- 11.3.2. Non-residential
- 11.3.2.1. Commercial
- 11.3.2.2. Industrial/institutional
- 11.3.2.3. Other Applications
- 11.1. Market Analysis, Insights and Forecast - by Type
- 12. Competitive Analysis
- 12.1. Company Profiles
- 12.1.1 Nippon Sheet Glass Co Ltd
- 12.1.1.1. Company Overview
- 12.1.1.2. Products
- 12.1.1.3. Company Financials
- 12.1.1.4. SWOT Analysis
- 12.1.2 Hainan Development Holdings Nanhai Co Ltd
- 12.1.2.1. Company Overview
- 12.1.2.2. Products
- 12.1.2.3. Company Financials
- 12.1.2.4. SWOT Analysis
- 12.1.3 CSG Holding Co Ltd
- 12.1.3.1. Company Overview
- 12.1.3.2. Products
- 12.1.3.3. Company Financials
- 12.1.3.4. SWOT Analysis
- 12.1.4 Saint-Gobain
- 12.1.4.1. Company Overview
- 12.1.4.2. Products
- 12.1.4.3. Company Financials
- 12.1.4.4. SWOT Analysis
- 12.1.5 Irico Group New Energy Company Limited
- 12.1.5.1. Company Overview
- 12.1.5.2. Products
- 12.1.5.3. Company Financials
- 12.1.5.4. SWOT Analysis
- 12.1.6 Sisecam
- 12.1.6.1. Company Overview
- 12.1.6.2. Products
- 12.1.6.3. Company Financials
- 12.1.6.4. SWOT Analysis
- 12.1.7 Jinjing (Group) Co Ltd
- 12.1.7.1. Company Overview
- 12.1.7.2. Products
- 12.1.7.3. Company Financials
- 12.1.7.4. SWOT Analysis
- 12.1.8 Taiwan Glass Ind Corp
- 12.1.8.1. Company Overview
- 12.1.8.2. Products
- 12.1.8.3. Company Financials
- 12.1.8.4. SWOT Analysis
- 12.1.9 Onyx Solar Group LLC
- 12.1.9.1. Company Overview
- 12.1.9.2. Products
- 12.1.9.3. Company Financials
- 12.1.9.4. SWOT Analysis
- 12.1.10 Guardian Industries Holdings
- 12.1.10.1. Company Overview
- 12.1.10.2. Products
- 12.1.10.3. Company Financials
- 12.1.10.4. SWOT Analysis
- 12.1.11 Flat Glass Group Co Ltd
- 12.1.11.1. Company Overview
- 12.1.11.2. Products
- 12.1.11.3. Company Financials
- 12.1.11.4. SWOT Analysis
- 12.1.12 Xinyi Solar Holdings Limited*List Not Exhaustive
- 12.1.12.1. Company Overview
- 12.1.12.2. Products
- 12.1.12.3. Company Financials
- 12.1.12.4. SWOT Analysis
- 12.1.13 Kaneka Energy Management Solutions
- 12.1.13.1. Company Overview
- 12.1.13.2. Products
- 12.1.13.3. Company Financials
- 12.1.13.4. SWOT Analysis
- 12.1.14 AGC Inc
- 12.1.14.1. Company Overview
- 12.1.14.2. Products
- 12.1.14.3. Company Financials
- 12.1.14.4. SWOT Analysis
- 12.1.15 Borosil Limited
- 12.1.15.1. Company Overview
- 12.1.15.2. Products
- 12.1.15.3. Company Financials
- 12.1.15.4. SWOT Analysis
- 12.1.1 Nippon Sheet Glass Co Ltd
- 12.2. Market Entropy
- 12.2.1 Company's Key Areas Served
- 12.2.2 Recent Developments
- 12.3. Company Market Share Analysis 2025
- 12.3.1 Top 5 Companies Market Share Analysis
- 12.3.2 Top 3 Companies Market Share Analysis
- 12.4. List of Potential Customers
- 13. Research Methodology
List of Figures
- Figure 1: Global Solar Photovoltaic Glass Industry Revenue Breakdown (billion, %) by Region 2025 & 2033
- Figure 2: Global Solar Photovoltaic Glass Industry Volume Breakdown (Million, %) by Region 2025 & 2033
- Figure 3: Asia Pacific Solar Photovoltaic Glass Industry Revenue (billion), by Type 2025 & 2033
- Figure 4: Asia Pacific Solar Photovoltaic Glass Industry Volume (Million), by Type 2025 & 2033
- Figure 5: Asia Pacific Solar Photovoltaic Glass Industry Revenue Share (%), by Type 2025 & 2033
- Figure 6: Asia Pacific Solar Photovoltaic Glass Industry Volume Share (%), by Type 2025 & 2033
- Figure 7: Asia Pacific Solar Photovoltaic Glass Industry Revenue (billion), by Technology 2025 & 2033
- Figure 8: Asia Pacific Solar Photovoltaic Glass Industry Volume (Million), by Technology 2025 & 2033
- Figure 9: Asia Pacific Solar Photovoltaic Glass Industry Revenue Share (%), by Technology 2025 & 2033
- Figure 10: Asia Pacific Solar Photovoltaic Glass Industry Volume Share (%), by Technology 2025 & 2033
- Figure 11: Asia Pacific Solar Photovoltaic Glass Industry Revenue (billion), by Application 2025 & 2033
- Figure 12: Asia Pacific Solar Photovoltaic Glass Industry Volume (Million), by Application 2025 & 2033
- Figure 13: Asia Pacific Solar Photovoltaic Glass Industry Revenue Share (%), by Application 2025 & 2033
- Figure 14: Asia Pacific Solar Photovoltaic Glass Industry Volume Share (%), by Application 2025 & 2033
- Figure 15: Asia Pacific Solar Photovoltaic Glass Industry Revenue (billion), by Country 2025 & 2033
- Figure 16: Asia Pacific Solar Photovoltaic Glass Industry Volume (Million), by Country 2025 & 2033
- Figure 17: Asia Pacific Solar Photovoltaic Glass Industry Revenue Share (%), by Country 2025 & 2033
- Figure 18: Asia Pacific Solar Photovoltaic Glass Industry Volume Share (%), by Country 2025 & 2033
- Figure 19: North America Solar Photovoltaic Glass Industry Revenue (billion), by Type 2025 & 2033
- Figure 20: North America Solar Photovoltaic Glass Industry Volume (Million), by Type 2025 & 2033
- Figure 21: North America Solar Photovoltaic Glass Industry Revenue Share (%), by Type 2025 & 2033
- Figure 22: North America Solar Photovoltaic Glass Industry Volume Share (%), by Type 2025 & 2033
- Figure 23: North America Solar Photovoltaic Glass Industry Revenue (billion), by Technology 2025 & 2033
- Figure 24: North America Solar Photovoltaic Glass Industry Volume (Million), by Technology 2025 & 2033
- Figure 25: North America Solar Photovoltaic Glass Industry Revenue Share (%), by Technology 2025 & 2033
- Figure 26: North America Solar Photovoltaic Glass Industry Volume Share (%), by Technology 2025 & 2033
- Figure 27: North America Solar Photovoltaic Glass Industry Revenue (billion), by Application 2025 & 2033
- Figure 28: North America Solar Photovoltaic Glass Industry Volume (Million), by Application 2025 & 2033
- Figure 29: North America Solar Photovoltaic Glass Industry Revenue Share (%), by Application 2025 & 2033
- Figure 30: North America Solar Photovoltaic Glass Industry Volume Share (%), by Application 2025 & 2033
- Figure 31: North America Solar Photovoltaic Glass Industry Revenue (billion), by Country 2025 & 2033
- Figure 32: North America Solar Photovoltaic Glass Industry Volume (Million), by Country 2025 & 2033
- Figure 33: North America Solar Photovoltaic Glass Industry Revenue Share (%), by Country 2025 & 2033
- Figure 34: North America Solar Photovoltaic Glass Industry Volume Share (%), by Country 2025 & 2033
- Figure 35: Europe Solar Photovoltaic Glass Industry Revenue (billion), by Type 2025 & 2033
- Figure 36: Europe Solar Photovoltaic Glass Industry Volume (Million), by Type 2025 & 2033
- Figure 37: Europe Solar Photovoltaic Glass Industry Revenue Share (%), by Type 2025 & 2033
- Figure 38: Europe Solar Photovoltaic Glass Industry Volume Share (%), by Type 2025 & 2033
- Figure 39: Europe Solar Photovoltaic Glass Industry Revenue (billion), by Technology 2025 & 2033
- Figure 40: Europe Solar Photovoltaic Glass Industry Volume (Million), by Technology 2025 & 2033
- Figure 41: Europe Solar Photovoltaic Glass Industry Revenue Share (%), by Technology 2025 & 2033
- Figure 42: Europe Solar Photovoltaic Glass Industry Volume Share (%), by Technology 2025 & 2033
- Figure 43: Europe Solar Photovoltaic Glass Industry Revenue (billion), by Application 2025 & 2033
- Figure 44: Europe Solar Photovoltaic Glass Industry Volume (Million), by Application 2025 & 2033
- Figure 45: Europe Solar Photovoltaic Glass Industry Revenue Share (%), by Application 2025 & 2033
- Figure 46: Europe Solar Photovoltaic Glass Industry Volume Share (%), by Application 2025 & 2033
- Figure 47: Europe Solar Photovoltaic Glass Industry Revenue (billion), by Country 2025 & 2033
- Figure 48: Europe Solar Photovoltaic Glass Industry Volume (Million), by Country 2025 & 2033
- Figure 49: Europe Solar Photovoltaic Glass Industry Revenue Share (%), by Country 2025 & 2033
- Figure 50: Europe Solar Photovoltaic Glass Industry Volume Share (%), by Country 2025 & 2033
- Figure 51: South America Solar Photovoltaic Glass Industry Revenue (billion), by Type 2025 & 2033
- Figure 52: South America Solar Photovoltaic Glass Industry Volume (Million), by Type 2025 & 2033
- Figure 53: South America Solar Photovoltaic Glass Industry Revenue Share (%), by Type 2025 & 2033
- Figure 54: South America Solar Photovoltaic Glass Industry Volume Share (%), by Type 2025 & 2033
- Figure 55: South America Solar Photovoltaic Glass Industry Revenue (billion), by Technology 2025 & 2033
- Figure 56: South America Solar Photovoltaic Glass Industry Volume (Million), by Technology 2025 & 2033
- Figure 57: South America Solar Photovoltaic Glass Industry Revenue Share (%), by Technology 2025 & 2033
- Figure 58: South America Solar Photovoltaic Glass Industry Volume Share (%), by Technology 2025 & 2033
- Figure 59: South America Solar Photovoltaic Glass Industry Revenue (billion), by Application 2025 & 2033
- Figure 60: South America Solar Photovoltaic Glass Industry Volume (Million), by Application 2025 & 2033
- Figure 61: South America Solar Photovoltaic Glass Industry Revenue Share (%), by Application 2025 & 2033
- Figure 62: South America Solar Photovoltaic Glass Industry Volume Share (%), by Application 2025 & 2033
- Figure 63: South America Solar Photovoltaic Glass Industry Revenue (billion), by Country 2025 & 2033
- Figure 64: South America Solar Photovoltaic Glass Industry Volume (Million), by Country 2025 & 2033
- Figure 65: South America Solar Photovoltaic Glass Industry Revenue Share (%), by Country 2025 & 2033
- Figure 66: South America Solar Photovoltaic Glass Industry Volume Share (%), by Country 2025 & 2033
- Figure 67: Middle East and Africa Solar Photovoltaic Glass Industry Revenue (billion), by Type 2025 & 2033
- Figure 68: Middle East and Africa Solar Photovoltaic Glass Industry Volume (Million), by Type 2025 & 2033
- Figure 69: Middle East and Africa Solar Photovoltaic Glass Industry Revenue Share (%), by Type 2025 & 2033
- Figure 70: Middle East and Africa Solar Photovoltaic Glass Industry Volume Share (%), by Type 2025 & 2033
- Figure 71: Middle East and Africa Solar Photovoltaic Glass Industry Revenue (billion), by Technology 2025 & 2033
- Figure 72: Middle East and Africa Solar Photovoltaic Glass Industry Volume (Million), by Technology 2025 & 2033
- Figure 73: Middle East and Africa Solar Photovoltaic Glass Industry Revenue Share (%), by Technology 2025 & 2033
- Figure 74: Middle East and Africa Solar Photovoltaic Glass Industry Volume Share (%), by Technology 2025 & 2033
- Figure 75: Middle East and Africa Solar Photovoltaic Glass Industry Revenue (billion), by Application 2025 & 2033
- Figure 76: Middle East and Africa Solar Photovoltaic Glass Industry Volume (Million), by Application 2025 & 2033
- Figure 77: Middle East and Africa Solar Photovoltaic Glass Industry Revenue Share (%), by Application 2025 & 2033
- Figure 78: Middle East and Africa Solar Photovoltaic Glass Industry Volume Share (%), by Application 2025 & 2033
- Figure 79: Middle East and Africa Solar Photovoltaic Glass Industry Revenue (billion), by Country 2025 & 2033
- Figure 80: Middle East and Africa Solar Photovoltaic Glass Industry Volume (Million), by Country 2025 & 2033
- Figure 81: Middle East and Africa Solar Photovoltaic Glass Industry Revenue Share (%), by Country 2025 & 2033
- Figure 82: Middle East and Africa Solar Photovoltaic Glass Industry Volume Share (%), by Country 2025 & 2033
List of Tables
- Table 1: Global Solar Photovoltaic Glass Industry Revenue billion Forecast, by Type 2020 & 2033
- Table 2: Global Solar Photovoltaic Glass Industry Volume Million Forecast, by Type 2020 & 2033
- Table 3: Global Solar Photovoltaic Glass Industry Revenue billion Forecast, by Technology 2020 & 2033
- Table 4: Global Solar Photovoltaic Glass Industry Volume Million Forecast, by Technology 2020 & 2033
- Table 5: Global Solar Photovoltaic Glass Industry Revenue billion Forecast, by Application 2020 & 2033
- Table 6: Global Solar Photovoltaic Glass Industry Volume Million Forecast, by Application 2020 & 2033
- Table 7: Global Solar Photovoltaic Glass Industry Revenue billion Forecast, by Region 2020 & 2033
- Table 8: Global Solar Photovoltaic Glass Industry Volume Million Forecast, by Region 2020 & 2033
- Table 9: Global Solar Photovoltaic Glass Industry Revenue billion Forecast, by Type 2020 & 2033
- Table 10: Global Solar Photovoltaic Glass Industry Volume Million Forecast, by Type 2020 & 2033
- Table 11: Global Solar Photovoltaic Glass Industry Revenue billion Forecast, by Technology 2020 & 2033
- Table 12: Global Solar Photovoltaic Glass Industry Volume Million Forecast, by Technology 2020 & 2033
- Table 13: Global Solar Photovoltaic Glass Industry Revenue billion Forecast, by Application 2020 & 2033
- Table 14: Global Solar Photovoltaic Glass Industry Volume Million Forecast, by Application 2020 & 2033
- Table 15: Global Solar Photovoltaic Glass Industry Revenue billion Forecast, by Country 2020 & 2033
- Table 16: Global Solar Photovoltaic Glass Industry Volume Million Forecast, by Country 2020 & 2033
- Table 17: China Solar Photovoltaic Glass Industry Revenue (billion) Forecast, by Application 2020 & 2033
- Table 18: China Solar Photovoltaic Glass Industry Volume (Million) Forecast, by Application 2020 & 2033
- Table 19: India Solar Photovoltaic Glass Industry Revenue (billion) Forecast, by Application 2020 & 2033
- Table 20: India Solar Photovoltaic Glass Industry Volume (Million) Forecast, by Application 2020 & 2033
- Table 21: Japan Solar Photovoltaic Glass Industry Revenue (billion) Forecast, by Application 2020 & 2033
- Table 22: Japan Solar Photovoltaic Glass Industry Volume (Million) Forecast, by Application 2020 & 2033
- Table 23: South Korea Solar Photovoltaic Glass Industry Revenue (billion) Forecast, by Application 2020 & 2033
- Table 24: South Korea Solar Photovoltaic Glass Industry Volume (Million) Forecast, by Application 2020 & 2033
- Table 25: Rest of Asia Pacific Solar Photovoltaic Glass Industry Revenue (billion) Forecast, by Application 2020 & 2033
- Table 26: Rest of Asia Pacific Solar Photovoltaic Glass Industry Volume (Million) Forecast, by Application 2020 & 2033
- Table 27: Global Solar Photovoltaic Glass Industry Revenue billion Forecast, by Type 2020 & 2033
- Table 28: Global Solar Photovoltaic Glass Industry Volume Million Forecast, by Type 2020 & 2033
- Table 29: Global Solar Photovoltaic Glass Industry Revenue billion Forecast, by Technology 2020 & 2033
- Table 30: Global Solar Photovoltaic Glass Industry Volume Million Forecast, by Technology 2020 & 2033
- Table 31: Global Solar Photovoltaic Glass Industry Revenue billion Forecast, by Application 2020 & 2033
- Table 32: Global Solar Photovoltaic Glass Industry Volume Million Forecast, by Application 2020 & 2033
- Table 33: Global Solar Photovoltaic Glass Industry Revenue billion Forecast, by Country 2020 & 2033
- Table 34: Global Solar Photovoltaic Glass Industry Volume Million Forecast, by Country 2020 & 2033
- Table 35: United States Solar Photovoltaic Glass Industry Revenue (billion) Forecast, by Application 2020 & 2033
- Table 36: United States Solar Photovoltaic Glass Industry Volume (Million) Forecast, by Application 2020 & 2033
- Table 37: Canada Solar Photovoltaic Glass Industry Revenue (billion) Forecast, by Application 2020 & 2033
- Table 38: Canada Solar Photovoltaic Glass Industry Volume (Million) Forecast, by Application 2020 & 2033
- Table 39: Mexico Solar Photovoltaic Glass Industry Revenue (billion) Forecast, by Application 2020 & 2033
- Table 40: Mexico Solar Photovoltaic Glass Industry Volume (Million) Forecast, by Application 2020 & 2033
- Table 41: Global Solar Photovoltaic Glass Industry Revenue billion Forecast, by Type 2020 & 2033
- Table 42: Global Solar Photovoltaic Glass Industry Volume Million Forecast, by Type 2020 & 2033
- Table 43: Global Solar Photovoltaic Glass Industry Revenue billion Forecast, by Technology 2020 & 2033
- Table 44: Global Solar Photovoltaic Glass Industry Volume Million Forecast, by Technology 2020 & 2033
- Table 45: Global Solar Photovoltaic Glass Industry Revenue billion Forecast, by Application 2020 & 2033
- Table 46: Global Solar Photovoltaic Glass Industry Volume Million Forecast, by Application 2020 & 2033
- Table 47: Global Solar Photovoltaic Glass Industry Revenue billion Forecast, by Country 2020 & 2033
- Table 48: Global Solar Photovoltaic Glass Industry Volume Million Forecast, by Country 2020 & 2033
- Table 49: Germany Solar Photovoltaic Glass Industry Revenue (billion) Forecast, by Application 2020 & 2033
- Table 50: Germany Solar Photovoltaic Glass Industry Volume (Million) Forecast, by Application 2020 & 2033
- Table 51: United Kingdom Solar Photovoltaic Glass Industry Revenue (billion) Forecast, by Application 2020 & 2033
- Table 52: United Kingdom Solar Photovoltaic Glass Industry Volume (Million) Forecast, by Application 2020 & 2033
- Table 53: France Solar Photovoltaic Glass Industry Revenue (billion) Forecast, by Application 2020 & 2033
- Table 54: France Solar Photovoltaic Glass Industry Volume (Million) Forecast, by Application 2020 & 2033
- Table 55: Italy Solar Photovoltaic Glass Industry Revenue (billion) Forecast, by Application 2020 & 2033
- Table 56: Italy Solar Photovoltaic Glass Industry Volume (Million) Forecast, by Application 2020 & 2033
- Table 57: Rest of Europe Solar Photovoltaic Glass Industry Revenue (billion) Forecast, by Application 2020 & 2033
- Table 58: Rest of Europe Solar Photovoltaic Glass Industry Volume (Million) Forecast, by Application 2020 & 2033
- Table 59: Global Solar Photovoltaic Glass Industry Revenue billion Forecast, by Type 2020 & 2033
- Table 60: Global Solar Photovoltaic Glass Industry Volume Million Forecast, by Type 2020 & 2033
- Table 61: Global Solar Photovoltaic Glass Industry Revenue billion Forecast, by Technology 2020 & 2033
- Table 62: Global Solar Photovoltaic Glass Industry Volume Million Forecast, by Technology 2020 & 2033
- Table 63: Global Solar Photovoltaic Glass Industry Revenue billion Forecast, by Application 2020 & 2033
- Table 64: Global Solar Photovoltaic Glass Industry Volume Million Forecast, by Application 2020 & 2033
- Table 65: Global Solar Photovoltaic Glass Industry Revenue billion Forecast, by Country 2020 & 2033
- Table 66: Global Solar Photovoltaic Glass Industry Volume Million Forecast, by Country 2020 & 2033
- Table 67: Brazil Solar Photovoltaic Glass Industry Revenue (billion) Forecast, by Application 2020 & 2033
- Table 68: Brazil Solar Photovoltaic Glass Industry Volume (Million) Forecast, by Application 2020 & 2033
- Table 69: Argentina Solar Photovoltaic Glass Industry Revenue (billion) Forecast, by Application 2020 & 2033
- Table 70: Argentina Solar Photovoltaic Glass Industry Volume (Million) Forecast, by Application 2020 & 2033
- Table 71: Rest of South America Solar Photovoltaic Glass Industry Revenue (billion) Forecast, by Application 2020 & 2033
- Table 72: Rest of South America Solar Photovoltaic Glass Industry Volume (Million) Forecast, by Application 2020 & 2033
- Table 73: Global Solar Photovoltaic Glass Industry Revenue billion Forecast, by Type 2020 & 2033
- Table 74: Global Solar Photovoltaic Glass Industry Volume Million Forecast, by Type 2020 & 2033
- Table 75: Global Solar Photovoltaic Glass Industry Revenue billion Forecast, by Technology 2020 & 2033
- Table 76: Global Solar Photovoltaic Glass Industry Volume Million Forecast, by Technology 2020 & 2033
- Table 77: Global Solar Photovoltaic Glass Industry Revenue billion Forecast, by Application 2020 & 2033
- Table 78: Global Solar Photovoltaic Glass Industry Volume Million Forecast, by Application 2020 & 2033
- Table 79: Global Solar Photovoltaic Glass Industry Revenue billion Forecast, by Country 2020 & 2033
- Table 80: Global Solar Photovoltaic Glass Industry Volume Million Forecast, by Country 2020 & 2033
- Table 81: Saudi Arabia Solar Photovoltaic Glass Industry Revenue (billion) Forecast, by Application 2020 & 2033
- Table 82: Saudi Arabia Solar Photovoltaic Glass Industry Volume (Million) Forecast, by Application 2020 & 2033
- Table 83: South Africa Solar Photovoltaic Glass Industry Revenue (billion) Forecast, by Application 2020 & 2033
- Table 84: South Africa Solar Photovoltaic Glass Industry Volume (Million) Forecast, by Application 2020 & 2033
- Table 85: Morocco Solar Photovoltaic Glass Industry Revenue (billion) Forecast, by Application 2020 & 2033
- Table 86: Morocco Solar Photovoltaic Glass Industry Volume (Million) Forecast, by Application 2020 & 2033
- Table 87: Rest of Middle East and Africa Solar Photovoltaic Glass Industry Revenue (billion) Forecast, by Application 2020 & 2033
- Table 88: Rest of Middle East and Africa Solar Photovoltaic Glass Industry Volume (Million) Forecast, by Application 2020 & 2033
Frequently Asked Questions
1. What is the projected Compound Annual Growth Rate (CAGR) of the Solar Photovoltaic Glass Industry?
The projected CAGR is approximately 31.2%.
2. Which companies are prominent players in the Solar Photovoltaic Glass Industry?
Key companies in the market include Nippon Sheet Glass Co Ltd, Hainan Development Holdings Nanhai Co Ltd, CSG Holding Co Ltd, Saint-Gobain, Irico Group New Energy Company Limited, Sisecam, Jinjing (Group) Co Ltd, Taiwan Glass Ind Corp, Onyx Solar Group LLC, Guardian Industries Holdings, Flat Glass Group Co Ltd, Xinyi Solar Holdings Limited*List Not Exhaustive, Kaneka Energy Management Solutions, AGC Inc, Borosil Limited.
3. What are the main segments of the Solar Photovoltaic Glass Industry?
The market segments include Type, Technology, Application.
4. Can you provide details about the market size?
The market size is estimated to be USD 17.09 billion as of 2022.
5. What are some drivers contributing to market growth?
Increasing Demand for Renewable Energy.
6. What are the notable trends driving market growth?
Increasing Demand from the Non-residential Sector.
7. Are there any restraints impacting market growth?
Rising Adoption of Alternate Clean Power Sources.
8. Can you provide examples of recent developments in the market?
In October 2023, Borosil Renewables Limited acquired an 86% stake in the two European solar glass manufacturers, Interfloat Corporation and Glasmanufaktur Brandenburg (GMB). The acquisition has boosted the company’s solar glass manufacturing capacity in Europe to 750 TPD from 450 TPD.
9. What pricing options are available for accessing the report?
Pricing options include single-user, multi-user, and enterprise licenses priced at USD 4750, USD 5250, and USD 8750 respectively.
10. Is the market size provided in terms of value or volume?
The market size is provided in terms of value, measured in billion and volume, measured in Million.
11. Are there any specific market keywords associated with the report?
Yes, the market keyword associated with the report is "Solar Photovoltaic Glass Industry," which aids in identifying and referencing the specific market segment covered.
12. How do I determine which pricing option suits my needs best?
The pricing options vary based on user requirements and access needs. Individual users may opt for single-user licenses, while businesses requiring broader access may choose multi-user or enterprise licenses for cost-effective access to the report.
13. Are there any additional resources or data provided in the Solar Photovoltaic Glass Industry report?
While the report offers comprehensive insights, it's advisable to review the specific contents or supplementary materials provided to ascertain if additional resources or data are available.
14. How can I stay updated on further developments or reports in the Solar Photovoltaic Glass Industry?
To stay informed about further developments, trends, and reports in the Solar Photovoltaic Glass Industry, consider subscribing to industry newsletters, following relevant companies and organizations, or regularly checking reputable industry news sources and publications.
Methodology
Step 1 - Identification of Relevant Samples Size from Population Database


Step 2 - Approaches for Defining Global Market Size (Value, Volume* & Price*)

Note*: In applicable scenarios
Step 3 - Data Sources
Primary Research
- Web Analytics
- Survey Reports
- Research Institute
- Latest Research Reports
- Opinion Leaders
Secondary Research
- Annual Reports
- White Paper
- Latest Press Release
- Industry Association
- Paid Database
- Investor Presentations

Step 4 - Data Triangulation
Involves using different sources of information in order to increase the validity of a study
These sources are likely to be stakeholders in a program - participants, other researchers, program staff, other community members, and so on.
Then we put all data in single framework & apply various statistical tools to find out the dynamic on the market.
During the analysis stage, feedback from the stakeholder groups would be compared to determine areas of agreement as well as areas of divergence