

Key Insights
The South American carbon black market, projected to expand at a Compound Annual Growth Rate (CAGR) of 6.3%, is driven by sustained demand from the automotive sector, burgeoning infrastructure projects, and the increasing utilization of high-performance materials. With a projected market size of $21.6 billion by 2025, growth is underpinned by the region's expanding automotive production, significant construction activities, and the escalating adoption of carbon black in specialty applications such as inks and plastics. Key players like Birla Carbon, Bridgestone, and Cabot Corporation are strategically enhancing regional production capabilities and embracing technological innovations to leverage emerging market opportunities. Challenges include raw material price volatility, stringent environmental regulations, and potential supply chain disruptions.
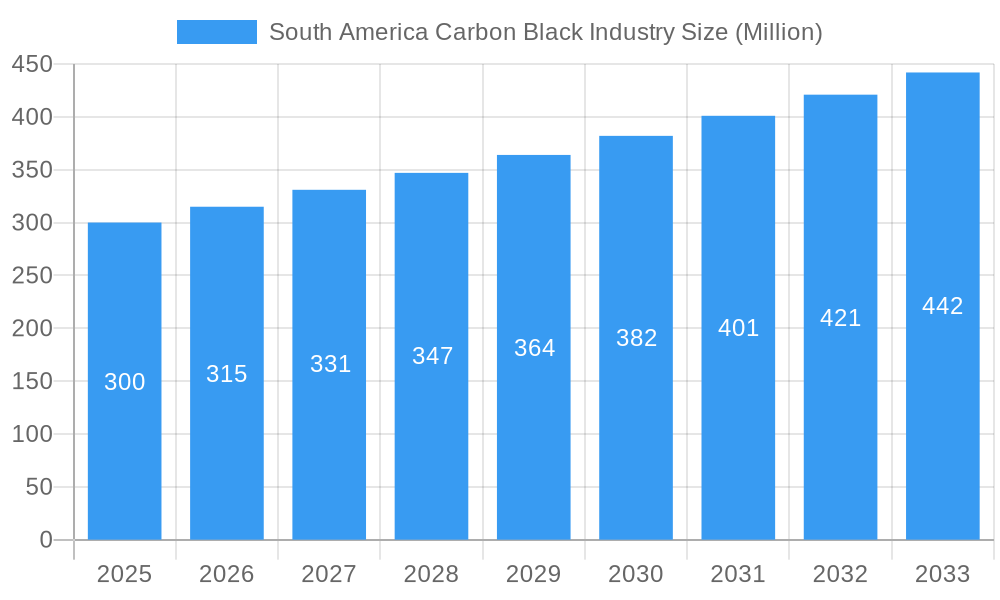
South America Carbon Black Industry Market Size (In Billion)
The forecast period anticipates continued market expansion, fueled by ongoing infrastructure development and the increasing integration of advanced materials across various industries. Market dynamics will be shaped by governmental policies supporting sustainable materials, global oil price fluctuations, and the overall economic performance of South American economies. Companies are prioritizing innovation to develop sustainable carbon black alternatives and optimize production efficiency, addressing environmental concerns and maintaining competitive advantages. While the rise of electric vehicles may present short-term adjustments, the long-term outlook remains positive, as carbon black is indispensable for tire manufacturing, even within the evolving EV landscape.
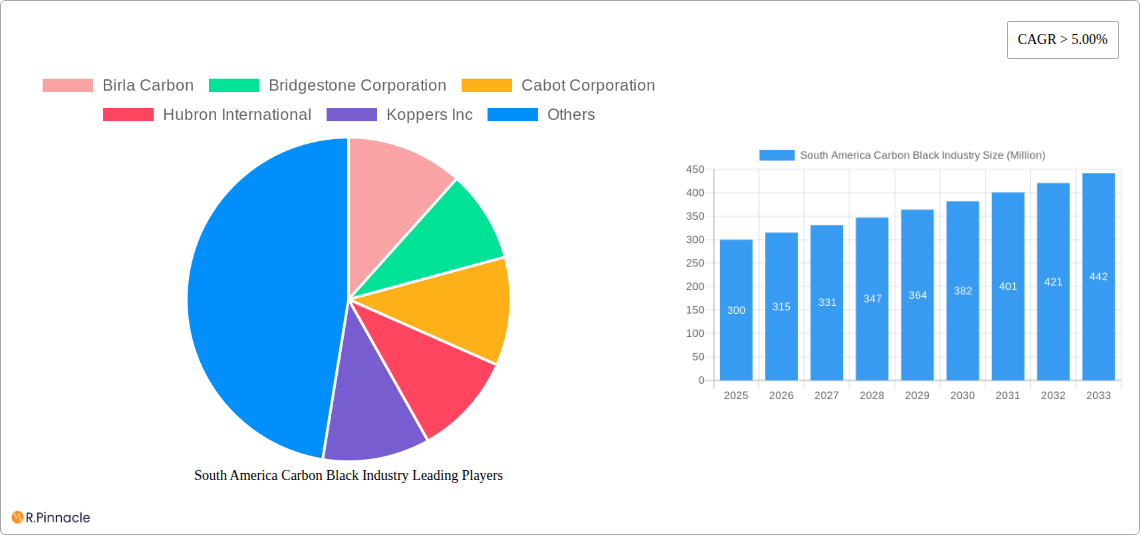
South America Carbon Black Industry Company Market Share
South America Carbon Black Industry Report: 2019-2033
This comprehensive report provides an in-depth analysis of the South America Carbon Black industry, offering valuable insights for industry professionals, investors, and strategic decision-makers. Covering the period from 2019 to 2033, with a base year of 2025 and a forecast period of 2025-2033, this report unveils the market's structure, dynamics, and future potential. Key players such as Birla Carbon, Bridgestone Corporation, Cabot Corporation, Hubron International, Koppers Inc, Mitsubishi Chemical Holdings Corporation, negroven, Orion Engineered Carbons, Phillips Carbon Black Ltd, and Tokai Carbon Co Ltd are analyzed, though the list is not exhaustive.
South America Carbon Black Industry Market Structure & Innovation Trends
This section analyzes the South American carbon black market's competitive landscape, focusing on market concentration, innovation drivers, regulatory frameworks, product substitutes, end-user demographics, and mergers & acquisitions (M&A) activities. We examine the market share held by key players and evaluate the impact of M&A deals valued at over xx Million USD in the historical period (2019-2024). The report assesses the influence of regulatory changes on innovation and explores the emergence of substitute materials impacting market dynamics. Analysis of end-user demographics across various sectors helps paint a picture of the overall market structure and future potential. The influence of government policies, technological advancements, and economic factors are also included. Specific data points illustrating market concentration and M&A activity will be included, such as the market share of the top 5 players in 2024 at approximately xx%.
South America Carbon Black Industry Market Dynamics & Trends
This section delves into the key drivers shaping the South American carbon black market's growth trajectory. We explore the Compound Annual Growth Rate (CAGR) for the forecast period (2025-2033), projecting a xx% CAGR. The analysis encompasses technological disruptions like the adoption of new production methods, evolving consumer preferences in end-use industries, and the competitive landscape, including pricing strategies and market penetration rates of key players. Detailed analysis will cover the impact of economic fluctuations, changing environmental regulations, and import/export dynamics on market growth. Specific examples of technological disruptions and their market impact will be highlighted.
Dominant Regions & Segments in South America Carbon Black Industry
This section identifies the leading regions and segments within the South American carbon black market. We pinpoint the dominant country and segment based on factors like market size, growth potential, and key drivers.
- Key Drivers (e.g., Brazil):
- Strong automotive and tire industries.
- Favorable government policies supporting industrial growth.
- Development of robust infrastructure.
- Growing demand from the construction and packaging sectors.
- Dominance Analysis: A detailed analysis will explore the reasons behind the chosen region/segment's dominance, comparing it to other regions/segments within South America. Factors such as infrastructure investment, access to raw materials, and government regulations will be considered.
South America Carbon Black Industry Product Innovations
This section summarizes recent product developments, applications, and competitive advantages in the South American carbon black market. We highlight technological trends, such as the development of specialized carbon blacks for improved tire performance or enhanced pigment properties, and analyze their market fit and adoption rates. The focus will be on innovation that offers improved performance, sustainability, and cost-effectiveness.
Report Scope & Segmentation Analysis
This report segments the South American carbon black market based on various criteria, including product type (e.g., furnace black, channel black), application (e.g., tires, inks, plastics), and geography. Each segment's market size (in Million USD) for the base year (2025) and growth projections for the forecast period (2025-2033) are provided. Competitive dynamics within each segment are also discussed, including market share and competitive strategies.
Key Drivers of South America Carbon Black Industry Growth
Several factors propel the growth of the South American carbon black industry. These include increasing demand from the automotive and tire industries, driven by rising vehicle sales and infrastructure development. Furthermore, technological advancements resulting in higher-performance carbon blacks and expansion into new applications in areas such as plastics and coatings significantly contribute to growth. Government initiatives promoting industrial growth and economic development also play a vital role in fostering a positive market environment.
Challenges in the South America Carbon Black Industry Sector
The South American carbon black industry faces challenges such as fluctuating raw material prices, environmental regulations impacting production costs and processes, and intense competition from both domestic and international players. Supply chain disruptions due to geopolitical events can also affect market stability. We provide a quantitative analysis of these challenges to illustrate their potential impact on market growth.
Emerging Opportunities in South America Carbon Black Industry
Emerging opportunities exist within the South American carbon black industry, driven by factors such as the growing demand for sustainable and high-performance carbon blacks in diverse applications, and the potential for increased adoption in emerging markets. The expansion of the electric vehicle market will also lead to the development of new specialized carbon blacks for batteries and other related components. Furthermore, the rise of green initiatives and sustainable manufacturing processes could drive demand for eco-friendly carbon black products.
Leading Players in the South America Carbon Black Industry Market
- Birla Carbon
- Bridgestone Corporation
- Cabot Corporation
- Hubron International
- Koppers Inc
- Mitsubishi Chemical Holdings Corporation
- negroven
- Orion Engineered Carbons
- Phillips Carbon Black Ltd
- Tokai Carbon Co Ltd
- List Not Exhaustive
Key Developments in South America Carbon Black Industry Industry
- 2022 Q3: Orion Engineered Carbons announced a significant investment in expanding its South American production capacity.
- 2021 Q4: Birla Carbon launched a new range of sustainable carbon black products.
- 2020 Q1: A merger between two smaller carbon black producers in Brazil consolidated the market share of the larger players.
- (Further developments to be added with specific dates)
Future Outlook for South America Carbon Black Industry Market
The South American carbon black market is poised for robust growth over the forecast period, driven by the expanding automotive and tire industries, increased demand from diverse applications, and ongoing technological innovations. Strategic investments in production capacity, adoption of sustainable manufacturing practices, and focus on developing high-performance products will shape future market dynamics. The market's potential is substantial, with continued growth expected across various segments and geographic locations.
South America Carbon Black Industry Segmentation
-
1. Process Type
- 1.1. Furnace Black
- 1.2. Gas Black
- 1.3. Lamp Black
- 1.4. Thermal Black
-
2. Application
- 2.1. Tires and Industrial Rubber Products
- 2.2. Plastics
- 2.3. Toners and Printing Inks
- 2.4. Coatings
- 2.5. Textile Fibers
- 2.6. Other Applications
-
3. Geography
- 3.1. Brazil
- 3.2. Argentina
- 3.3. Colombia
- 3.4. Chile
- 3.5. Rest of South America
South America Carbon Black Industry Segmentation By Geography
- 1. Brazil
- 2. Argentina
- 3. Colombia
- 4. Chile
- 5. Rest of South America
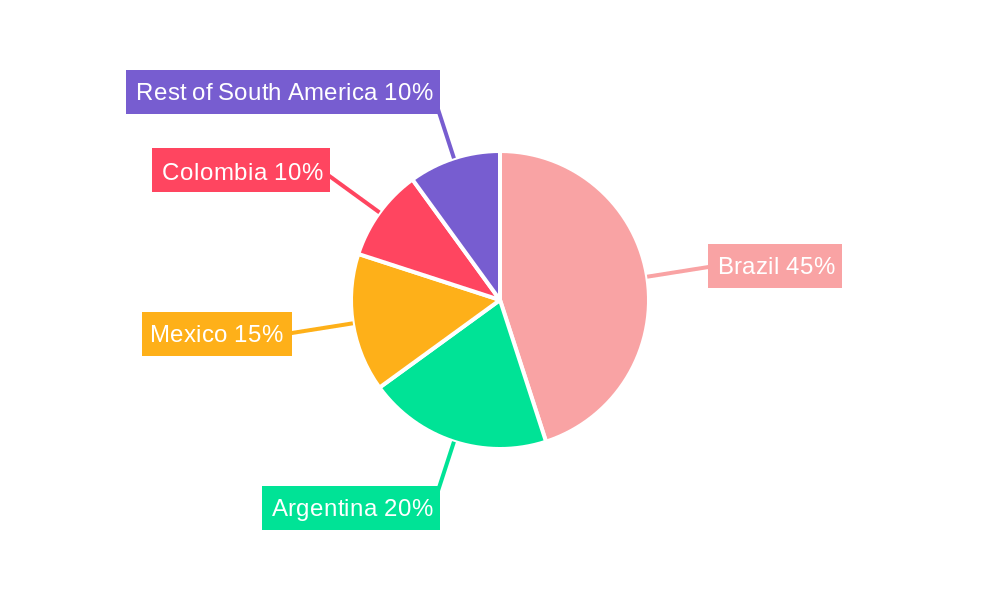
South America Carbon Black Industry Regional Market Share
Geographic Coverage of South America Carbon Black Industry
South America Carbon Black Industry REPORT HIGHLIGHTS
| Aspects | Details |
|---|---|
| Study Period | 2020-2034 |
| Base Year | 2025 |
| Estimated Year | 2026 |
| Forecast Period | 2026-2034 |
| Historical Period | 2020-2025 |
| Growth Rate | CAGR of 6.3% from 2020-2034 |
| Segmentation |
|
Table of Contents
- 1. Introduction
- 1.1. Research Scope
- 1.2. Market Segmentation
- 1.3. Research Objective
- 1.4. Definitions and Assumptions
- 2. Executive Summary
- 2.1. Market Snapshot
- 3. Market Dynamics
- 3.1. Market Drivers
- 3.2. Market Restrains
- 3.3. Market Trends
- 3.4. Market Opportunities
- 4. Market Factor Analysis
- 4.1. Porters Five Forces
- 4.1.1. Bargaining Power of Suppliers
- 4.1.2. Bargaining Power of Buyers
- 4.1.3. Threat of New Entrants
- 4.1.4. Threat of Substitutes
- 4.1.5. Competitive Rivalry
- 4.2. PESTEL analysis
- 4.3. BCG Analysis
- 4.3.1. Stars (High Growth, High Market Share)
- 4.3.2. Cash Cows (Low Growth, High Market Share)
- 4.3.3. Question Mark (High Growth, Low Market Share)
- 4.3.4. Dogs (Low Growth, Low Market Share)
- 4.4. Ansoff Matrix Analysis
- 4.5. Supply Chain Analysis
- 4.6. Regulatory Landscape
- 4.7. Current Market Potential and Opportunity Assessment (TAM–SAM–SOM Framework)
- 4.8. PRI Analyst Note
- 4.1. Porters Five Forces
- 5. Market Analysis, Insights and Forecast 2021-2033
- 5.1. Market Analysis, Insights and Forecast - by Process Type
- 5.1.1. Furnace Black
- 5.1.2. Gas Black
- 5.1.3. Lamp Black
- 5.1.4. Thermal Black
- 5.2. Market Analysis, Insights and Forecast - by Application
- 5.2.1. Tires and Industrial Rubber Products
- 5.2.2. Plastics
- 5.2.3. Toners and Printing Inks
- 5.2.4. Coatings
- 5.2.5. Textile Fibers
- 5.2.6. Other Applications
- 5.3. Market Analysis, Insights and Forecast - by Geography
- 5.3.1. Brazil
- 5.3.2. Argentina
- 5.3.3. Colombia
- 5.3.4. Chile
- 5.3.5. Rest of South America
- 5.4. Market Analysis, Insights and Forecast - by Region
- 5.4.1. Brazil
- 5.4.2. Argentina
- 5.4.3. Colombia
- 5.4.4. Chile
- 5.4.5. Rest of South America
- 5.1. Market Analysis, Insights and Forecast - by Process Type
- 6. Global South America Carbon Black Industry Analysis, Insights and Forecast, 2021-2033
- 6.1. Market Analysis, Insights and Forecast - by Process Type
- 6.1.1. Furnace Black
- 6.1.2. Gas Black
- 6.1.3. Lamp Black
- 6.1.4. Thermal Black
- 6.2. Market Analysis, Insights and Forecast - by Application
- 6.2.1. Tires and Industrial Rubber Products
- 6.2.2. Plastics
- 6.2.3. Toners and Printing Inks
- 6.2.4. Coatings
- 6.2.5. Textile Fibers
- 6.2.6. Other Applications
- 6.3. Market Analysis, Insights and Forecast - by Geography
- 6.3.1. Brazil
- 6.3.2. Argentina
- 6.3.3. Colombia
- 6.3.4. Chile
- 6.3.5. Rest of South America
- 6.1. Market Analysis, Insights and Forecast - by Process Type
- 7. Brazil South America Carbon Black Industry Analysis, Insights and Forecast, 2020-2032
- 7.1. Market Analysis, Insights and Forecast - by Process Type
- 7.1.1. Furnace Black
- 7.1.2. Gas Black
- 7.1.3. Lamp Black
- 7.1.4. Thermal Black
- 7.2. Market Analysis, Insights and Forecast - by Application
- 7.2.1. Tires and Industrial Rubber Products
- 7.2.2. Plastics
- 7.2.3. Toners and Printing Inks
- 7.2.4. Coatings
- 7.2.5. Textile Fibers
- 7.2.6. Other Applications
- 7.3. Market Analysis, Insights and Forecast - by Geography
- 7.3.1. Brazil
- 7.3.2. Argentina
- 7.3.3. Colombia
- 7.3.4. Chile
- 7.3.5. Rest of South America
- 7.1. Market Analysis, Insights and Forecast - by Process Type
- 8. Argentina South America Carbon Black Industry Analysis, Insights and Forecast, 2020-2032
- 8.1. Market Analysis, Insights and Forecast - by Process Type
- 8.1.1. Furnace Black
- 8.1.2. Gas Black
- 8.1.3. Lamp Black
- 8.1.4. Thermal Black
- 8.2. Market Analysis, Insights and Forecast - by Application
- 8.2.1. Tires and Industrial Rubber Products
- 8.2.2. Plastics
- 8.2.3. Toners and Printing Inks
- 8.2.4. Coatings
- 8.2.5. Textile Fibers
- 8.2.6. Other Applications
- 8.3. Market Analysis, Insights and Forecast - by Geography
- 8.3.1. Brazil
- 8.3.2. Argentina
- 8.3.3. Colombia
- 8.3.4. Chile
- 8.3.5. Rest of South America
- 8.1. Market Analysis, Insights and Forecast - by Process Type
- 9. Colombia South America Carbon Black Industry Analysis, Insights and Forecast, 2020-2032
- 9.1. Market Analysis, Insights and Forecast - by Process Type
- 9.1.1. Furnace Black
- 9.1.2. Gas Black
- 9.1.3. Lamp Black
- 9.1.4. Thermal Black
- 9.2. Market Analysis, Insights and Forecast - by Application
- 9.2.1. Tires and Industrial Rubber Products
- 9.2.2. Plastics
- 9.2.3. Toners and Printing Inks
- 9.2.4. Coatings
- 9.2.5. Textile Fibers
- 9.2.6. Other Applications
- 9.3. Market Analysis, Insights and Forecast - by Geography
- 9.3.1. Brazil
- 9.3.2. Argentina
- 9.3.3. Colombia
- 9.3.4. Chile
- 9.3.5. Rest of South America
- 9.1. Market Analysis, Insights and Forecast - by Process Type
- 10. Chile South America Carbon Black Industry Analysis, Insights and Forecast, 2020-2032
- 10.1. Market Analysis, Insights and Forecast - by Process Type
- 10.1.1. Furnace Black
- 10.1.2. Gas Black
- 10.1.3. Lamp Black
- 10.1.4. Thermal Black
- 10.2. Market Analysis, Insights and Forecast - by Application
- 10.2.1. Tires and Industrial Rubber Products
- 10.2.2. Plastics
- 10.2.3. Toners and Printing Inks
- 10.2.4. Coatings
- 10.2.5. Textile Fibers
- 10.2.6. Other Applications
- 10.3. Market Analysis, Insights and Forecast - by Geography
- 10.3.1. Brazil
- 10.3.2. Argentina
- 10.3.3. Colombia
- 10.3.4. Chile
- 10.3.5. Rest of South America
- 10.1. Market Analysis, Insights and Forecast - by Process Type
- 11. Rest of South America South America Carbon Black Industry Analysis, Insights and Forecast, 2020-2032
- 11.1. Market Analysis, Insights and Forecast - by Process Type
- 11.1.1. Furnace Black
- 11.1.2. Gas Black
- 11.1.3. Lamp Black
- 11.1.4. Thermal Black
- 11.2. Market Analysis, Insights and Forecast - by Application
- 11.2.1. Tires and Industrial Rubber Products
- 11.2.2. Plastics
- 11.2.3. Toners and Printing Inks
- 11.2.4. Coatings
- 11.2.5. Textile Fibers
- 11.2.6. Other Applications
- 11.3. Market Analysis, Insights and Forecast - by Geography
- 11.3.1. Brazil
- 11.3.2. Argentina
- 11.3.3. Colombia
- 11.3.4. Chile
- 11.3.5. Rest of South America
- 11.1. Market Analysis, Insights and Forecast - by Process Type
- 12. Competitive Analysis
- 12.1. Company Profiles
- 12.1.1 Birla Carbon
- 12.1.1.1. Company Overview
- 12.1.1.2. Products
- 12.1.1.3. Company Financials
- 12.1.1.4. SWOT Analysis
- 12.1.2 Bridgestone Corporation
- 12.1.2.1. Company Overview
- 12.1.2.2. Products
- 12.1.2.3. Company Financials
- 12.1.2.4. SWOT Analysis
- 12.1.3 Cabot Corporation
- 12.1.3.1. Company Overview
- 12.1.3.2. Products
- 12.1.3.3. Company Financials
- 12.1.3.4. SWOT Analysis
- 12.1.4 Hubron International
- 12.1.4.1. Company Overview
- 12.1.4.2. Products
- 12.1.4.3. Company Financials
- 12.1.4.4. SWOT Analysis
- 12.1.5 Koppers Inc
- 12.1.5.1. Company Overview
- 12.1.5.2. Products
- 12.1.5.3. Company Financials
- 12.1.5.4. SWOT Analysis
- 12.1.6 Mitsubishi Chemical Holdings Corporation
- 12.1.6.1. Company Overview
- 12.1.6.2. Products
- 12.1.6.3. Company Financials
- 12.1.6.4. SWOT Analysis
- 12.1.7 negroven
- 12.1.7.1. Company Overview
- 12.1.7.2. Products
- 12.1.7.3. Company Financials
- 12.1.7.4. SWOT Analysis
- 12.1.8 Orion Engineered Carbons
- 12.1.8.1. Company Overview
- 12.1.8.2. Products
- 12.1.8.3. Company Financials
- 12.1.8.4. SWOT Analysis
- 12.1.9 Phillips Carbon Black Ltd
- 12.1.9.1. Company Overview
- 12.1.9.2. Products
- 12.1.9.3. Company Financials
- 12.1.9.4. SWOT Analysis
- 12.1.10 Tokai Carbon Co Ltd*List Not Exhaustive
- 12.1.10.1. Company Overview
- 12.1.10.2. Products
- 12.1.10.3. Company Financials
- 12.1.10.4. SWOT Analysis
- 12.1.1 Birla Carbon
- 12.2. Market Entropy
- 12.2.1 Company's Key Areas Served
- 12.2.2 Recent Developments
- 12.3. Company Market Share Analysis 2025
- 12.3.1 Top 5 Companies Market Share Analysis
- 12.3.2 Top 3 Companies Market Share Analysis
- 12.4. List of Potential Customers
- 13. Research Methodology
List of Figures
- Figure 1: Global South America Carbon Black Industry Revenue Breakdown (billion, %) by Region 2025 & 2033
- Figure 2: Brazil South America Carbon Black Industry Revenue (billion), by Process Type 2025 & 2033
- Figure 3: Brazil South America Carbon Black Industry Revenue Share (%), by Process Type 2025 & 2033
- Figure 4: Brazil South America Carbon Black Industry Revenue (billion), by Application 2025 & 2033
- Figure 5: Brazil South America Carbon Black Industry Revenue Share (%), by Application 2025 & 2033
- Figure 6: Brazil South America Carbon Black Industry Revenue (billion), by Geography 2025 & 2033
- Figure 7: Brazil South America Carbon Black Industry Revenue Share (%), by Geography 2025 & 2033
- Figure 8: Brazil South America Carbon Black Industry Revenue (billion), by Country 2025 & 2033
- Figure 9: Brazil South America Carbon Black Industry Revenue Share (%), by Country 2025 & 2033
- Figure 10: Argentina South America Carbon Black Industry Revenue (billion), by Process Type 2025 & 2033
- Figure 11: Argentina South America Carbon Black Industry Revenue Share (%), by Process Type 2025 & 2033
- Figure 12: Argentina South America Carbon Black Industry Revenue (billion), by Application 2025 & 2033
- Figure 13: Argentina South America Carbon Black Industry Revenue Share (%), by Application 2025 & 2033
- Figure 14: Argentina South America Carbon Black Industry Revenue (billion), by Geography 2025 & 2033
- Figure 15: Argentina South America Carbon Black Industry Revenue Share (%), by Geography 2025 & 2033
- Figure 16: Argentina South America Carbon Black Industry Revenue (billion), by Country 2025 & 2033
- Figure 17: Argentina South America Carbon Black Industry Revenue Share (%), by Country 2025 & 2033
- Figure 18: Colombia South America Carbon Black Industry Revenue (billion), by Process Type 2025 & 2033
- Figure 19: Colombia South America Carbon Black Industry Revenue Share (%), by Process Type 2025 & 2033
- Figure 20: Colombia South America Carbon Black Industry Revenue (billion), by Application 2025 & 2033
- Figure 21: Colombia South America Carbon Black Industry Revenue Share (%), by Application 2025 & 2033
- Figure 22: Colombia South America Carbon Black Industry Revenue (billion), by Geography 2025 & 2033
- Figure 23: Colombia South America Carbon Black Industry Revenue Share (%), by Geography 2025 & 2033
- Figure 24: Colombia South America Carbon Black Industry Revenue (billion), by Country 2025 & 2033
- Figure 25: Colombia South America Carbon Black Industry Revenue Share (%), by Country 2025 & 2033
- Figure 26: Chile South America Carbon Black Industry Revenue (billion), by Process Type 2025 & 2033
- Figure 27: Chile South America Carbon Black Industry Revenue Share (%), by Process Type 2025 & 2033
- Figure 28: Chile South America Carbon Black Industry Revenue (billion), by Application 2025 & 2033
- Figure 29: Chile South America Carbon Black Industry Revenue Share (%), by Application 2025 & 2033
- Figure 30: Chile South America Carbon Black Industry Revenue (billion), by Geography 2025 & 2033
- Figure 31: Chile South America Carbon Black Industry Revenue Share (%), by Geography 2025 & 2033
- Figure 32: Chile South America Carbon Black Industry Revenue (billion), by Country 2025 & 2033
- Figure 33: Chile South America Carbon Black Industry Revenue Share (%), by Country 2025 & 2033
- Figure 34: Rest of South America South America Carbon Black Industry Revenue (billion), by Process Type 2025 & 2033
- Figure 35: Rest of South America South America Carbon Black Industry Revenue Share (%), by Process Type 2025 & 2033
- Figure 36: Rest of South America South America Carbon Black Industry Revenue (billion), by Application 2025 & 2033
- Figure 37: Rest of South America South America Carbon Black Industry Revenue Share (%), by Application 2025 & 2033
- Figure 38: Rest of South America South America Carbon Black Industry Revenue (billion), by Geography 2025 & 2033
- Figure 39: Rest of South America South America Carbon Black Industry Revenue Share (%), by Geography 2025 & 2033
- Figure 40: Rest of South America South America Carbon Black Industry Revenue (billion), by Country 2025 & 2033
- Figure 41: Rest of South America South America Carbon Black Industry Revenue Share (%), by Country 2025 & 2033
List of Tables
- Table 1: Global South America Carbon Black Industry Revenue billion Forecast, by Process Type 2020 & 2033
- Table 2: Global South America Carbon Black Industry Revenue billion Forecast, by Application 2020 & 2033
- Table 3: Global South America Carbon Black Industry Revenue billion Forecast, by Geography 2020 & 2033
- Table 4: Global South America Carbon Black Industry Revenue billion Forecast, by Region 2020 & 2033
- Table 5: Global South America Carbon Black Industry Revenue billion Forecast, by Process Type 2020 & 2033
- Table 6: Global South America Carbon Black Industry Revenue billion Forecast, by Application 2020 & 2033
- Table 7: Global South America Carbon Black Industry Revenue billion Forecast, by Geography 2020 & 2033
- Table 8: Global South America Carbon Black Industry Revenue billion Forecast, by Country 2020 & 2033
- Table 9: Global South America Carbon Black Industry Revenue billion Forecast, by Process Type 2020 & 2033
- Table 10: Global South America Carbon Black Industry Revenue billion Forecast, by Application 2020 & 2033
- Table 11: Global South America Carbon Black Industry Revenue billion Forecast, by Geography 2020 & 2033
- Table 12: Global South America Carbon Black Industry Revenue billion Forecast, by Country 2020 & 2033
- Table 13: Global South America Carbon Black Industry Revenue billion Forecast, by Process Type 2020 & 2033
- Table 14: Global South America Carbon Black Industry Revenue billion Forecast, by Application 2020 & 2033
- Table 15: Global South America Carbon Black Industry Revenue billion Forecast, by Geography 2020 & 2033
- Table 16: Global South America Carbon Black Industry Revenue billion Forecast, by Country 2020 & 2033
- Table 17: Global South America Carbon Black Industry Revenue billion Forecast, by Process Type 2020 & 2033
- Table 18: Global South America Carbon Black Industry Revenue billion Forecast, by Application 2020 & 2033
- Table 19: Global South America Carbon Black Industry Revenue billion Forecast, by Geography 2020 & 2033
- Table 20: Global South America Carbon Black Industry Revenue billion Forecast, by Country 2020 & 2033
- Table 21: Global South America Carbon Black Industry Revenue billion Forecast, by Process Type 2020 & 2033
- Table 22: Global South America Carbon Black Industry Revenue billion Forecast, by Application 2020 & 2033
- Table 23: Global South America Carbon Black Industry Revenue billion Forecast, by Geography 2020 & 2033
- Table 24: Global South America Carbon Black Industry Revenue billion Forecast, by Country 2020 & 2033
Frequently Asked Questions
1. What is the projected Compound Annual Growth Rate (CAGR) of the South America Carbon Black Industry?
The projected CAGR is approximately 6.3%.
2. Which companies are prominent players in the South America Carbon Black Industry?
Key companies in the market include Birla Carbon, Bridgestone Corporation, Cabot Corporation, Hubron International, Koppers Inc, Mitsubishi Chemical Holdings Corporation, negroven, Orion Engineered Carbons, Phillips Carbon Black Ltd, Tokai Carbon Co Ltd*List Not Exhaustive.
3. What are the main segments of the South America Carbon Black Industry?
The market segments include Process Type, Application, Geography.
4. Can you provide details about the market size?
The market size is estimated to be USD 21.6 billion as of 2022.
5. What are some drivers contributing to market growth?
; Increasing Market Penetration of Specialty Black; Other Drivers.
6. What are the notable trends driving market growth?
Increasing Application for Tires and Industrial Rubber Products.
7. Are there any restraints impacting market growth?
; Increasing Market Penetration of Specialty Black; Other Drivers.
8. Can you provide examples of recent developments in the market?
N/A
9. What pricing options are available for accessing the report?
Pricing options include single-user, multi-user, and enterprise licenses priced at USD 4750, USD 5250, and USD 8750 respectively.
10. Is the market size provided in terms of value or volume?
The market size is provided in terms of value, measured in billion.
11. Are there any specific market keywords associated with the report?
Yes, the market keyword associated with the report is "South America Carbon Black Industry," which aids in identifying and referencing the specific market segment covered.
12. How do I determine which pricing option suits my needs best?
The pricing options vary based on user requirements and access needs. Individual users may opt for single-user licenses, while businesses requiring broader access may choose multi-user or enterprise licenses for cost-effective access to the report.
13. Are there any additional resources or data provided in the South America Carbon Black Industry report?
While the report offers comprehensive insights, it's advisable to review the specific contents or supplementary materials provided to ascertain if additional resources or data are available.
14. How can I stay updated on further developments or reports in the South America Carbon Black Industry?
To stay informed about further developments, trends, and reports in the South America Carbon Black Industry, consider subscribing to industry newsletters, following relevant companies and organizations, or regularly checking reputable industry news sources and publications.
Methodology
Step 1 - Identification of Relevant Samples Size from Population Database


Step 2 - Approaches for Defining Global Market Size (Value, Volume* & Price*)

Note*: In applicable scenarios
Step 3 - Data Sources
Primary Research
- Web Analytics
- Survey Reports
- Research Institute
- Latest Research Reports
- Opinion Leaders
Secondary Research
- Annual Reports
- White Paper
- Latest Press Release
- Industry Association
- Paid Database
- Investor Presentations

Step 4 - Data Triangulation
Involves using different sources of information in order to increase the validity of a study
These sources are likely to be stakeholders in a program - participants, other researchers, program staff, other community members, and so on.
Then we put all data in single framework & apply various statistical tools to find out the dynamic on the market.
During the analysis stage, feedback from the stakeholder groups would be compared to determine areas of agreement as well as areas of divergence