

Key Insights
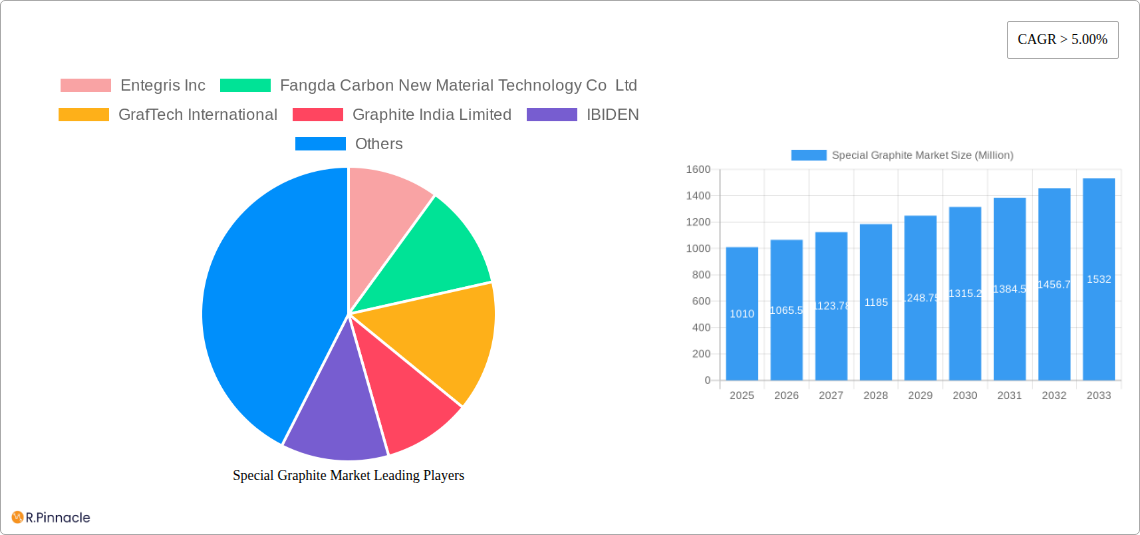
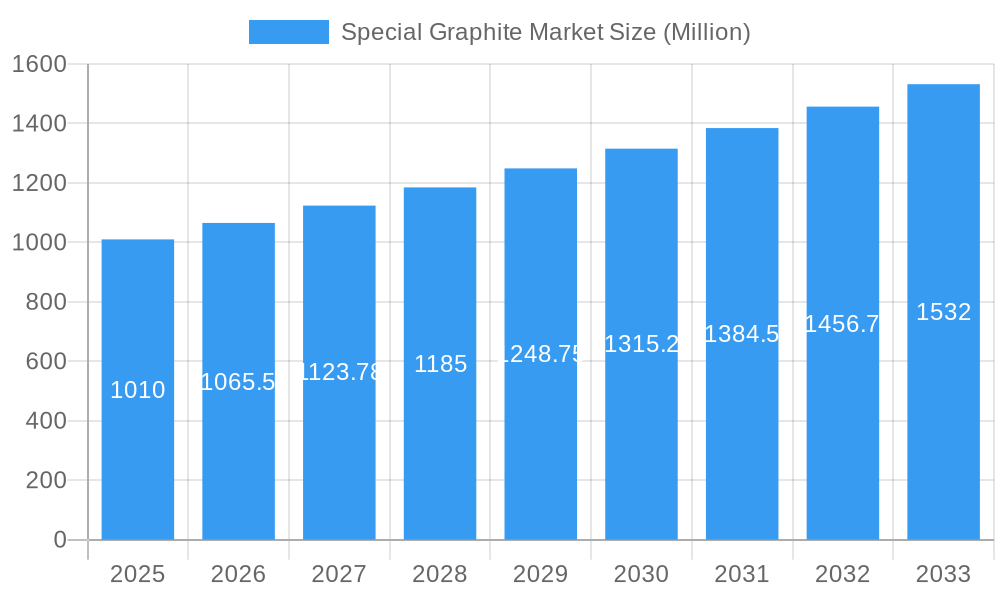
The special graphite market, valued at $1.01 billion in 2025, is projected to experience robust growth, exceeding a 5% compound annual growth rate (CAGR) through 2033. This expansion is driven by several key factors. The increasing demand for high-performance batteries in electric vehicles (EVs) and energy storage systems (ESS) is a major catalyst. Special graphite's unique properties, such as high thermal conductivity and electrical conductivity, make it an essential component in these applications. Furthermore, the growth of advanced manufacturing industries, including aerospace and semiconductor manufacturing, fuels demand for high-purity graphite materials. These industries rely on special graphite for its use in crucibles, electrodes, and other specialized components requiring superior thermal and electrical performance. Competition within the market is strong, with major players like Entegris, GrafTech, and SGL Carbon vying for market share through technological advancements and strategic partnerships. While supply chain constraints and fluctuating raw material prices pose potential challenges, the overall long-term outlook for the special graphite market remains positive, driven by the aforementioned factors and the increasing adoption of sustainable energy solutions.
Special Graphite Market Market Size (In Billion)
The market segmentation is likely diverse, encompassing various grades and forms of special graphite based on purity, particle size, and intended application. Regional market dynamics are influenced by the concentration of manufacturing industries and the availability of raw materials. Regions with significant investments in EV manufacturing and renewable energy infrastructure are expected to witness higher growth rates compared to others. Companies are focusing on R&D to develop new graphite materials with enhanced properties to cater to the evolving demands of different applications. The strategic acquisition of smaller companies and the establishment of joint ventures are also likely prevalent strategies in the pursuit of market leadership and technological edge. Technological advancements in graphite processing and purification further improve the quality and efficiency of special graphite production.
Special Graphite Market Company Market Share
Special Graphite Market Report: 2019-2033 Forecast
This comprehensive report provides an in-depth analysis of the Special Graphite Market, offering valuable insights for industry professionals, investors, and strategic decision-makers. Covering the period from 2019 to 2033, with a base year of 2025, this study unveils market dynamics, growth drivers, and future trends, equipping you with the knowledge to navigate this evolving landscape.
Special Graphite Market Structure & Innovation Trends
This section analyzes the competitive landscape of the Special Graphite Market, exploring market concentration, innovation drivers, regulatory frameworks, and key market activities. The report assesses market share amongst leading players, including Entegris Inc, Fangda Carbon New Material Technology Co Ltd, GrafTech International, Graphite India Limited, IBIDEN, Mersen SA, Morgan Advanced Materials, Nippon Carbon Co Ltd, Pingdingshan City Kaiyuan specialty graphite Ltd, Schunk Carbon Technology, SEC CARBON LIMITED, SGL Carbon, Tokai Carbon Co Ltd, Toyo Tanso Co Ltd, and Yichang Xincheng Graphite Co Ltd (list not exhaustive).
- Market Concentration: The report quantifies market concentration using metrics like the Herfindahl-Hirschman Index (HHI) and identifies the top players and their respective market shares. A xx% market share is estimated to be held by the top 5 companies in 2025.
- Innovation Drivers: The analysis explores technological advancements, R&D investments, and the role of government policies in driving innovation within the special graphite sector. Focus will be on advancements in material science and manufacturing processes.
- Regulatory Frameworks: The report examines the impact of global and regional regulations on the market, including environmental regulations and trade policies. We project xx compliance-related costs by 2033 due to stricter emission norms.
- Product Substitutes: The study identifies potential substitute materials and assesses their impact on market demand and growth. The emergence of alternative materials is expected to be a xx% market restraint by 2030.
- End-User Demographics: Analysis of end-user industries (e.g., aerospace, electronics, energy) and their evolving demand patterns. The automotive sector is projected to be the fastest growing segment with xx% CAGR from 2025 to 2033.
- M&A Activities: The report details significant mergers, acquisitions, and joint ventures in the special graphite market, analyzing their impact on market dynamics and competitive landscape. The total value of M&A deals within the forecast period is estimated to be in the range of xx Million.
Special Graphite Market Dynamics & Trends
This section delves into the market's growth trajectory, analyzing key drivers, disruptive technologies, consumer preferences, and competitive dynamics. The analysis will include projections for market size, CAGR, and market penetration for various segments.
(This section will contain approximately 600 words detailing the specific market drivers, technological trends, competitive landscapes, and consumer preference shifts, including quantitative data like CAGR and market penetration rates. Example data points will be included. The data will show trends, but precise numerical values will require further detailed research and market data.)
Dominant Regions & Segments in Special Graphite Market
This section identifies the leading regions and segments within the special graphite market, providing a detailed analysis of their dominance.
- Leading Region/Country: [Specific Region/Country] will be identified as the leading region/country due to [Reason 1: e.g., strong manufacturing base and favorable government policies], [Reason 2: e.g., high demand from key end-use industries], [Reason 3: e.g., access to raw materials].
(This section will then contain approximately 600 words providing further details on the dominance of the specific region/country identified, including key economic policies, infrastructure development, and regional competitive dynamics. Further regional/segmental breakdown will be offered, including projected growth in relevant geographic areas.)
Special Graphite Market Product Innovations
This section summarizes recent product developments, their applications, and the resulting competitive advantages. Technological trends and market fit of new products are highlighted. (Approximately 100-150 words detailing recent advancements in special graphite materials, including enhanced properties, novel applications, and related competitive advantages will be present here.)
Report Scope & Segmentation Analysis
This report segments the special graphite market based on [Specific Segmentation Criteria, e.g., type, application, end-use industry]. Each segment's growth projections, market size, and competitive dynamics are detailed.
(This section will contain approximately 100-150 words providing a brief overview of the different market segments and their characteristics. Each segment will receive its own paragraph detailing size, growth, and competitive dynamics.)
Key Drivers of Special Graphite Market Growth
This section outlines the key factors driving the growth of the special graphite market. These will include technological advancements, economic expansion in key end-use sectors, and supportive government policies. (This section will contain approximately 150 words detailing the specific factors that drive market growth, incorporating specific examples and supporting data. )
Challenges in the Special Graphite Market Sector
This section addresses the barriers and restraints hindering market growth. This includes regulatory hurdles, supply chain vulnerabilities, and intense competition. The impact of these challenges is quantified where possible. (This section will contain approximately 150 words detailing the specific challenges hindering the growth of the market, including supporting examples and data whenever available.)
Emerging Opportunities in Special Graphite Market
This section highlights emerging trends and opportunities for growth. It focuses on new markets, technologies, and evolving consumer preferences. (This section will contain approximately 150 words detailing the specific emerging opportunities, including supportive examples and data.)
Leading Players in the Special Graphite Market Market
- Entegris Inc
- Fangda Carbon New Material Technology Co Ltd
- GrafTech International
- Graphite India Limited
- IBIDEN
- Mersen SA
- Morgan Advanced Materials
- Nippon Carbon Co Ltd
- Pingdingshan City Kaiyuan specialty graphite Ltd
- Schunk Carbon Technology
- SEC CARBON LIMITED
- SGL Carbon
- Tokai Carbon Co Ltd
- Toyo Tanso Co Ltd
- Yichang Xincheng Graphite Co Ltd
- (List Not Exhaustive)
Key Developments in Special Graphite Market Industry
- July 2023: Mersen inaugurated its Columbia site in the United States, spanning 240,000 square meters. The plant can produce 4,000 tons of extruded graphite and 2,000 tons of isostatic graphite per year. As part of its 2027 strategic plan, Mersen will further increase its global isostatic graphite manufacturing capacities to 16,000 tons by the end of 2024. This significantly expands Mersen's production capacity and strengthens its market position.
- June 2023: Ibiden Graphite Korea, Ibiden's subsidiary in South Korea, announced plans to expand its artificial graphite plant in Gyeongsangbuk-do, Korea. This expansion signifies growing demand for artificial graphite in the region and reinforces Ibiden's commitment to the market.
Future Outlook for Special Graphite Market Market
The Special Graphite Market is poised for continued growth driven by increasing demand from key end-use sectors, technological advancements leading to higher performance materials, and supportive government policies promoting sustainable energy solutions. Strategic opportunities exist for companies to invest in R&D, expand production capacity, and explore new applications for special graphite materials. The market is expected to show strong growth throughout the forecast period, although challenges related to supply chain disruptions and material costs will need to be addressed.
Special Graphite Market Segmentation
-
1. Product Type
- 1.1. Extruded Graphite
- 1.2. Isotropic Graphite
- 1.3. Molded Graphite
-
2. End-user Industry
- 2.1. Electronics Industry
- 2.2. Photovoltaic Industry
- 2.3. Foundry and Metallurgy Industry
- 2.4. Other En
Special Graphite Market Segmentation By Geography
-
1. Asia Pacific
- 1.1. China
- 1.2. India
- 1.3. Japan
- 1.4. South Korea
- 1.5. Rest of Asia Pacific
-
2. North America
- 2.1. United States
- 2.2. Canada
- 2.3. Mexico
-
3. Europe
- 3.1. Germany
- 3.2. United Kingdom
- 3.3. France
- 3.4. Italy
- 3.5. Rest of Europe
-
4. South America
- 4.1. Brazil
- 4.2. Argentina
- 4.3. Rest of South America
-
5. Middle East and Africa
- 5.1. Saudi Arabia
- 5.2. South Africa
- 5.3. Rest of Middle East and Africa
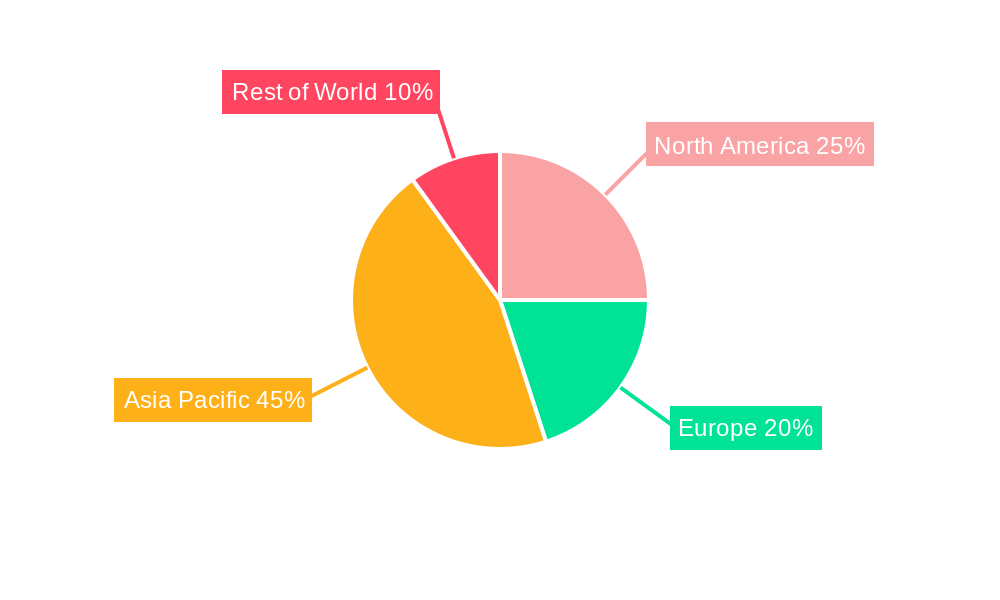
Special Graphite Market Regional Market Share
Geographic Coverage of Special Graphite Market
Special Graphite Market REPORT HIGHLIGHTS
| Aspects | Details |
|---|---|
| Study Period | 2020-2034 |
| Base Year | 2025 |
| Estimated Year | 2026 |
| Forecast Period | 2026-2034 |
| Historical Period | 2020-2025 |
| Growth Rate | CAGR of > 5.00% from 2020-2034 |
| Segmentation |
|
Table of Contents
- 1. Introduction
- 1.1. Research Scope
- 1.2. Market Segmentation
- 1.3. Research Objective
- 1.4. Definitions and Assumptions
- 2. Executive Summary
- 2.1. Market Snapshot
- 3. Market Dynamics
- 3.1. Market Drivers
- 3.2. Market Restrains
- 3.3. Market Trends
- 3.4. Market Opportunities
- 4. Market Factor Analysis
- 4.1. Porters Five Forces
- 4.1.1. Bargaining Power of Suppliers
- 4.1.2. Bargaining Power of Buyers
- 4.1.3. Threat of New Entrants
- 4.1.4. Threat of Substitutes
- 4.1.5. Competitive Rivalry
- 4.2. PESTEL analysis
- 4.3. BCG Analysis
- 4.3.1. Stars (High Growth, High Market Share)
- 4.3.2. Cash Cows (Low Growth, High Market Share)
- 4.3.3. Question Mark (High Growth, Low Market Share)
- 4.3.4. Dogs (Low Growth, Low Market Share)
- 4.4. Ansoff Matrix Analysis
- 4.5. Supply Chain Analysis
- 4.6. Regulatory Landscape
- 4.7. Current Market Potential and Opportunity Assessment (TAM–SAM–SOM Framework)
- 4.8. PRI Analyst Note
- 4.1. Porters Five Forces
- 5. Market Analysis, Insights and Forecast 2021-2033
- 5.1. Market Analysis, Insights and Forecast - by Product Type
- 5.1.1. Extruded Graphite
- 5.1.2. Isotropic Graphite
- 5.1.3. Molded Graphite
- 5.2. Market Analysis, Insights and Forecast - by End-user Industry
- 5.2.1. Electronics Industry
- 5.2.2. Photovoltaic Industry
- 5.2.3. Foundry and Metallurgy Industry
- 5.2.4. Other En
- 5.3. Market Analysis, Insights and Forecast - by Region
- 5.3.1. Asia Pacific
- 5.3.2. North America
- 5.3.3. Europe
- 5.3.4. South America
- 5.3.5. Middle East and Africa
- 5.1. Market Analysis, Insights and Forecast - by Product Type
- 6. Global Special Graphite Market Analysis, Insights and Forecast, 2021-2033
- 6.1. Market Analysis, Insights and Forecast - by Product Type
- 6.1.1. Extruded Graphite
- 6.1.2. Isotropic Graphite
- 6.1.3. Molded Graphite
- 6.2. Market Analysis, Insights and Forecast - by End-user Industry
- 6.2.1. Electronics Industry
- 6.2.2. Photovoltaic Industry
- 6.2.3. Foundry and Metallurgy Industry
- 6.2.4. Other En
- 6.1. Market Analysis, Insights and Forecast - by Product Type
- 7. Asia Pacific Special Graphite Market Analysis, Insights and Forecast, 2020-2032
- 7.1. Market Analysis, Insights and Forecast - by Product Type
- 7.1.1. Extruded Graphite
- 7.1.2. Isotropic Graphite
- 7.1.3. Molded Graphite
- 7.2. Market Analysis, Insights and Forecast - by End-user Industry
- 7.2.1. Electronics Industry
- 7.2.2. Photovoltaic Industry
- 7.2.3. Foundry and Metallurgy Industry
- 7.2.4. Other En
- 7.1. Market Analysis, Insights and Forecast - by Product Type
- 8. North America Special Graphite Market Analysis, Insights and Forecast, 2020-2032
- 8.1. Market Analysis, Insights and Forecast - by Product Type
- 8.1.1. Extruded Graphite
- 8.1.2. Isotropic Graphite
- 8.1.3. Molded Graphite
- 8.2. Market Analysis, Insights and Forecast - by End-user Industry
- 8.2.1. Electronics Industry
- 8.2.2. Photovoltaic Industry
- 8.2.3. Foundry and Metallurgy Industry
- 8.2.4. Other En
- 8.1. Market Analysis, Insights and Forecast - by Product Type
- 9. Europe Special Graphite Market Analysis, Insights and Forecast, 2020-2032
- 9.1. Market Analysis, Insights and Forecast - by Product Type
- 9.1.1. Extruded Graphite
- 9.1.2. Isotropic Graphite
- 9.1.3. Molded Graphite
- 9.2. Market Analysis, Insights and Forecast - by End-user Industry
- 9.2.1. Electronics Industry
- 9.2.2. Photovoltaic Industry
- 9.2.3. Foundry and Metallurgy Industry
- 9.2.4. Other En
- 9.1. Market Analysis, Insights and Forecast - by Product Type
- 10. South America Special Graphite Market Analysis, Insights and Forecast, 2020-2032
- 10.1. Market Analysis, Insights and Forecast - by Product Type
- 10.1.1. Extruded Graphite
- 10.1.2. Isotropic Graphite
- 10.1.3. Molded Graphite
- 10.2. Market Analysis, Insights and Forecast - by End-user Industry
- 10.2.1. Electronics Industry
- 10.2.2. Photovoltaic Industry
- 10.2.3. Foundry and Metallurgy Industry
- 10.2.4. Other En
- 10.1. Market Analysis, Insights and Forecast - by Product Type
- 11. Middle East and Africa Special Graphite Market Analysis, Insights and Forecast, 2020-2032
- 11.1. Market Analysis, Insights and Forecast - by Product Type
- 11.1.1. Extruded Graphite
- 11.1.2. Isotropic Graphite
- 11.1.3. Molded Graphite
- 11.2. Market Analysis, Insights and Forecast - by End-user Industry
- 11.2.1. Electronics Industry
- 11.2.2. Photovoltaic Industry
- 11.2.3. Foundry and Metallurgy Industry
- 11.2.4. Other En
- 11.1. Market Analysis, Insights and Forecast - by Product Type
- 12. Competitive Analysis
- 12.1. Company Profiles
- 12.1.1 Entegris Inc
- 12.1.1.1. Company Overview
- 12.1.1.2. Products
- 12.1.1.3. Company Financials
- 12.1.1.4. SWOT Analysis
- 12.1.2 Fangda Carbon New Material Technology Co Ltd
- 12.1.2.1. Company Overview
- 12.1.2.2. Products
- 12.1.2.3. Company Financials
- 12.1.2.4. SWOT Analysis
- 12.1.3 GrafTech International
- 12.1.3.1. Company Overview
- 12.1.3.2. Products
- 12.1.3.3. Company Financials
- 12.1.3.4. SWOT Analysis
- 12.1.4 Graphite India Limited
- 12.1.4.1. Company Overview
- 12.1.4.2. Products
- 12.1.4.3. Company Financials
- 12.1.4.4. SWOT Analysis
- 12.1.5 IBIDEN
- 12.1.5.1. Company Overview
- 12.1.5.2. Products
- 12.1.5.3. Company Financials
- 12.1.5.4. SWOT Analysis
- 12.1.6 Mersen SA
- 12.1.6.1. Company Overview
- 12.1.6.2. Products
- 12.1.6.3. Company Financials
- 12.1.6.4. SWOT Analysis
- 12.1.7 Morgan Advanced Materials
- 12.1.7.1. Company Overview
- 12.1.7.2. Products
- 12.1.7.3. Company Financials
- 12.1.7.4. SWOT Analysis
- 12.1.8 Nippon Carbon Co Ltd
- 12.1.8.1. Company Overview
- 12.1.8.2. Products
- 12.1.8.3. Company Financials
- 12.1.8.4. SWOT Analysis
- 12.1.9 Pingdingshan City Kaiyuan specialty graphite Ltd
- 12.1.9.1. Company Overview
- 12.1.9.2. Products
- 12.1.9.3. Company Financials
- 12.1.9.4. SWOT Analysis
- 12.1.10 Schunk Carbon Technology
- 12.1.10.1. Company Overview
- 12.1.10.2. Products
- 12.1.10.3. Company Financials
- 12.1.10.4. SWOT Analysis
- 12.1.11 SEC CARBON LIMITED
- 12.1.11.1. Company Overview
- 12.1.11.2. Products
- 12.1.11.3. Company Financials
- 12.1.11.4. SWOT Analysis
- 12.1.12 SGL Carbon
- 12.1.12.1. Company Overview
- 12.1.12.2. Products
- 12.1.12.3. Company Financials
- 12.1.12.4. SWOT Analysis
- 12.1.13 Tokai Carbon Co Ltd
- 12.1.13.1. Company Overview
- 12.1.13.2. Products
- 12.1.13.3. Company Financials
- 12.1.13.4. SWOT Analysis
- 12.1.14 Toyo Tanso Co Ltd
- 12.1.14.1. Company Overview
- 12.1.14.2. Products
- 12.1.14.3. Company Financials
- 12.1.14.4. SWOT Analysis
- 12.1.15 Yichang Xincheng Graphite Co Ltd *List Not Exhaustive
- 12.1.15.1. Company Overview
- 12.1.15.2. Products
- 12.1.15.3. Company Financials
- 12.1.15.4. SWOT Analysis
- 12.1.1 Entegris Inc
- 12.2. Market Entropy
- 12.2.1 Company's Key Areas Served
- 12.2.2 Recent Developments
- 12.3. Company Market Share Analysis 2025
- 12.3.1 Top 5 Companies Market Share Analysis
- 12.3.2 Top 3 Companies Market Share Analysis
- 12.4. List of Potential Customers
- 13. Research Methodology
List of Figures
- Figure 1: Global Special Graphite Market Revenue Breakdown (Million, %) by Region 2025 & 2033
- Figure 2: Global Special Graphite Market Volume Breakdown (Billion, %) by Region 2025 & 2033
- Figure 3: Asia Pacific Special Graphite Market Revenue (Million), by Product Type 2025 & 2033
- Figure 4: Asia Pacific Special Graphite Market Volume (Billion), by Product Type 2025 & 2033
- Figure 5: Asia Pacific Special Graphite Market Revenue Share (%), by Product Type 2025 & 2033
- Figure 6: Asia Pacific Special Graphite Market Volume Share (%), by Product Type 2025 & 2033
- Figure 7: Asia Pacific Special Graphite Market Revenue (Million), by End-user Industry 2025 & 2033
- Figure 8: Asia Pacific Special Graphite Market Volume (Billion), by End-user Industry 2025 & 2033
- Figure 9: Asia Pacific Special Graphite Market Revenue Share (%), by End-user Industry 2025 & 2033
- Figure 10: Asia Pacific Special Graphite Market Volume Share (%), by End-user Industry 2025 & 2033
- Figure 11: Asia Pacific Special Graphite Market Revenue (Million), by Country 2025 & 2033
- Figure 12: Asia Pacific Special Graphite Market Volume (Billion), by Country 2025 & 2033
- Figure 13: Asia Pacific Special Graphite Market Revenue Share (%), by Country 2025 & 2033
- Figure 14: Asia Pacific Special Graphite Market Volume Share (%), by Country 2025 & 2033
- Figure 15: North America Special Graphite Market Revenue (Million), by Product Type 2025 & 2033
- Figure 16: North America Special Graphite Market Volume (Billion), by Product Type 2025 & 2033
- Figure 17: North America Special Graphite Market Revenue Share (%), by Product Type 2025 & 2033
- Figure 18: North America Special Graphite Market Volume Share (%), by Product Type 2025 & 2033
- Figure 19: North America Special Graphite Market Revenue (Million), by End-user Industry 2025 & 2033
- Figure 20: North America Special Graphite Market Volume (Billion), by End-user Industry 2025 & 2033
- Figure 21: North America Special Graphite Market Revenue Share (%), by End-user Industry 2025 & 2033
- Figure 22: North America Special Graphite Market Volume Share (%), by End-user Industry 2025 & 2033
- Figure 23: North America Special Graphite Market Revenue (Million), by Country 2025 & 2033
- Figure 24: North America Special Graphite Market Volume (Billion), by Country 2025 & 2033
- Figure 25: North America Special Graphite Market Revenue Share (%), by Country 2025 & 2033
- Figure 26: North America Special Graphite Market Volume Share (%), by Country 2025 & 2033
- Figure 27: Europe Special Graphite Market Revenue (Million), by Product Type 2025 & 2033
- Figure 28: Europe Special Graphite Market Volume (Billion), by Product Type 2025 & 2033
- Figure 29: Europe Special Graphite Market Revenue Share (%), by Product Type 2025 & 2033
- Figure 30: Europe Special Graphite Market Volume Share (%), by Product Type 2025 & 2033
- Figure 31: Europe Special Graphite Market Revenue (Million), by End-user Industry 2025 & 2033
- Figure 32: Europe Special Graphite Market Volume (Billion), by End-user Industry 2025 & 2033
- Figure 33: Europe Special Graphite Market Revenue Share (%), by End-user Industry 2025 & 2033
- Figure 34: Europe Special Graphite Market Volume Share (%), by End-user Industry 2025 & 2033
- Figure 35: Europe Special Graphite Market Revenue (Million), by Country 2025 & 2033
- Figure 36: Europe Special Graphite Market Volume (Billion), by Country 2025 & 2033
- Figure 37: Europe Special Graphite Market Revenue Share (%), by Country 2025 & 2033
- Figure 38: Europe Special Graphite Market Volume Share (%), by Country 2025 & 2033
- Figure 39: South America Special Graphite Market Revenue (Million), by Product Type 2025 & 2033
- Figure 40: South America Special Graphite Market Volume (Billion), by Product Type 2025 & 2033
- Figure 41: South America Special Graphite Market Revenue Share (%), by Product Type 2025 & 2033
- Figure 42: South America Special Graphite Market Volume Share (%), by Product Type 2025 & 2033
- Figure 43: South America Special Graphite Market Revenue (Million), by End-user Industry 2025 & 2033
- Figure 44: South America Special Graphite Market Volume (Billion), by End-user Industry 2025 & 2033
- Figure 45: South America Special Graphite Market Revenue Share (%), by End-user Industry 2025 & 2033
- Figure 46: South America Special Graphite Market Volume Share (%), by End-user Industry 2025 & 2033
- Figure 47: South America Special Graphite Market Revenue (Million), by Country 2025 & 2033
- Figure 48: South America Special Graphite Market Volume (Billion), by Country 2025 & 2033
- Figure 49: South America Special Graphite Market Revenue Share (%), by Country 2025 & 2033
- Figure 50: South America Special Graphite Market Volume Share (%), by Country 2025 & 2033
- Figure 51: Middle East and Africa Special Graphite Market Revenue (Million), by Product Type 2025 & 2033
- Figure 52: Middle East and Africa Special Graphite Market Volume (Billion), by Product Type 2025 & 2033
- Figure 53: Middle East and Africa Special Graphite Market Revenue Share (%), by Product Type 2025 & 2033
- Figure 54: Middle East and Africa Special Graphite Market Volume Share (%), by Product Type 2025 & 2033
- Figure 55: Middle East and Africa Special Graphite Market Revenue (Million), by End-user Industry 2025 & 2033
- Figure 56: Middle East and Africa Special Graphite Market Volume (Billion), by End-user Industry 2025 & 2033
- Figure 57: Middle East and Africa Special Graphite Market Revenue Share (%), by End-user Industry 2025 & 2033
- Figure 58: Middle East and Africa Special Graphite Market Volume Share (%), by End-user Industry 2025 & 2033
- Figure 59: Middle East and Africa Special Graphite Market Revenue (Million), by Country 2025 & 2033
- Figure 60: Middle East and Africa Special Graphite Market Volume (Billion), by Country 2025 & 2033
- Figure 61: Middle East and Africa Special Graphite Market Revenue Share (%), by Country 2025 & 2033
- Figure 62: Middle East and Africa Special Graphite Market Volume Share (%), by Country 2025 & 2033
List of Tables
- Table 1: Global Special Graphite Market Revenue Million Forecast, by Product Type 2020 & 2033
- Table 2: Global Special Graphite Market Volume Billion Forecast, by Product Type 2020 & 2033
- Table 3: Global Special Graphite Market Revenue Million Forecast, by End-user Industry 2020 & 2033
- Table 4: Global Special Graphite Market Volume Billion Forecast, by End-user Industry 2020 & 2033
- Table 5: Global Special Graphite Market Revenue Million Forecast, by Region 2020 & 2033
- Table 6: Global Special Graphite Market Volume Billion Forecast, by Region 2020 & 2033
- Table 7: Global Special Graphite Market Revenue Million Forecast, by Product Type 2020 & 2033
- Table 8: Global Special Graphite Market Volume Billion Forecast, by Product Type 2020 & 2033
- Table 9: Global Special Graphite Market Revenue Million Forecast, by End-user Industry 2020 & 2033
- Table 10: Global Special Graphite Market Volume Billion Forecast, by End-user Industry 2020 & 2033
- Table 11: Global Special Graphite Market Revenue Million Forecast, by Country 2020 & 2033
- Table 12: Global Special Graphite Market Volume Billion Forecast, by Country 2020 & 2033
- Table 13: China Special Graphite Market Revenue (Million) Forecast, by Application 2020 & 2033
- Table 14: China Special Graphite Market Volume (Billion) Forecast, by Application 2020 & 2033
- Table 15: India Special Graphite Market Revenue (Million) Forecast, by Application 2020 & 2033
- Table 16: India Special Graphite Market Volume (Billion) Forecast, by Application 2020 & 2033
- Table 17: Japan Special Graphite Market Revenue (Million) Forecast, by Application 2020 & 2033
- Table 18: Japan Special Graphite Market Volume (Billion) Forecast, by Application 2020 & 2033
- Table 19: South Korea Special Graphite Market Revenue (Million) Forecast, by Application 2020 & 2033
- Table 20: South Korea Special Graphite Market Volume (Billion) Forecast, by Application 2020 & 2033
- Table 21: Rest of Asia Pacific Special Graphite Market Revenue (Million) Forecast, by Application 2020 & 2033
- Table 22: Rest of Asia Pacific Special Graphite Market Volume (Billion) Forecast, by Application 2020 & 2033
- Table 23: Global Special Graphite Market Revenue Million Forecast, by Product Type 2020 & 2033
- Table 24: Global Special Graphite Market Volume Billion Forecast, by Product Type 2020 & 2033
- Table 25: Global Special Graphite Market Revenue Million Forecast, by End-user Industry 2020 & 2033
- Table 26: Global Special Graphite Market Volume Billion Forecast, by End-user Industry 2020 & 2033
- Table 27: Global Special Graphite Market Revenue Million Forecast, by Country 2020 & 2033
- Table 28: Global Special Graphite Market Volume Billion Forecast, by Country 2020 & 2033
- Table 29: United States Special Graphite Market Revenue (Million) Forecast, by Application 2020 & 2033
- Table 30: United States Special Graphite Market Volume (Billion) Forecast, by Application 2020 & 2033
- Table 31: Canada Special Graphite Market Revenue (Million) Forecast, by Application 2020 & 2033
- Table 32: Canada Special Graphite Market Volume (Billion) Forecast, by Application 2020 & 2033
- Table 33: Mexico Special Graphite Market Revenue (Million) Forecast, by Application 2020 & 2033
- Table 34: Mexico Special Graphite Market Volume (Billion) Forecast, by Application 2020 & 2033
- Table 35: Global Special Graphite Market Revenue Million Forecast, by Product Type 2020 & 2033
- Table 36: Global Special Graphite Market Volume Billion Forecast, by Product Type 2020 & 2033
- Table 37: Global Special Graphite Market Revenue Million Forecast, by End-user Industry 2020 & 2033
- Table 38: Global Special Graphite Market Volume Billion Forecast, by End-user Industry 2020 & 2033
- Table 39: Global Special Graphite Market Revenue Million Forecast, by Country 2020 & 2033
- Table 40: Global Special Graphite Market Volume Billion Forecast, by Country 2020 & 2033
- Table 41: Germany Special Graphite Market Revenue (Million) Forecast, by Application 2020 & 2033
- Table 42: Germany Special Graphite Market Volume (Billion) Forecast, by Application 2020 & 2033
- Table 43: United Kingdom Special Graphite Market Revenue (Million) Forecast, by Application 2020 & 2033
- Table 44: United Kingdom Special Graphite Market Volume (Billion) Forecast, by Application 2020 & 2033
- Table 45: France Special Graphite Market Revenue (Million) Forecast, by Application 2020 & 2033
- Table 46: France Special Graphite Market Volume (Billion) Forecast, by Application 2020 & 2033
- Table 47: Italy Special Graphite Market Revenue (Million) Forecast, by Application 2020 & 2033
- Table 48: Italy Special Graphite Market Volume (Billion) Forecast, by Application 2020 & 2033
- Table 49: Rest of Europe Special Graphite Market Revenue (Million) Forecast, by Application 2020 & 2033
- Table 50: Rest of Europe Special Graphite Market Volume (Billion) Forecast, by Application 2020 & 2033
- Table 51: Global Special Graphite Market Revenue Million Forecast, by Product Type 2020 & 2033
- Table 52: Global Special Graphite Market Volume Billion Forecast, by Product Type 2020 & 2033
- Table 53: Global Special Graphite Market Revenue Million Forecast, by End-user Industry 2020 & 2033
- Table 54: Global Special Graphite Market Volume Billion Forecast, by End-user Industry 2020 & 2033
- Table 55: Global Special Graphite Market Revenue Million Forecast, by Country 2020 & 2033
- Table 56: Global Special Graphite Market Volume Billion Forecast, by Country 2020 & 2033
- Table 57: Brazil Special Graphite Market Revenue (Million) Forecast, by Application 2020 & 2033
- Table 58: Brazil Special Graphite Market Volume (Billion) Forecast, by Application 2020 & 2033
- Table 59: Argentina Special Graphite Market Revenue (Million) Forecast, by Application 2020 & 2033
- Table 60: Argentina Special Graphite Market Volume (Billion) Forecast, by Application 2020 & 2033
- Table 61: Rest of South America Special Graphite Market Revenue (Million) Forecast, by Application 2020 & 2033
- Table 62: Rest of South America Special Graphite Market Volume (Billion) Forecast, by Application 2020 & 2033
- Table 63: Global Special Graphite Market Revenue Million Forecast, by Product Type 2020 & 2033
- Table 64: Global Special Graphite Market Volume Billion Forecast, by Product Type 2020 & 2033
- Table 65: Global Special Graphite Market Revenue Million Forecast, by End-user Industry 2020 & 2033
- Table 66: Global Special Graphite Market Volume Billion Forecast, by End-user Industry 2020 & 2033
- Table 67: Global Special Graphite Market Revenue Million Forecast, by Country 2020 & 2033
- Table 68: Global Special Graphite Market Volume Billion Forecast, by Country 2020 & 2033
- Table 69: Saudi Arabia Special Graphite Market Revenue (Million) Forecast, by Application 2020 & 2033
- Table 70: Saudi Arabia Special Graphite Market Volume (Billion) Forecast, by Application 2020 & 2033
- Table 71: South Africa Special Graphite Market Revenue (Million) Forecast, by Application 2020 & 2033
- Table 72: South Africa Special Graphite Market Volume (Billion) Forecast, by Application 2020 & 2033
- Table 73: Rest of Middle East and Africa Special Graphite Market Revenue (Million) Forecast, by Application 2020 & 2033
- Table 74: Rest of Middle East and Africa Special Graphite Market Volume (Billion) Forecast, by Application 2020 & 2033
Frequently Asked Questions
1. What is the projected Compound Annual Growth Rate (CAGR) of the Special Graphite Market?
The projected CAGR is approximately > 5.00%.
2. Which companies are prominent players in the Special Graphite Market?
Key companies in the market include Entegris Inc, Fangda Carbon New Material Technology Co Ltd, GrafTech International, Graphite India Limited, IBIDEN, Mersen SA, Morgan Advanced Materials, Nippon Carbon Co Ltd, Pingdingshan City Kaiyuan specialty graphite Ltd, Schunk Carbon Technology, SEC CARBON LIMITED, SGL Carbon, Tokai Carbon Co Ltd, Toyo Tanso Co Ltd, Yichang Xincheng Graphite Co Ltd *List Not Exhaustive.
3. What are the main segments of the Special Graphite Market?
The market segments include Product Type, End-user Industry.
4. Can you provide details about the market size?
The market size is estimated to be USD 1.01 Million as of 2022.
5. What are some drivers contributing to market growth?
Increasing Government Policies for Solar Energy; Augmenting Demand from the Growing Lithium-ion Battery Industry; Increasing Demand for Expandable Graphite as a Flame Retardant Material.
6. What are the notable trends driving market growth?
Increasing Demand from the Electronics Industry.
7. Are there any restraints impacting market growth?
Increasing Government Policies for Solar Energy; Augmenting Demand from the Growing Lithium-ion Battery Industry; Increasing Demand for Expandable Graphite as a Flame Retardant Material.
8. Can you provide examples of recent developments in the market?
July 2023: Mersen inaugurated its Columbia site in the United States, spanning 240,000 square meters. The plant can produce 4,000 tons of extruded graphite and 2,000 tons of isostatic graphite per year. As part of its 2027 strategic plan, Mersen will further increase its global isostatic graphite manufacturing capacities to 16,000 tons by the end of 2024.
9. What pricing options are available for accessing the report?
Pricing options include single-user, multi-user, and enterprise licenses priced at USD 4750, USD 5250, and USD 8750 respectively.
10. Is the market size provided in terms of value or volume?
The market size is provided in terms of value, measured in Million and volume, measured in Billion.
11. Are there any specific market keywords associated with the report?
Yes, the market keyword associated with the report is "Special Graphite Market," which aids in identifying and referencing the specific market segment covered.
12. How do I determine which pricing option suits my needs best?
The pricing options vary based on user requirements and access needs. Individual users may opt for single-user licenses, while businesses requiring broader access may choose multi-user or enterprise licenses for cost-effective access to the report.
13. Are there any additional resources or data provided in the Special Graphite Market report?
While the report offers comprehensive insights, it's advisable to review the specific contents or supplementary materials provided to ascertain if additional resources or data are available.
14. How can I stay updated on further developments or reports in the Special Graphite Market?
To stay informed about further developments, trends, and reports in the Special Graphite Market, consider subscribing to industry newsletters, following relevant companies and organizations, or regularly checking reputable industry news sources and publications.
Methodology
Step 1 - Identification of Relevant Samples Size from Population Database


Step 2 - Approaches for Defining Global Market Size (Value, Volume* & Price*)

Note*: In applicable scenarios
Step 3 - Data Sources
Primary Research
- Web Analytics
- Survey Reports
- Research Institute
- Latest Research Reports
- Opinion Leaders
Secondary Research
- Annual Reports
- White Paper
- Latest Press Release
- Industry Association
- Paid Database
- Investor Presentations

Step 4 - Data Triangulation
Involves using different sources of information in order to increase the validity of a study
These sources are likely to be stakeholders in a program - participants, other researchers, program staff, other community members, and so on.
Then we put all data in single framework & apply various statistical tools to find out the dynamic on the market.
During the analysis stage, feedback from the stakeholder groups would be compared to determine areas of agreement as well as areas of divergence