

Key Insights
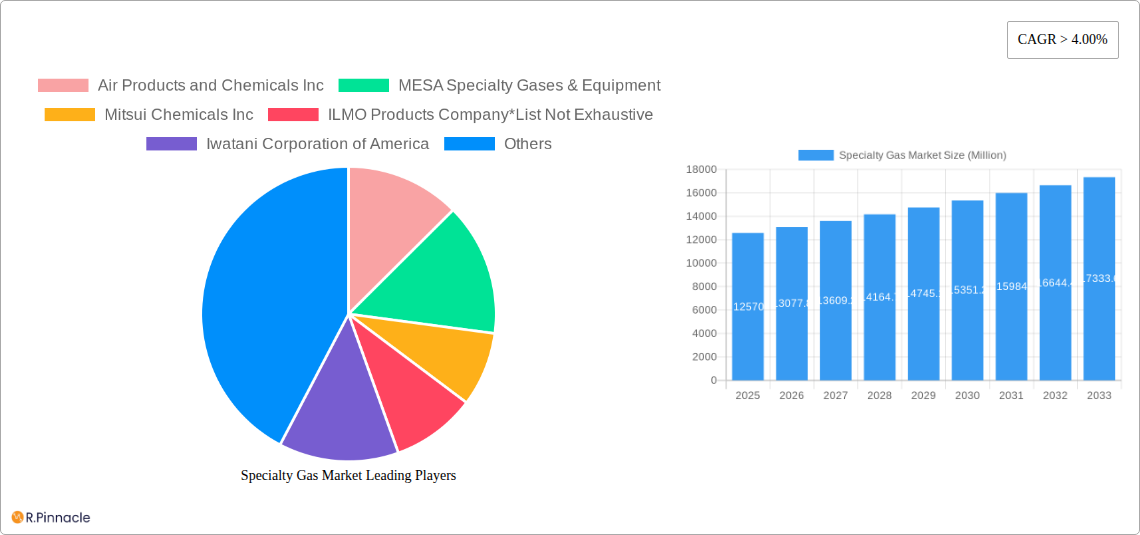
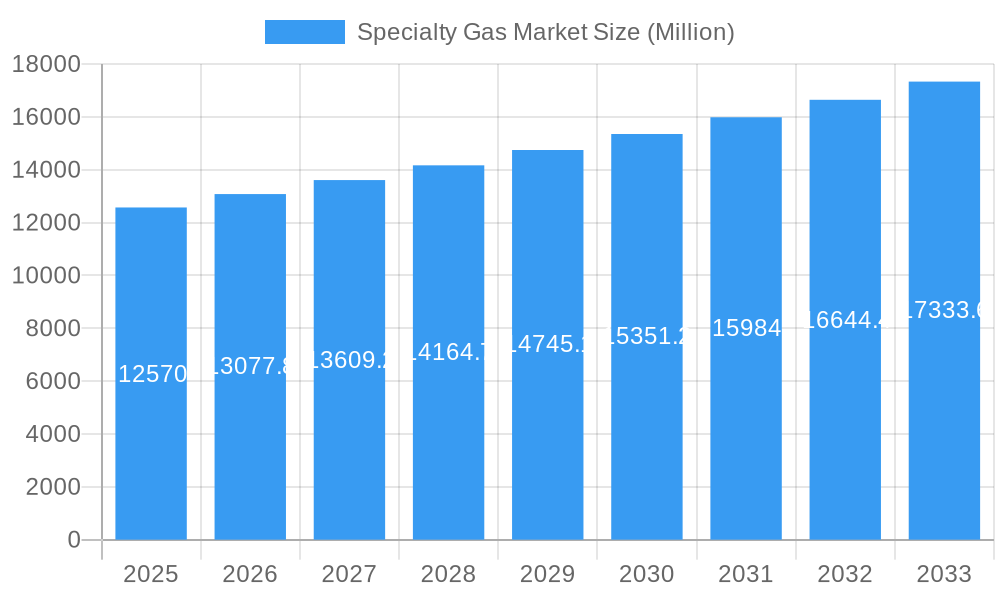
The specialty gas market, valued at $12,570 million in 2025, is projected to experience robust growth, exceeding a 4% CAGR through 2033. This expansion is driven by several key factors. The burgeoning electronics industry, particularly semiconductor manufacturing, necessitates high-purity gases for etching, deposition, and cleaning processes, fueling significant demand. Similarly, the automotive sector's increasing adoption of advanced driver-assistance systems (ADAS) and electric vehicles (EVs) relies heavily on specialty gases for various manufacturing stages. The medical and healthcare sector also contributes significantly, utilizing specialty gases in applications like medical imaging and laser surgery. Furthermore, the growing food and beverage industry requires inert gases for packaging and preservation, contributing to market growth. Regional variations exist, with Asia Pacific, particularly China and India, exhibiting rapid growth due to robust industrialization and expanding manufacturing sectors. North America and Europe maintain significant market shares driven by established industries and technological advancements. Competition within the market is fierce, with major players like Air Products, Linde, Air Liquide, and Messer Group vying for market share through technological innovation and strategic partnerships.
Specialty Gas Market Market Size (In Billion)
Growth is expected to be particularly strong in segments like high-purity gases and noble gases, reflecting the increased demand for sophisticated applications. However, regulatory restrictions regarding the handling and emission of certain specialty gases, coupled with price volatility in raw materials, pose potential challenges to market growth. Nonetheless, ongoing research and development efforts aimed at improving gas purity, enhancing safety protocols, and exploring alternative, eco-friendly gases are expected to mitigate these restraints and drive future growth. The market segmentation by type (High-purity Gases, Noble Gases, Carbon Gases, Halogen Gases, Other Types) and end-user industry (Automotive, Electronics, Medical and Healthcare, Food and Beverage, Oil and Gas, Other End-User Industries) allows for a nuanced understanding of market dynamics and provides opportunities for targeted growth strategies for both producers and consumers.
Specialty Gas Market Company Market Share
Specialty Gas Market Report: 2019-2033 Forecast
This comprehensive report provides an in-depth analysis of the Specialty Gas Market, offering valuable insights for industry professionals, investors, and strategic decision-makers. Covering the period 2019-2033, with a focus on 2025, this report unveils market dynamics, growth drivers, challenges, and future opportunities within this crucial sector. The study period encompasses historical data (2019-2024), the base year (2025), and a detailed forecast (2025-2033). Expect detailed breakdowns by type (High-purity Gases, Noble Gases, Carbon Gases, Halogen Gases, Other Types) and end-user industry (Automotive, Electronics, Medical and Healthcare, Food and Beverage, Oil and Gas, Other End-User Industries). Key players like Air Products and Chemicals Inc, MESA Specialty Gases & Equipment, Mitsui Chemicals Inc, ILMO Products Company, Iwatani Corporation of America, Linde plc, Messer Group GmbH, Air Liquide, Norco Inc, YUEYANG KAIMEITE ELECTRONIC AND SPECLALTY RARE GASES CO, SHOWA DENKO K K, and Coregas are analyzed for their market positioning and strategic moves.
Specialty Gas Market Structure & Innovation Trends
This section analyzes the competitive landscape of the specialty gas market, exploring market concentration, innovation drivers, regulatory frameworks, product substitutes, end-user demographics, and merger & acquisition (M&A) activities. The market is characterized by a moderately concentrated structure, with several major players holding significant market share. Air Products and Chemicals Inc and Linde plc are among the leading companies, estimated to hold a combined xx% market share in 2025. However, smaller, specialized players also thrive, particularly in niche segments like high-purity gases for the electronics industry. Innovation is driven by the increasing demand for higher purity gases, stricter environmental regulations, and the development of new applications in diverse end-user industries.
- Market Concentration: High, with top 5 players estimated to hold xx% market share in 2025.
- M&A Activity: Moderate levels of M&A activity in recent years, with deal values averaging approximately xx Million annually. These activities reflect consolidation trends and the expansion into new geographical markets and segments.
- Regulatory Frameworks: Stringent safety and environmental regulations vary significantly across regions and influence production and distribution processes.
- Product Substitutes: Limited direct substitutes, but alternative technologies and processes can impact demand in specific applications.
- End-User Demographics: Significant growth is anticipated from the electronics, medical and healthcare, and automotive sectors, driving demand for high-purity and specialized gases.
Specialty Gas Market Dynamics & Trends
The specialty gas market exhibits robust growth driven by the increasing demand across various end-user industries, particularly the electronics sector. The market is expected to witness a CAGR of xx% during the forecast period (2025-2033), reaching a market value of xx Million by 2033. Technological advancements in gas purification and separation technologies are further driving market growth. Key growth drivers include the rising demand for high-purity gases in semiconductor manufacturing and the expansion of the medical and healthcare sectors. However, price fluctuations of raw materials and supply chain disruptions pose potential challenges. The market penetration of specialty gases is steadily increasing, particularly in emerging economies.
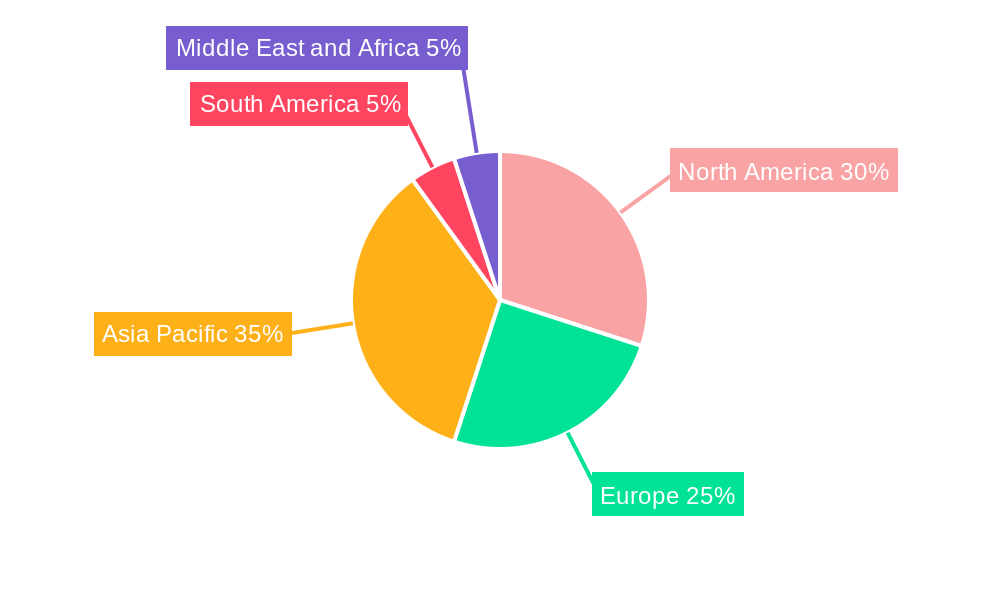
Dominant Regions & Segments in Specialty Gas Market
The North American region is currently the dominant market for specialty gases, driven by robust demand from the electronics and automotive industries and established manufacturing infrastructure. However, Asia Pacific is projected to experience the fastest growth in the coming years, driven by rapid industrialization and economic development, particularly in China and India.
- Dominant Region: North America (estimated xx% market share in 2025)
- Fastest-Growing Region: Asia Pacific
- Key Drivers in North America: Strong industrial base, high technological advancement, and established supply chains.
- Key Drivers in Asia Pacific: Rapid industrialization, rising disposable incomes, and increasing adoption of advanced technologies.
- Dominant Segment (Type): High-purity Gases, owing to their extensive use in semiconductor manufacturing and other technologically advanced sectors.
- Dominant Segment (End-User Industry): Electronics, driven by the ever-increasing demand for sophisticated electronic devices and the need for high-purity gases in their manufacturing.
Specialty Gas Market Product Innovations
Recent years have witnessed significant innovation in specialty gas production and delivery systems. The introduction of membrane-based gas separation technologies, improved purification techniques, and the development of more efficient and safer delivery systems have significantly enhanced the industry. For instance, Air Products' PRISM InertPro Nitrogen Membrane System showcases these advancements. This system offers world-class efficiencies, enhancing competitiveness and catering to the growing needs of the energy and oil & gas sector.
Report Scope & Segmentation Analysis
This report comprehensively segments the specialty gas market by type (High-purity Gases, Noble Gases, Carbon Gases, Halogen Gases, Other Types) and end-user industry (Automotive, Electronics, Medical and Healthcare, Food and Beverage, Oil and Gas, Other End-User Industries). Each segment's growth projections, market sizes, and competitive dynamics are meticulously analyzed. For instance, the High-purity Gases segment is projected to experience robust growth, driven by the semiconductor industry. Similarly, the Electronics segment demonstrates strong growth owing to the expanding electronics industry. Other segments show varied growth rates based on specific market demands and regional variations.
Key Drivers of Specialty Gas Market Growth
The specialty gas market is propelled by technological advancements in semiconductor manufacturing, increasing demand for high-purity gases in various industrial applications, and the burgeoning medical and healthcare sectors. Stringent environmental regulations are further driving the adoption of eco-friendly gas production and delivery systems. Economic growth in emerging economies fuels the increased demand for specialty gases across diverse industries.
Challenges in the Specialty Gas Market Sector
The specialty gas market faces challenges like raw material price volatility, potential supply chain disruptions, and intense competition among established players. Stringent safety regulations and environmental concerns necessitate considerable investments in safety protocols and emission control measures. These factors impact production costs and profit margins. The rising costs of energy and transportation also add to operational expenses.
Emerging Opportunities in Specialty Gas Market
Significant opportunities exist in emerging economies due to rising industrialization and increasing adoption of advanced technologies. New applications for specialty gases in areas such as renewable energy, biotechnology, and advanced materials present lucrative prospects. The development of innovative and sustainable gas production and delivery technologies also offers significant growth potential.
Leading Players in the Specialty Gas Market Market
- Air Products and Chemicals Inc
- MESA Specialty Gases & Equipment
- Mitsui Chemicals Inc
- ILMO Products Company
- Iwatani Corporation of America
- Linde plc
- Messer Group GmbH
- Air Liquide
- Norco Inc
- YUEYANG KAIMEITE ELECTRONIC AND SPECLALTY RARE GASES CO
- SHOWA DENKO K K
- Coregas
Key Developments in Specialty Gas Market Industry
- February 2023: Linde announced a long-term agreement with OCI to supply clean hydrogen and other industrial gases to a new blue ammonia factory in Beaumont, Texas, signifying a major step towards sustainable industrial gas production. This project alone involves supplying 1.1 Million tons of blue ammonia production with clean hydrogen and nitrogen annually, sequestering over 1.7 Million tons of CO2 emissions.
- February 2023: Air Products launched its PRISM InertPro Nitrogen Membrane System at the Middle East Oil and Gas Show, showcasing innovation in nitrogen membrane systems for the energy and oil & gas industry. This innovative, modular system offers world-class efficiencies.
Future Outlook for Specialty Gas Market Market
The specialty gas market is poised for continued growth, driven by technological advancements, increasing demand across various end-user industries, and the emergence of new applications. Strategic partnerships, investments in R&D, and expansion into emerging markets will be critical for success. The focus on sustainability and environmental consciousness will continue to shape industry dynamics. The market is expected to see sustained growth in the coming years, with opportunities for both established and new entrants.
Specialty Gas Market Segmentation
-
1. Type
- 1.1. High-purity Gases
- 1.2. Noble Gases
- 1.3. Carbon Gases
- 1.4. Halogen Gases
- 1.5. Other Types
-
2. End-User Industry
- 2.1. Automotive
- 2.2. Electronics
- 2.3. Medical and Healthcare
- 2.4. Food and Beverage
- 2.5. Oil and Gas
- 2.6. Other End-User Industries
Specialty Gas Market Segmentation By Geography
-
1. Asia Pacific
- 1.1. China
- 1.2. India
- 1.3. Japan
- 1.4. South Korea
- 1.5. Rest of Asia Pacific
-
2. North America
- 2.1. United States
- 2.2. Canada
- 2.3. Mexico
- 2.4. Rest of North America
-
3. Europe
- 3.1. Germany
- 3.2. United Kingdom
- 3.3. Italy
- 3.4. France
- 3.5. Rest of Europe
-
4. South America
- 4.1. Brazil
- 4.2. Aregentina
- 4.3. Rest of South America
-
5. Middle East and Africa
- 5.1. Saudi Arabia
- 5.2. South Africa
- 5.3. Rest of Middle East and Africa
Specialty Gas Market Regional Market Share
Geographic Coverage of Specialty Gas Market
Specialty Gas Market REPORT HIGHLIGHTS
| Aspects | Details |
|---|---|
| Study Period | 2020-2034 |
| Base Year | 2025 |
| Estimated Year | 2026 |
| Forecast Period | 2026-2034 |
| Historical Period | 2020-2025 |
| Growth Rate | CAGR of > 4.00% from 2020-2034 |
| Segmentation |
|
Table of Contents
- 1. Introduction
- 1.1. Research Scope
- 1.2. Market Segmentation
- 1.3. Research Objective
- 1.4. Definitions and Assumptions
- 2. Executive Summary
- 2.1. Market Snapshot
- 3. Market Dynamics
- 3.1. Market Drivers
- 3.2. Market Restrains
- 3.3. Market Trends
- 3.4. Market Opportunities
- 4. Market Factor Analysis
- 4.1. Porters Five Forces
- 4.1.1. Bargaining Power of Suppliers
- 4.1.2. Bargaining Power of Buyers
- 4.1.3. Threat of New Entrants
- 4.1.4. Threat of Substitutes
- 4.1.5. Competitive Rivalry
- 4.2. PESTEL analysis
- 4.3. BCG Analysis
- 4.3.1. Stars (High Growth, High Market Share)
- 4.3.2. Cash Cows (Low Growth, High Market Share)
- 4.3.3. Question Mark (High Growth, Low Market Share)
- 4.3.4. Dogs (Low Growth, Low Market Share)
- 4.4. Ansoff Matrix Analysis
- 4.5. Supply Chain Analysis
- 4.6. Regulatory Landscape
- 4.7. Current Market Potential and Opportunity Assessment (TAM–SAM–SOM Framework)
- 4.8. PRI Analyst Note
- 4.1. Porters Five Forces
- 5. Market Analysis, Insights and Forecast 2021-2033
- 5.1. Market Analysis, Insights and Forecast - by Type
- 5.1.1. High-purity Gases
- 5.1.2. Noble Gases
- 5.1.3. Carbon Gases
- 5.1.4. Halogen Gases
- 5.1.5. Other Types
- 5.2. Market Analysis, Insights and Forecast - by End-User Industry
- 5.2.1. Automotive
- 5.2.2. Electronics
- 5.2.3. Medical and Healthcare
- 5.2.4. Food and Beverage
- 5.2.5. Oil and Gas
- 5.2.6. Other End-User Industries
- 5.3. Market Analysis, Insights and Forecast - by Region
- 5.3.1. Asia Pacific
- 5.3.2. North America
- 5.3.3. Europe
- 5.3.4. South America
- 5.3.5. Middle East and Africa
- 5.1. Market Analysis, Insights and Forecast - by Type
- 6. Global Specialty Gas Market Analysis, Insights and Forecast, 2021-2033
- 6.1. Market Analysis, Insights and Forecast - by Type
- 6.1.1. High-purity Gases
- 6.1.2. Noble Gases
- 6.1.3. Carbon Gases
- 6.1.4. Halogen Gases
- 6.1.5. Other Types
- 6.2. Market Analysis, Insights and Forecast - by End-User Industry
- 6.2.1. Automotive
- 6.2.2. Electronics
- 6.2.3. Medical and Healthcare
- 6.2.4. Food and Beverage
- 6.2.5. Oil and Gas
- 6.2.6. Other End-User Industries
- 6.1. Market Analysis, Insights and Forecast - by Type
- 7. Asia Pacific Specialty Gas Market Analysis, Insights and Forecast, 2020-2032
- 7.1. Market Analysis, Insights and Forecast - by Type
- 7.1.1. High-purity Gases
- 7.1.2. Noble Gases
- 7.1.3. Carbon Gases
- 7.1.4. Halogen Gases
- 7.1.5. Other Types
- 7.2. Market Analysis, Insights and Forecast - by End-User Industry
- 7.2.1. Automotive
- 7.2.2. Electronics
- 7.2.3. Medical and Healthcare
- 7.2.4. Food and Beverage
- 7.2.5. Oil and Gas
- 7.2.6. Other End-User Industries
- 7.1. Market Analysis, Insights and Forecast - by Type
- 8. North America Specialty Gas Market Analysis, Insights and Forecast, 2020-2032
- 8.1. Market Analysis, Insights and Forecast - by Type
- 8.1.1. High-purity Gases
- 8.1.2. Noble Gases
- 8.1.3. Carbon Gases
- 8.1.4. Halogen Gases
- 8.1.5. Other Types
- 8.2. Market Analysis, Insights and Forecast - by End-User Industry
- 8.2.1. Automotive
- 8.2.2. Electronics
- 8.2.3. Medical and Healthcare
- 8.2.4. Food and Beverage
- 8.2.5. Oil and Gas
- 8.2.6. Other End-User Industries
- 8.1. Market Analysis, Insights and Forecast - by Type
- 9. Europe Specialty Gas Market Analysis, Insights and Forecast, 2020-2032
- 9.1. Market Analysis, Insights and Forecast - by Type
- 9.1.1. High-purity Gases
- 9.1.2. Noble Gases
- 9.1.3. Carbon Gases
- 9.1.4. Halogen Gases
- 9.1.5. Other Types
- 9.2. Market Analysis, Insights and Forecast - by End-User Industry
- 9.2.1. Automotive
- 9.2.2. Electronics
- 9.2.3. Medical and Healthcare
- 9.2.4. Food and Beverage
- 9.2.5. Oil and Gas
- 9.2.6. Other End-User Industries
- 9.1. Market Analysis, Insights and Forecast - by Type
- 10. South America Specialty Gas Market Analysis, Insights and Forecast, 2020-2032
- 10.1. Market Analysis, Insights and Forecast - by Type
- 10.1.1. High-purity Gases
- 10.1.2. Noble Gases
- 10.1.3. Carbon Gases
- 10.1.4. Halogen Gases
- 10.1.5. Other Types
- 10.2. Market Analysis, Insights and Forecast - by End-User Industry
- 10.2.1. Automotive
- 10.2.2. Electronics
- 10.2.3. Medical and Healthcare
- 10.2.4. Food and Beverage
- 10.2.5. Oil and Gas
- 10.2.6. Other End-User Industries
- 10.1. Market Analysis, Insights and Forecast - by Type
- 11. Middle East and Africa Specialty Gas Market Analysis, Insights and Forecast, 2020-2032
- 11.1. Market Analysis, Insights and Forecast - by Type
- 11.1.1. High-purity Gases
- 11.1.2. Noble Gases
- 11.1.3. Carbon Gases
- 11.1.4. Halogen Gases
- 11.1.5. Other Types
- 11.2. Market Analysis, Insights and Forecast - by End-User Industry
- 11.2.1. Automotive
- 11.2.2. Electronics
- 11.2.3. Medical and Healthcare
- 11.2.4. Food and Beverage
- 11.2.5. Oil and Gas
- 11.2.6. Other End-User Industries
- 11.1. Market Analysis, Insights and Forecast - by Type
- 12. Competitive Analysis
- 12.1. Company Profiles
- 12.1.1 Air Products and Chemicals Inc
- 12.1.1.1. Company Overview
- 12.1.1.2. Products
- 12.1.1.3. Company Financials
- 12.1.1.4. SWOT Analysis
- 12.1.2 MESA Specialty Gases & Equipment
- 12.1.2.1. Company Overview
- 12.1.2.2. Products
- 12.1.2.3. Company Financials
- 12.1.2.4. SWOT Analysis
- 12.1.3 Mitsui Chemicals Inc
- 12.1.3.1. Company Overview
- 12.1.3.2. Products
- 12.1.3.3. Company Financials
- 12.1.3.4. SWOT Analysis
- 12.1.4 ILMO Products Company*List Not Exhaustive
- 12.1.4.1. Company Overview
- 12.1.4.2. Products
- 12.1.4.3. Company Financials
- 12.1.4.4. SWOT Analysis
- 12.1.5 Iwatani Corporation of America
- 12.1.5.1. Company Overview
- 12.1.5.2. Products
- 12.1.5.3. Company Financials
- 12.1.5.4. SWOT Analysis
- 12.1.6 Linde plc
- 12.1.6.1. Company Overview
- 12.1.6.2. Products
- 12.1.6.3. Company Financials
- 12.1.6.4. SWOT Analysis
- 12.1.7 Messer Group GmbH
- 12.1.7.1. Company Overview
- 12.1.7.2. Products
- 12.1.7.3. Company Financials
- 12.1.7.4. SWOT Analysis
- 12.1.8 Air Liquide
- 12.1.8.1. Company Overview
- 12.1.8.2. Products
- 12.1.8.3. Company Financials
- 12.1.8.4. SWOT Analysis
- 12.1.9 Norco Inc
- 12.1.9.1. Company Overview
- 12.1.9.2. Products
- 12.1.9.3. Company Financials
- 12.1.9.4. SWOT Analysis
- 12.1.10 YUEYANG KAIMEITE ELECTRONIC AND SPECLALTY RARE GASES CO
- 12.1.10.1. Company Overview
- 12.1.10.2. Products
- 12.1.10.3. Company Financials
- 12.1.10.4. SWOT Analysis
- 12.1.11 SHOWA DENKO K K
- 12.1.11.1. Company Overview
- 12.1.11.2. Products
- 12.1.11.3. Company Financials
- 12.1.11.4. SWOT Analysis
- 12.1.12 Coregas
- 12.1.12.1. Company Overview
- 12.1.12.2. Products
- 12.1.12.3. Company Financials
- 12.1.12.4. SWOT Analysis
- 12.1.1 Air Products and Chemicals Inc
- 12.2. Market Entropy
- 12.2.1 Company's Key Areas Served
- 12.2.2 Recent Developments
- 12.3. Company Market Share Analysis 2025
- 12.3.1 Top 5 Companies Market Share Analysis
- 12.3.2 Top 3 Companies Market Share Analysis
- 12.4. List of Potential Customers
- 13. Research Methodology
List of Figures
- Figure 1: Global Specialty Gas Market Revenue Breakdown (Million, %) by Region 2025 & 2033
- Figure 2: Global Specialty Gas Market Volume Breakdown (K Tons, %) by Region 2025 & 2033
- Figure 3: Asia Pacific Specialty Gas Market Revenue (Million), by Type 2025 & 2033
- Figure 4: Asia Pacific Specialty Gas Market Volume (K Tons), by Type 2025 & 2033
- Figure 5: Asia Pacific Specialty Gas Market Revenue Share (%), by Type 2025 & 2033
- Figure 6: Asia Pacific Specialty Gas Market Volume Share (%), by Type 2025 & 2033
- Figure 7: Asia Pacific Specialty Gas Market Revenue (Million), by End-User Industry 2025 & 2033
- Figure 8: Asia Pacific Specialty Gas Market Volume (K Tons), by End-User Industry 2025 & 2033
- Figure 9: Asia Pacific Specialty Gas Market Revenue Share (%), by End-User Industry 2025 & 2033
- Figure 10: Asia Pacific Specialty Gas Market Volume Share (%), by End-User Industry 2025 & 2033
- Figure 11: Asia Pacific Specialty Gas Market Revenue (Million), by Country 2025 & 2033
- Figure 12: Asia Pacific Specialty Gas Market Volume (K Tons), by Country 2025 & 2033
- Figure 13: Asia Pacific Specialty Gas Market Revenue Share (%), by Country 2025 & 2033
- Figure 14: Asia Pacific Specialty Gas Market Volume Share (%), by Country 2025 & 2033
- Figure 15: North America Specialty Gas Market Revenue (Million), by Type 2025 & 2033
- Figure 16: North America Specialty Gas Market Volume (K Tons), by Type 2025 & 2033
- Figure 17: North America Specialty Gas Market Revenue Share (%), by Type 2025 & 2033
- Figure 18: North America Specialty Gas Market Volume Share (%), by Type 2025 & 2033
- Figure 19: North America Specialty Gas Market Revenue (Million), by End-User Industry 2025 & 2033
- Figure 20: North America Specialty Gas Market Volume (K Tons), by End-User Industry 2025 & 2033
- Figure 21: North America Specialty Gas Market Revenue Share (%), by End-User Industry 2025 & 2033
- Figure 22: North America Specialty Gas Market Volume Share (%), by End-User Industry 2025 & 2033
- Figure 23: North America Specialty Gas Market Revenue (Million), by Country 2025 & 2033
- Figure 24: North America Specialty Gas Market Volume (K Tons), by Country 2025 & 2033
- Figure 25: North America Specialty Gas Market Revenue Share (%), by Country 2025 & 2033
- Figure 26: North America Specialty Gas Market Volume Share (%), by Country 2025 & 2033
- Figure 27: Europe Specialty Gas Market Revenue (Million), by Type 2025 & 2033
- Figure 28: Europe Specialty Gas Market Volume (K Tons), by Type 2025 & 2033
- Figure 29: Europe Specialty Gas Market Revenue Share (%), by Type 2025 & 2033
- Figure 30: Europe Specialty Gas Market Volume Share (%), by Type 2025 & 2033
- Figure 31: Europe Specialty Gas Market Revenue (Million), by End-User Industry 2025 & 2033
- Figure 32: Europe Specialty Gas Market Volume (K Tons), by End-User Industry 2025 & 2033
- Figure 33: Europe Specialty Gas Market Revenue Share (%), by End-User Industry 2025 & 2033
- Figure 34: Europe Specialty Gas Market Volume Share (%), by End-User Industry 2025 & 2033
- Figure 35: Europe Specialty Gas Market Revenue (Million), by Country 2025 & 2033
- Figure 36: Europe Specialty Gas Market Volume (K Tons), by Country 2025 & 2033
- Figure 37: Europe Specialty Gas Market Revenue Share (%), by Country 2025 & 2033
- Figure 38: Europe Specialty Gas Market Volume Share (%), by Country 2025 & 2033
- Figure 39: South America Specialty Gas Market Revenue (Million), by Type 2025 & 2033
- Figure 40: South America Specialty Gas Market Volume (K Tons), by Type 2025 & 2033
- Figure 41: South America Specialty Gas Market Revenue Share (%), by Type 2025 & 2033
- Figure 42: South America Specialty Gas Market Volume Share (%), by Type 2025 & 2033
- Figure 43: South America Specialty Gas Market Revenue (Million), by End-User Industry 2025 & 2033
- Figure 44: South America Specialty Gas Market Volume (K Tons), by End-User Industry 2025 & 2033
- Figure 45: South America Specialty Gas Market Revenue Share (%), by End-User Industry 2025 & 2033
- Figure 46: South America Specialty Gas Market Volume Share (%), by End-User Industry 2025 & 2033
- Figure 47: South America Specialty Gas Market Revenue (Million), by Country 2025 & 2033
- Figure 48: South America Specialty Gas Market Volume (K Tons), by Country 2025 & 2033
- Figure 49: South America Specialty Gas Market Revenue Share (%), by Country 2025 & 2033
- Figure 50: South America Specialty Gas Market Volume Share (%), by Country 2025 & 2033
- Figure 51: Middle East and Africa Specialty Gas Market Revenue (Million), by Type 2025 & 2033
- Figure 52: Middle East and Africa Specialty Gas Market Volume (K Tons), by Type 2025 & 2033
- Figure 53: Middle East and Africa Specialty Gas Market Revenue Share (%), by Type 2025 & 2033
- Figure 54: Middle East and Africa Specialty Gas Market Volume Share (%), by Type 2025 & 2033
- Figure 55: Middle East and Africa Specialty Gas Market Revenue (Million), by End-User Industry 2025 & 2033
- Figure 56: Middle East and Africa Specialty Gas Market Volume (K Tons), by End-User Industry 2025 & 2033
- Figure 57: Middle East and Africa Specialty Gas Market Revenue Share (%), by End-User Industry 2025 & 2033
- Figure 58: Middle East and Africa Specialty Gas Market Volume Share (%), by End-User Industry 2025 & 2033
- Figure 59: Middle East and Africa Specialty Gas Market Revenue (Million), by Country 2025 & 2033
- Figure 60: Middle East and Africa Specialty Gas Market Volume (K Tons), by Country 2025 & 2033
- Figure 61: Middle East and Africa Specialty Gas Market Revenue Share (%), by Country 2025 & 2033
- Figure 62: Middle East and Africa Specialty Gas Market Volume Share (%), by Country 2025 & 2033
List of Tables
- Table 1: Global Specialty Gas Market Revenue Million Forecast, by Type 2020 & 2033
- Table 2: Global Specialty Gas Market Volume K Tons Forecast, by Type 2020 & 2033
- Table 3: Global Specialty Gas Market Revenue Million Forecast, by End-User Industry 2020 & 2033
- Table 4: Global Specialty Gas Market Volume K Tons Forecast, by End-User Industry 2020 & 2033
- Table 5: Global Specialty Gas Market Revenue Million Forecast, by Region 2020 & 2033
- Table 6: Global Specialty Gas Market Volume K Tons Forecast, by Region 2020 & 2033
- Table 7: Global Specialty Gas Market Revenue Million Forecast, by Type 2020 & 2033
- Table 8: Global Specialty Gas Market Volume K Tons Forecast, by Type 2020 & 2033
- Table 9: Global Specialty Gas Market Revenue Million Forecast, by End-User Industry 2020 & 2033
- Table 10: Global Specialty Gas Market Volume K Tons Forecast, by End-User Industry 2020 & 2033
- Table 11: Global Specialty Gas Market Revenue Million Forecast, by Country 2020 & 2033
- Table 12: Global Specialty Gas Market Volume K Tons Forecast, by Country 2020 & 2033
- Table 13: China Specialty Gas Market Revenue (Million) Forecast, by Application 2020 & 2033
- Table 14: China Specialty Gas Market Volume (K Tons) Forecast, by Application 2020 & 2033
- Table 15: India Specialty Gas Market Revenue (Million) Forecast, by Application 2020 & 2033
- Table 16: India Specialty Gas Market Volume (K Tons) Forecast, by Application 2020 & 2033
- Table 17: Japan Specialty Gas Market Revenue (Million) Forecast, by Application 2020 & 2033
- Table 18: Japan Specialty Gas Market Volume (K Tons) Forecast, by Application 2020 & 2033
- Table 19: South Korea Specialty Gas Market Revenue (Million) Forecast, by Application 2020 & 2033
- Table 20: South Korea Specialty Gas Market Volume (K Tons) Forecast, by Application 2020 & 2033
- Table 21: Rest of Asia Pacific Specialty Gas Market Revenue (Million) Forecast, by Application 2020 & 2033
- Table 22: Rest of Asia Pacific Specialty Gas Market Volume (K Tons) Forecast, by Application 2020 & 2033
- Table 23: Global Specialty Gas Market Revenue Million Forecast, by Type 2020 & 2033
- Table 24: Global Specialty Gas Market Volume K Tons Forecast, by Type 2020 & 2033
- Table 25: Global Specialty Gas Market Revenue Million Forecast, by End-User Industry 2020 & 2033
- Table 26: Global Specialty Gas Market Volume K Tons Forecast, by End-User Industry 2020 & 2033
- Table 27: Global Specialty Gas Market Revenue Million Forecast, by Country 2020 & 2033
- Table 28: Global Specialty Gas Market Volume K Tons Forecast, by Country 2020 & 2033
- Table 29: United States Specialty Gas Market Revenue (Million) Forecast, by Application 2020 & 2033
- Table 30: United States Specialty Gas Market Volume (K Tons) Forecast, by Application 2020 & 2033
- Table 31: Canada Specialty Gas Market Revenue (Million) Forecast, by Application 2020 & 2033
- Table 32: Canada Specialty Gas Market Volume (K Tons) Forecast, by Application 2020 & 2033
- Table 33: Mexico Specialty Gas Market Revenue (Million) Forecast, by Application 2020 & 2033
- Table 34: Mexico Specialty Gas Market Volume (K Tons) Forecast, by Application 2020 & 2033
- Table 35: Rest of North America Specialty Gas Market Revenue (Million) Forecast, by Application 2020 & 2033
- Table 36: Rest of North America Specialty Gas Market Volume (K Tons) Forecast, by Application 2020 & 2033
- Table 37: Global Specialty Gas Market Revenue Million Forecast, by Type 2020 & 2033
- Table 38: Global Specialty Gas Market Volume K Tons Forecast, by Type 2020 & 2033
- Table 39: Global Specialty Gas Market Revenue Million Forecast, by End-User Industry 2020 & 2033
- Table 40: Global Specialty Gas Market Volume K Tons Forecast, by End-User Industry 2020 & 2033
- Table 41: Global Specialty Gas Market Revenue Million Forecast, by Country 2020 & 2033
- Table 42: Global Specialty Gas Market Volume K Tons Forecast, by Country 2020 & 2033
- Table 43: Germany Specialty Gas Market Revenue (Million) Forecast, by Application 2020 & 2033
- Table 44: Germany Specialty Gas Market Volume (K Tons) Forecast, by Application 2020 & 2033
- Table 45: United Kingdom Specialty Gas Market Revenue (Million) Forecast, by Application 2020 & 2033
- Table 46: United Kingdom Specialty Gas Market Volume (K Tons) Forecast, by Application 2020 & 2033
- Table 47: Italy Specialty Gas Market Revenue (Million) Forecast, by Application 2020 & 2033
- Table 48: Italy Specialty Gas Market Volume (K Tons) Forecast, by Application 2020 & 2033
- Table 49: France Specialty Gas Market Revenue (Million) Forecast, by Application 2020 & 2033
- Table 50: France Specialty Gas Market Volume (K Tons) Forecast, by Application 2020 & 2033
- Table 51: Rest of Europe Specialty Gas Market Revenue (Million) Forecast, by Application 2020 & 2033
- Table 52: Rest of Europe Specialty Gas Market Volume (K Tons) Forecast, by Application 2020 & 2033
- Table 53: Global Specialty Gas Market Revenue Million Forecast, by Type 2020 & 2033
- Table 54: Global Specialty Gas Market Volume K Tons Forecast, by Type 2020 & 2033
- Table 55: Global Specialty Gas Market Revenue Million Forecast, by End-User Industry 2020 & 2033
- Table 56: Global Specialty Gas Market Volume K Tons Forecast, by End-User Industry 2020 & 2033
- Table 57: Global Specialty Gas Market Revenue Million Forecast, by Country 2020 & 2033
- Table 58: Global Specialty Gas Market Volume K Tons Forecast, by Country 2020 & 2033
- Table 59: Brazil Specialty Gas Market Revenue (Million) Forecast, by Application 2020 & 2033
- Table 60: Brazil Specialty Gas Market Volume (K Tons) Forecast, by Application 2020 & 2033
- Table 61: Aregentina Specialty Gas Market Revenue (Million) Forecast, by Application 2020 & 2033
- Table 62: Aregentina Specialty Gas Market Volume (K Tons) Forecast, by Application 2020 & 2033
- Table 63: Rest of South America Specialty Gas Market Revenue (Million) Forecast, by Application 2020 & 2033
- Table 64: Rest of South America Specialty Gas Market Volume (K Tons) Forecast, by Application 2020 & 2033
- Table 65: Global Specialty Gas Market Revenue Million Forecast, by Type 2020 & 2033
- Table 66: Global Specialty Gas Market Volume K Tons Forecast, by Type 2020 & 2033
- Table 67: Global Specialty Gas Market Revenue Million Forecast, by End-User Industry 2020 & 2033
- Table 68: Global Specialty Gas Market Volume K Tons Forecast, by End-User Industry 2020 & 2033
- Table 69: Global Specialty Gas Market Revenue Million Forecast, by Country 2020 & 2033
- Table 70: Global Specialty Gas Market Volume K Tons Forecast, by Country 2020 & 2033
- Table 71: Saudi Arabia Specialty Gas Market Revenue (Million) Forecast, by Application 2020 & 2033
- Table 72: Saudi Arabia Specialty Gas Market Volume (K Tons) Forecast, by Application 2020 & 2033
- Table 73: South Africa Specialty Gas Market Revenue (Million) Forecast, by Application 2020 & 2033
- Table 74: South Africa Specialty Gas Market Volume (K Tons) Forecast, by Application 2020 & 2033
- Table 75: Rest of Middle East and Africa Specialty Gas Market Revenue (Million) Forecast, by Application 2020 & 2033
- Table 76: Rest of Middle East and Africa Specialty Gas Market Volume (K Tons) Forecast, by Application 2020 & 2033
Frequently Asked Questions
1. What is the projected Compound Annual Growth Rate (CAGR) of the Specialty Gas Market?
The projected CAGR is approximately > 4.00%.
2. Which companies are prominent players in the Specialty Gas Market?
Key companies in the market include Air Products and Chemicals Inc, MESA Specialty Gases & Equipment, Mitsui Chemicals Inc, ILMO Products Company*List Not Exhaustive, Iwatani Corporation of America, Linde plc, Messer Group GmbH, Air Liquide, Norco Inc, YUEYANG KAIMEITE ELECTRONIC AND SPECLALTY RARE GASES CO, SHOWA DENKO K K, Coregas.
3. What are the main segments of the Specialty Gas Market?
The market segments include Type, End-User Industry.
4. Can you provide details about the market size?
The market size is estimated to be USD 12570 Million as of 2022.
5. What are some drivers contributing to market growth?
Wide Applications in the Electronics Industry; Increasing Demand from the Healthcare Sector.
6. What are the notable trends driving market growth?
Electronics Sector to Drive the Specialty Gas Market.
7. Are there any restraints impacting market growth?
Stringent Environmental Regulations and Restrictions on Specialty Gas Production and Quality Control; Other Restraints.
8. Can you provide examples of recent developments in the market?
February 2023: Linde announced a long-term arrangement with OCI to supply clean hydrogen and other industrial gases to the company's new world-scale blue ammonia factory in Beaumont, Texas. Linde will construct, own, and manage an on-site complex that will supply OCI's 1.1 million tons of blue ammonia production with clean hydrogen and nitrogen per year. Linde will provide clean hydrogen to OCI by sequestering more than 1.7 million tons of CO2 emissions yearly.
9. What pricing options are available for accessing the report?
Pricing options include single-user, multi-user, and enterprise licenses priced at USD 4750, USD 5250, and USD 8750 respectively.
10. Is the market size provided in terms of value or volume?
The market size is provided in terms of value, measured in Million and volume, measured in K Tons.
11. Are there any specific market keywords associated with the report?
Yes, the market keyword associated with the report is "Specialty Gas Market," which aids in identifying and referencing the specific market segment covered.
12. How do I determine which pricing option suits my needs best?
The pricing options vary based on user requirements and access needs. Individual users may opt for single-user licenses, while businesses requiring broader access may choose multi-user or enterprise licenses for cost-effective access to the report.
13. Are there any additional resources or data provided in the Specialty Gas Market report?
While the report offers comprehensive insights, it's advisable to review the specific contents or supplementary materials provided to ascertain if additional resources or data are available.
14. How can I stay updated on further developments or reports in the Specialty Gas Market?
To stay informed about further developments, trends, and reports in the Specialty Gas Market, consider subscribing to industry newsletters, following relevant companies and organizations, or regularly checking reputable industry news sources and publications.
Methodology
Step 1 - Identification of Relevant Samples Size from Population Database


Step 2 - Approaches for Defining Global Market Size (Value, Volume* & Price*)

Note*: In applicable scenarios
Step 3 - Data Sources
Primary Research
- Web Analytics
- Survey Reports
- Research Institute
- Latest Research Reports
- Opinion Leaders
Secondary Research
- Annual Reports
- White Paper
- Latest Press Release
- Industry Association
- Paid Database
- Investor Presentations

Step 4 - Data Triangulation
Involves using different sources of information in order to increase the validity of a study
These sources are likely to be stakeholders in a program - participants, other researchers, program staff, other community members, and so on.
Then we put all data in single framework & apply various statistical tools to find out the dynamic on the market.
During the analysis stage, feedback from the stakeholder groups would be compared to determine areas of agreement as well as areas of divergence