

Key Insights
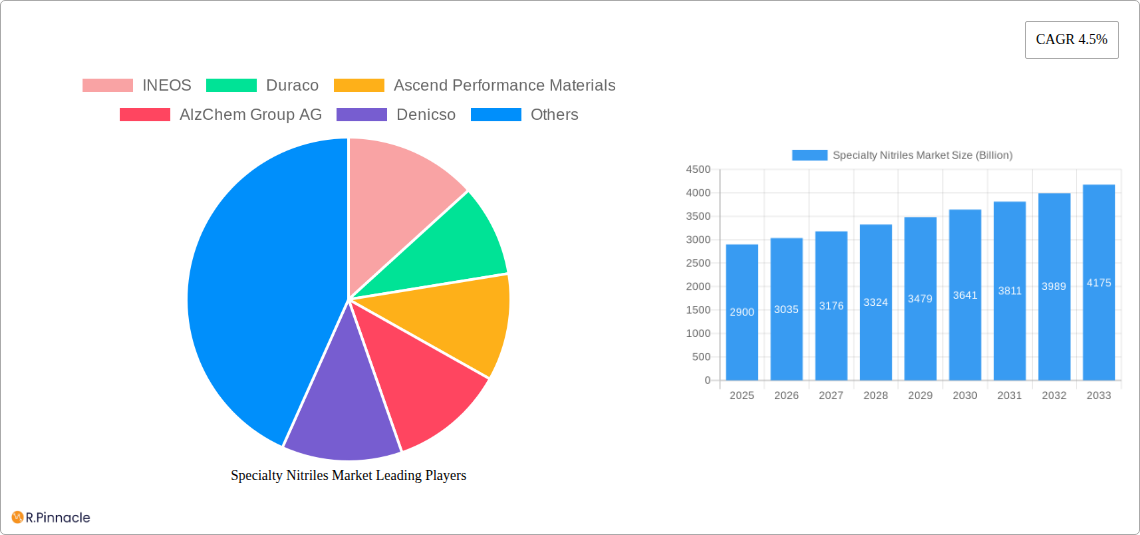
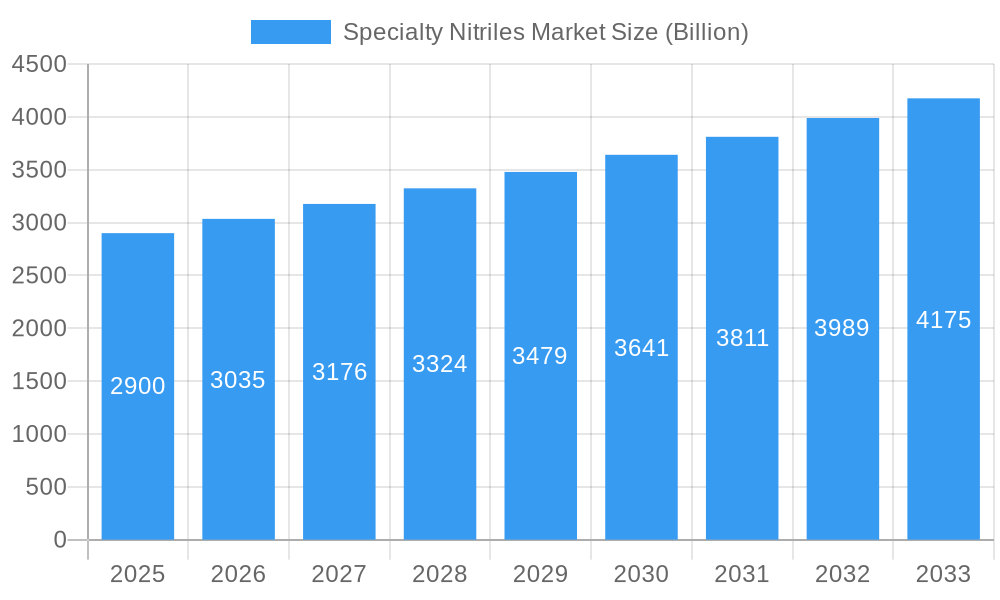
The Specialty Nitriles market, valued at $2.9 billion in 2025, is projected to experience robust growth, driven by increasing demand from key application sectors. The compound annual growth rate (CAGR) of 4.5% from 2025 to 2033 indicates a significant expansion of this market over the forecast period. Several factors contribute to this growth. The automotive industry's continuous development of advanced materials, coupled with the rising adoption of nitrile-based protective equipment in healthcare and industrial settings, significantly boosts market demand. Furthermore, the expanding electronics sector, requiring specialized nitrile-based components for insulation and durability, fuels market expansion. Growth is also being driven by innovations in manufacturing processes, particularly in the development of more efficient and sustainable methodologies like improved ammoxidation and hydrocyanation techniques, leading to enhanced product quality and reduced production costs. The increasing use of specialty nitriles in adhesives and sealants, as well as oilfield applications demanding high-performance materials, further fuels market expansion.
Specialty Nitriles Market Market Size (In Billion)
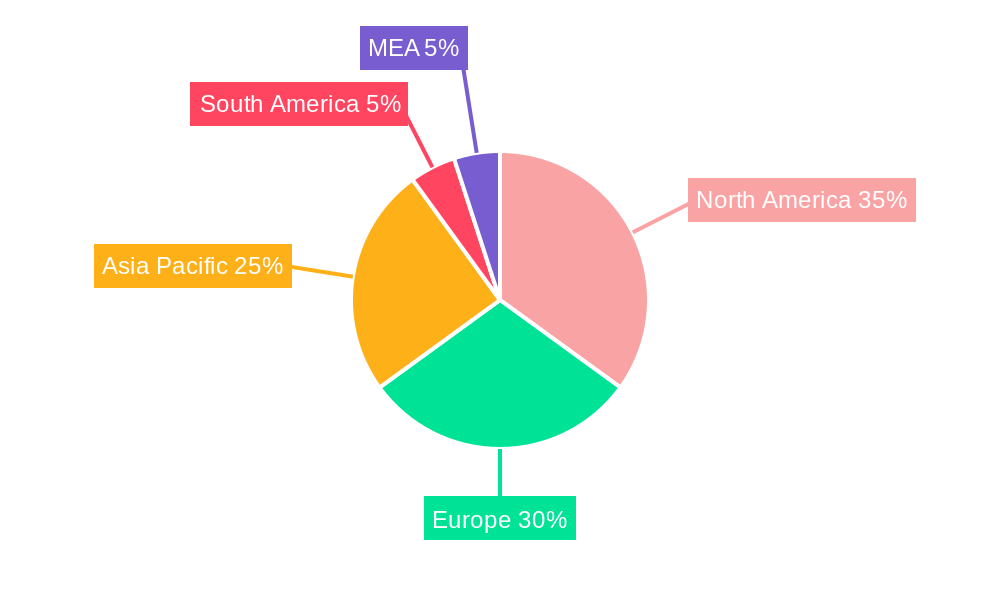
Market segmentation reveals that Nitrile Butadiene Rubber (NBR) and Hydrogenated Nitrile Butadiene Rubber (HNBR) currently dominate the types segment, owing to their versatile properties and wide applications. However, the “Others” segment, encompassing newer specialized nitrile compounds, is expected to witness substantial growth, driven by ongoing research and development focused on tailored properties for niche applications. Geographically, North America and Europe currently hold significant market share, benefiting from established industries and robust infrastructure. However, the Asia-Pacific region is projected to demonstrate the fastest growth due to rapid industrialization, increasing manufacturing activities, and a rising middle class driving increased demand for consumer goods. Competition in the market is characterized by a mix of large multinational corporations and specialized chemical manufacturers, highlighting a dynamic landscape ripe for innovation and strategic partnerships.
Specialty Nitriles Market Company Market Share
Specialty Nitriles Market: A Comprehensive Report (2019-2033)
This in-depth report provides a comprehensive analysis of the Specialty Nitriles Market, offering valuable insights for industry professionals, investors, and strategic decision-makers. The report covers the period from 2019 to 2033, with a focus on the estimated year 2025 and a forecast period of 2025-2033. The market is segmented by manufacturing process (Ammoxidation, Hydrocyanation), type (Nitrile Butadiene Rubber, Hydrogenated Nitrile Butadiene Rubber, Others), and application (Protective Gloves, Automotive Components, Electronic Components, Adhesives & Sealants, Oilfield Applications, Others). The global market is projected to reach xx Billion by 2033, exhibiting a robust CAGR of xx% during the forecast period.
Specialty Nitriles Market Market Structure & Innovation Trends
The Specialty Nitriles market exhibits a moderately concentrated structure, with key players like INEOS, Duraco, and Ascend Performance Materials holding significant market share. The market share of the top 5 players is estimated at xx%, indicating a degree of consolidation. Innovation is driven by the increasing demand for high-performance materials in diverse applications, particularly in the automotive and electronics sectors. Regulatory frameworks, such as those concerning environmental regulations and product safety, significantly influence market dynamics. Product substitutes, primarily based on alternative elastomers, pose a competitive threat. The market has witnessed several M&A activities in recent years, with deal values totaling xx Billion over the historical period (2019-2024), largely driven by consolidation strategies and expansion into new geographical regions. End-user demographics are shifting towards applications requiring enhanced durability, flexibility, and chemical resistance.
- Market Concentration: Top 5 players hold xx% market share.
- Innovation Drivers: Demand for high-performance materials; stringent regulatory requirements; technological advancements in synthesis methods.
- M&A Activity: xx Billion in deal value (2019-2024).
Specialty Nitriles Market Market Dynamics & Trends
The Specialty Nitriles market is experiencing robust growth, primarily driven by increasing demand from automotive, electronics, and healthcare sectors. The rising adoption of advanced materials in automotive components, such as seals and gaskets, fuels market expansion. Technological advancements in manufacturing processes, such as improvements in hydrocyanation efficiency, contribute to cost reduction and enhanced product quality. Consumer preferences are shifting towards eco-friendly and sustainable materials, influencing the demand for specialty nitriles with reduced environmental impact. Competitive dynamics are intense, with established players focusing on innovation, capacity expansion, and strategic partnerships. The market is expected to witness a CAGR of xx% during the forecast period (2025-2033), with market penetration expected to increase significantly in emerging economies. Technological disruptions, such as the development of biodegradable nitriles, will reshape the market landscape in the coming years.
Dominant Regions & Segments in Specialty Nitriles Market
The Asia Pacific region dominates the global Specialty Nitriles market, driven by rapid industrialization, significant automotive production, and increasing demand from the electronics industry. Within this region, China and India are major contributors to market growth due to their burgeoning manufacturing sectors and supportive government policies.
Key Drivers:
- Asia Pacific: Rapid industrialization, automotive growth, and robust electronics sector. Strong government support for manufacturing.
- North America: Established automotive industry and strong demand from specialized applications.
- Europe: Focus on high-performance materials and stringent environmental regulations.
Segment Dominance:
- Manufacturing Process: Hydrocyanation holds a larger market share due to its higher efficiency and ability to produce specific nitrile types.
- Type: Nitrile Butadiene Rubber (NBR) accounts for the largest share due to its widespread applications in various industries.
- Application: Protective gloves and automotive components represent major application segments. Demand from oilfield applications is expected to witness significant growth.
Specialty Nitriles Market Product Innovations
Recent product innovations focus on developing specialty nitriles with enhanced properties like improved resistance to heat, chemicals, and oil. These advanced materials find applications in demanding environments and high-performance products. Companies are also focusing on developing sustainable and biodegradable nitrile products to meet the growing demand for environmentally friendly materials. This focus on enhancing properties and environmental considerations provides significant competitive advantages in the market.
Report Scope & Segmentation Analysis
This report comprehensively analyzes the Specialty Nitriles market across various segments:
- Manufacturing Process: Ammoxidation and Hydrocyanation, with detailed analysis of market size, growth projections, and competitive dynamics for each.
- Type: Nitrile Butadiene Rubber (NBR), Hydrogenated Nitrile Butadiene Rubber (HNBR), and Others, including market size, growth projections, and competitive landscape.
- Application: Protective Gloves, Automotive Components, Electronic Components, Adhesives & Sealants, Oilfield Applications, and Others, providing analysis of segment size, growth drivers, and competitive landscape.
Key Drivers of Specialty Nitriles Market Growth
The Specialty Nitriles market is experiencing significant growth fueled by several factors: increasing demand from diverse end-use sectors like automotive, healthcare, and oil & gas; technological advancements leading to improved product performance and cost efficiency; and supportive government policies promoting industrial growth in key regions. The growing adoption of advanced materials in automotive components and the rise of renewable energy sources contribute significantly to market expansion.
Challenges in the Specialty Nitriles Market Sector
The Specialty Nitriles market faces challenges such as fluctuating raw material prices, stringent environmental regulations, and intense competition. Supply chain disruptions can impact production and pricing, while strict regulations necessitate costly compliance measures. The presence of established players and the emergence of new entrants creates competitive pressures that influence pricing and market share.
Emerging Opportunities in Specialty Nitriles Market
Emerging opportunities lie in the development of sustainable and biodegradable nitriles, expanding into new applications like renewable energy and advanced electronics, and penetrating emerging markets with high growth potential. Technological advancements, especially in material science and manufacturing processes, offer scope for further innovation and market expansion. Growing focus on sustainable solutions opens avenues for environmentally friendly products.
Leading Players in the Specialty Nitriles Market Market
- INEOS
- Duraco
- Ascend Performance Materials
- AlzChem Group AG
- Denicso
- Speciality Tapes
- TIDI Products LLC
- Emerald Performance Materials
- Parchem fine & specialty chemicals
- Marco Rubber & Plastics LLC
- Zeon Chemicals L P
Key Developments in Specialty Nitriles Market Industry
- January 2023: INEOS announced a new production facility for specialty nitriles in [Location].
- June 2022: Ascend Performance Materials launched a new line of high-performance HNBR.
- October 2021: Duraco acquired a smaller specialty nitrile producer, expanding its market reach. (Further developments to be added)
Future Outlook for Specialty Nitriles Market Market
The Specialty Nitriles market is poised for continued growth, driven by increasing demand from key sectors and technological advancements. Strategic partnerships, capacity expansions, and product innovation will be crucial for success. The growing focus on sustainability will shape future market trends, favoring companies that prioritize eco-friendly solutions. The market presents lucrative opportunities for both established players and new entrants.
Specialty Nitriles Market Segmentation
-
1. Manufacturing Process
- 1.1. Ammoxidation
- 1.2. Hydrocyanation
-
2. Types
- 2.1. Nitrile Butadiene Rubber
- 2.2. Hydrogenated Nitrile Butadiene Rubber
- 2.3. Others
-
3. Application
- 3.1. Protective Gloves
- 3.2. Automotive Components
- 3.3. Electronic Components
- 3.4. Adhesives & Sealants
- 3.5. Oilfield Applications
- 3.6. Others
Specialty Nitriles Market Segmentation By Geography
-
1. Asia Pacific
- 1.1. China
- 1.2. India
- 1.3. Japan
- 1.4. South Korea
- 1.5. Rest of Asia Pacific
-
2. North America
- 2.1. United States
- 2.2. Canada
- 2.3. Mexico
-
3. Europe
- 3.1. Germany
- 3.2. United Kingdom
- 3.3. France
- 3.4. Italy
- 3.5. Rest of Europe
-
4. South America
- 4.1. Brazil
- 4.2. Argentina
- 4.3. Rest of South America
-
5. Middle East and Africa
- 5.1. Saudi Arabia
- 5.2. South Africa
- 5.3. Rest of Middle East and Africa
Specialty Nitriles Market Regional Market Share
Geographic Coverage of Specialty Nitriles Market
Specialty Nitriles Market REPORT HIGHLIGHTS
| Aspects | Details |
|---|---|
| Study Period | 2020-2034 |
| Base Year | 2025 |
| Estimated Year | 2026 |
| Forecast Period | 2026-2034 |
| Historical Period | 2020-2025 |
| Growth Rate | CAGR of 4.5% from 2020-2034 |
| Segmentation |
|
Table of Contents
- 1. Introduction
- 1.1. Research Scope
- 1.2. Market Segmentation
- 1.3. Research Objective
- 1.4. Definitions and Assumptions
- 2. Executive Summary
- 2.1. Market Snapshot
- 3. Market Dynamics
- 3.1. Market Drivers
- 3.2. Market Restrains
- 3.3. Market Trends
- 3.4. Market Opportunities
- 4. Market Factor Analysis
- 4.1. Porters Five Forces
- 4.1.1. Bargaining Power of Suppliers
- 4.1.2. Bargaining Power of Buyers
- 4.1.3. Threat of New Entrants
- 4.1.4. Threat of Substitutes
- 4.1.5. Competitive Rivalry
- 4.2. PESTEL analysis
- 4.3. BCG Analysis
- 4.3.1. Stars (High Growth, High Market Share)
- 4.3.2. Cash Cows (Low Growth, High Market Share)
- 4.3.3. Question Mark (High Growth, Low Market Share)
- 4.3.4. Dogs (Low Growth, Low Market Share)
- 4.4. Ansoff Matrix Analysis
- 4.5. Supply Chain Analysis
- 4.6. Regulatory Landscape
- 4.7. Current Market Potential and Opportunity Assessment (TAM–SAM–SOM Framework)
- 4.8. PRI Analyst Note
- 4.1. Porters Five Forces
- 5. Market Analysis, Insights and Forecast 2021-2033
- 5.1. Market Analysis, Insights and Forecast - by Manufacturing Process
- 5.1.1. Ammoxidation
- 5.1.2. Hydrocyanation
- 5.2. Market Analysis, Insights and Forecast - by Types
- 5.2.1. Nitrile Butadiene Rubber
- 5.2.2. Hydrogenated Nitrile Butadiene Rubber
- 5.2.3. Others
- 5.3. Market Analysis, Insights and Forecast - by Application
- 5.3.1. Protective Gloves
- 5.3.2. Automotive Components
- 5.3.3. Electronic Components
- 5.3.4. Adhesives & Sealants
- 5.3.5. Oilfield Applications
- 5.3.6. Others
- 5.4. Market Analysis, Insights and Forecast - by Region
- 5.4.1. Asia Pacific
- 5.4.2. North America
- 5.4.3. Europe
- 5.4.4. South America
- 5.4.5. Middle East and Africa
- 5.1. Market Analysis, Insights and Forecast - by Manufacturing Process
- 6. Global Specialty Nitriles Market Analysis, Insights and Forecast, 2021-2033
- 6.1. Market Analysis, Insights and Forecast - by Manufacturing Process
- 6.1.1. Ammoxidation
- 6.1.2. Hydrocyanation
- 6.2. Market Analysis, Insights and Forecast - by Types
- 6.2.1. Nitrile Butadiene Rubber
- 6.2.2. Hydrogenated Nitrile Butadiene Rubber
- 6.2.3. Others
- 6.3. Market Analysis, Insights and Forecast - by Application
- 6.3.1. Protective Gloves
- 6.3.2. Automotive Components
- 6.3.3. Electronic Components
- 6.3.4. Adhesives & Sealants
- 6.3.5. Oilfield Applications
- 6.3.6. Others
- 6.1. Market Analysis, Insights and Forecast - by Manufacturing Process
- 7. Asia Pacific Specialty Nitriles Market Analysis, Insights and Forecast, 2020-2032
- 7.1. Market Analysis, Insights and Forecast - by Manufacturing Process
- 7.1.1. Ammoxidation
- 7.1.2. Hydrocyanation
- 7.2. Market Analysis, Insights and Forecast - by Types
- 7.2.1. Nitrile Butadiene Rubber
- 7.2.2. Hydrogenated Nitrile Butadiene Rubber
- 7.2.3. Others
- 7.3. Market Analysis, Insights and Forecast - by Application
- 7.3.1. Protective Gloves
- 7.3.2. Automotive Components
- 7.3.3. Electronic Components
- 7.3.4. Adhesives & Sealants
- 7.3.5. Oilfield Applications
- 7.3.6. Others
- 7.1. Market Analysis, Insights and Forecast - by Manufacturing Process
- 8. North America Specialty Nitriles Market Analysis, Insights and Forecast, 2020-2032
- 8.1. Market Analysis, Insights and Forecast - by Manufacturing Process
- 8.1.1. Ammoxidation
- 8.1.2. Hydrocyanation
- 8.2. Market Analysis, Insights and Forecast - by Types
- 8.2.1. Nitrile Butadiene Rubber
- 8.2.2. Hydrogenated Nitrile Butadiene Rubber
- 8.2.3. Others
- 8.3. Market Analysis, Insights and Forecast - by Application
- 8.3.1. Protective Gloves
- 8.3.2. Automotive Components
- 8.3.3. Electronic Components
- 8.3.4. Adhesives & Sealants
- 8.3.5. Oilfield Applications
- 8.3.6. Others
- 8.1. Market Analysis, Insights and Forecast - by Manufacturing Process
- 9. Europe Specialty Nitriles Market Analysis, Insights and Forecast, 2020-2032
- 9.1. Market Analysis, Insights and Forecast - by Manufacturing Process
- 9.1.1. Ammoxidation
- 9.1.2. Hydrocyanation
- 9.2. Market Analysis, Insights and Forecast - by Types
- 9.2.1. Nitrile Butadiene Rubber
- 9.2.2. Hydrogenated Nitrile Butadiene Rubber
- 9.2.3. Others
- 9.3. Market Analysis, Insights and Forecast - by Application
- 9.3.1. Protective Gloves
- 9.3.2. Automotive Components
- 9.3.3. Electronic Components
- 9.3.4. Adhesives & Sealants
- 9.3.5. Oilfield Applications
- 9.3.6. Others
- 9.1. Market Analysis, Insights and Forecast - by Manufacturing Process
- 10. South America Specialty Nitriles Market Analysis, Insights and Forecast, 2020-2032
- 10.1. Market Analysis, Insights and Forecast - by Manufacturing Process
- 10.1.1. Ammoxidation
- 10.1.2. Hydrocyanation
- 10.2. Market Analysis, Insights and Forecast - by Types
- 10.2.1. Nitrile Butadiene Rubber
- 10.2.2. Hydrogenated Nitrile Butadiene Rubber
- 10.2.3. Others
- 10.3. Market Analysis, Insights and Forecast - by Application
- 10.3.1. Protective Gloves
- 10.3.2. Automotive Components
- 10.3.3. Electronic Components
- 10.3.4. Adhesives & Sealants
- 10.3.5. Oilfield Applications
- 10.3.6. Others
- 10.1. Market Analysis, Insights and Forecast - by Manufacturing Process
- 11. Middle East and Africa Specialty Nitriles Market Analysis, Insights and Forecast, 2020-2032
- 11.1. Market Analysis, Insights and Forecast - by Manufacturing Process
- 11.1.1. Ammoxidation
- 11.1.2. Hydrocyanation
- 11.2. Market Analysis, Insights and Forecast - by Types
- 11.2.1. Nitrile Butadiene Rubber
- 11.2.2. Hydrogenated Nitrile Butadiene Rubber
- 11.2.3. Others
- 11.3. Market Analysis, Insights and Forecast - by Application
- 11.3.1. Protective Gloves
- 11.3.2. Automotive Components
- 11.3.3. Electronic Components
- 11.3.4. Adhesives & Sealants
- 11.3.5. Oilfield Applications
- 11.3.6. Others
- 11.1. Market Analysis, Insights and Forecast - by Manufacturing Process
- 12. Competitive Analysis
- 12.1. Company Profiles
- 12.1.1 INEOS
- 12.1.1.1. Company Overview
- 12.1.1.2. Products
- 12.1.1.3. Company Financials
- 12.1.1.4. SWOT Analysis
- 12.1.2 Duraco
- 12.1.2.1. Company Overview
- 12.1.2.2. Products
- 12.1.2.3. Company Financials
- 12.1.2.4. SWOT Analysis
- 12.1.3 Ascend Performance Materials
- 12.1.3.1. Company Overview
- 12.1.3.2. Products
- 12.1.3.3. Company Financials
- 12.1.3.4. SWOT Analysis
- 12.1.4 AlzChem Group AG
- 12.1.4.1. Company Overview
- 12.1.4.2. Products
- 12.1.4.3. Company Financials
- 12.1.4.4. SWOT Analysis
- 12.1.5 Denicso
- 12.1.5.1. Company Overview
- 12.1.5.2. Products
- 12.1.5.3. Company Financials
- 12.1.5.4. SWOT Analysis
- 12.1.6 Speciality Tapes
- 12.1.6.1. Company Overview
- 12.1.6.2. Products
- 12.1.6.3. Company Financials
- 12.1.6.4. SWOT Analysis
- 12.1.7 TIDI Products LLC
- 12.1.7.1. Company Overview
- 12.1.7.2. Products
- 12.1.7.3. Company Financials
- 12.1.7.4. SWOT Analysis
- 12.1.8 Emerald Performance Materials
- 12.1.8.1. Company Overview
- 12.1.8.2. Products
- 12.1.8.3. Company Financials
- 12.1.8.4. SWOT Analysis
- 12.1.9 Parchem fine & specialty chemicals
- 12.1.9.1. Company Overview
- 12.1.9.2. Products
- 12.1.9.3. Company Financials
- 12.1.9.4. SWOT Analysis
- 12.1.10 Marco Rubber & Plastics LLC
- 12.1.10.1. Company Overview
- 12.1.10.2. Products
- 12.1.10.3. Company Financials
- 12.1.10.4. SWOT Analysis
- 12.1.11 Zeon Chemicals L P
- 12.1.11.1. Company Overview
- 12.1.11.2. Products
- 12.1.11.3. Company Financials
- 12.1.11.4. SWOT Analysis
- 12.1.1 INEOS
- 12.2. Market Entropy
- 12.2.1 Company's Key Areas Served
- 12.2.2 Recent Developments
- 12.3. Company Market Share Analysis 2025
- 12.3.1 Top 5 Companies Market Share Analysis
- 12.3.2 Top 3 Companies Market Share Analysis
- 12.4. List of Potential Customers
- 13. Research Methodology
List of Figures
- Figure 1: Global Specialty Nitriles Market Revenue Breakdown (Billion, %) by Region 2025 & 2033
- Figure 2: Global Specialty Nitriles Market Volume Breakdown (K Tons, %) by Region 2025 & 2033
- Figure 3: Asia Pacific Specialty Nitriles Market Revenue (Billion), by Manufacturing Process 2025 & 2033
- Figure 4: Asia Pacific Specialty Nitriles Market Volume (K Tons), by Manufacturing Process 2025 & 2033
- Figure 5: Asia Pacific Specialty Nitriles Market Revenue Share (%), by Manufacturing Process 2025 & 2033
- Figure 6: Asia Pacific Specialty Nitriles Market Volume Share (%), by Manufacturing Process 2025 & 2033
- Figure 7: Asia Pacific Specialty Nitriles Market Revenue (Billion), by Types 2025 & 2033
- Figure 8: Asia Pacific Specialty Nitriles Market Volume (K Tons), by Types 2025 & 2033
- Figure 9: Asia Pacific Specialty Nitriles Market Revenue Share (%), by Types 2025 & 2033
- Figure 10: Asia Pacific Specialty Nitriles Market Volume Share (%), by Types 2025 & 2033
- Figure 11: Asia Pacific Specialty Nitriles Market Revenue (Billion), by Application 2025 & 2033
- Figure 12: Asia Pacific Specialty Nitriles Market Volume (K Tons), by Application 2025 & 2033
- Figure 13: Asia Pacific Specialty Nitriles Market Revenue Share (%), by Application 2025 & 2033
- Figure 14: Asia Pacific Specialty Nitriles Market Volume Share (%), by Application 2025 & 2033
- Figure 15: Asia Pacific Specialty Nitriles Market Revenue (Billion), by Country 2025 & 2033
- Figure 16: Asia Pacific Specialty Nitriles Market Volume (K Tons), by Country 2025 & 2033
- Figure 17: Asia Pacific Specialty Nitriles Market Revenue Share (%), by Country 2025 & 2033
- Figure 18: Asia Pacific Specialty Nitriles Market Volume Share (%), by Country 2025 & 2033
- Figure 19: North America Specialty Nitriles Market Revenue (Billion), by Manufacturing Process 2025 & 2033
- Figure 20: North America Specialty Nitriles Market Volume (K Tons), by Manufacturing Process 2025 & 2033
- Figure 21: North America Specialty Nitriles Market Revenue Share (%), by Manufacturing Process 2025 & 2033
- Figure 22: North America Specialty Nitriles Market Volume Share (%), by Manufacturing Process 2025 & 2033
- Figure 23: North America Specialty Nitriles Market Revenue (Billion), by Types 2025 & 2033
- Figure 24: North America Specialty Nitriles Market Volume (K Tons), by Types 2025 & 2033
- Figure 25: North America Specialty Nitriles Market Revenue Share (%), by Types 2025 & 2033
- Figure 26: North America Specialty Nitriles Market Volume Share (%), by Types 2025 & 2033
- Figure 27: North America Specialty Nitriles Market Revenue (Billion), by Application 2025 & 2033
- Figure 28: North America Specialty Nitriles Market Volume (K Tons), by Application 2025 & 2033
- Figure 29: North America Specialty Nitriles Market Revenue Share (%), by Application 2025 & 2033
- Figure 30: North America Specialty Nitriles Market Volume Share (%), by Application 2025 & 2033
- Figure 31: North America Specialty Nitriles Market Revenue (Billion), by Country 2025 & 2033
- Figure 32: North America Specialty Nitriles Market Volume (K Tons), by Country 2025 & 2033
- Figure 33: North America Specialty Nitriles Market Revenue Share (%), by Country 2025 & 2033
- Figure 34: North America Specialty Nitriles Market Volume Share (%), by Country 2025 & 2033
- Figure 35: Europe Specialty Nitriles Market Revenue (Billion), by Manufacturing Process 2025 & 2033
- Figure 36: Europe Specialty Nitriles Market Volume (K Tons), by Manufacturing Process 2025 & 2033
- Figure 37: Europe Specialty Nitriles Market Revenue Share (%), by Manufacturing Process 2025 & 2033
- Figure 38: Europe Specialty Nitriles Market Volume Share (%), by Manufacturing Process 2025 & 2033
- Figure 39: Europe Specialty Nitriles Market Revenue (Billion), by Types 2025 & 2033
- Figure 40: Europe Specialty Nitriles Market Volume (K Tons), by Types 2025 & 2033
- Figure 41: Europe Specialty Nitriles Market Revenue Share (%), by Types 2025 & 2033
- Figure 42: Europe Specialty Nitriles Market Volume Share (%), by Types 2025 & 2033
- Figure 43: Europe Specialty Nitriles Market Revenue (Billion), by Application 2025 & 2033
- Figure 44: Europe Specialty Nitriles Market Volume (K Tons), by Application 2025 & 2033
- Figure 45: Europe Specialty Nitriles Market Revenue Share (%), by Application 2025 & 2033
- Figure 46: Europe Specialty Nitriles Market Volume Share (%), by Application 2025 & 2033
- Figure 47: Europe Specialty Nitriles Market Revenue (Billion), by Country 2025 & 2033
- Figure 48: Europe Specialty Nitriles Market Volume (K Tons), by Country 2025 & 2033
- Figure 49: Europe Specialty Nitriles Market Revenue Share (%), by Country 2025 & 2033
- Figure 50: Europe Specialty Nitriles Market Volume Share (%), by Country 2025 & 2033
- Figure 51: South America Specialty Nitriles Market Revenue (Billion), by Manufacturing Process 2025 & 2033
- Figure 52: South America Specialty Nitriles Market Volume (K Tons), by Manufacturing Process 2025 & 2033
- Figure 53: South America Specialty Nitriles Market Revenue Share (%), by Manufacturing Process 2025 & 2033
- Figure 54: South America Specialty Nitriles Market Volume Share (%), by Manufacturing Process 2025 & 2033
- Figure 55: South America Specialty Nitriles Market Revenue (Billion), by Types 2025 & 2033
- Figure 56: South America Specialty Nitriles Market Volume (K Tons), by Types 2025 & 2033
- Figure 57: South America Specialty Nitriles Market Revenue Share (%), by Types 2025 & 2033
- Figure 58: South America Specialty Nitriles Market Volume Share (%), by Types 2025 & 2033
- Figure 59: South America Specialty Nitriles Market Revenue (Billion), by Application 2025 & 2033
- Figure 60: South America Specialty Nitriles Market Volume (K Tons), by Application 2025 & 2033
- Figure 61: South America Specialty Nitriles Market Revenue Share (%), by Application 2025 & 2033
- Figure 62: South America Specialty Nitriles Market Volume Share (%), by Application 2025 & 2033
- Figure 63: South America Specialty Nitriles Market Revenue (Billion), by Country 2025 & 2033
- Figure 64: South America Specialty Nitriles Market Volume (K Tons), by Country 2025 & 2033
- Figure 65: South America Specialty Nitriles Market Revenue Share (%), by Country 2025 & 2033
- Figure 66: South America Specialty Nitriles Market Volume Share (%), by Country 2025 & 2033
- Figure 67: Middle East and Africa Specialty Nitriles Market Revenue (Billion), by Manufacturing Process 2025 & 2033
- Figure 68: Middle East and Africa Specialty Nitriles Market Volume (K Tons), by Manufacturing Process 2025 & 2033
- Figure 69: Middle East and Africa Specialty Nitriles Market Revenue Share (%), by Manufacturing Process 2025 & 2033
- Figure 70: Middle East and Africa Specialty Nitriles Market Volume Share (%), by Manufacturing Process 2025 & 2033
- Figure 71: Middle East and Africa Specialty Nitriles Market Revenue (Billion), by Types 2025 & 2033
- Figure 72: Middle East and Africa Specialty Nitriles Market Volume (K Tons), by Types 2025 & 2033
- Figure 73: Middle East and Africa Specialty Nitriles Market Revenue Share (%), by Types 2025 & 2033
- Figure 74: Middle East and Africa Specialty Nitriles Market Volume Share (%), by Types 2025 & 2033
- Figure 75: Middle East and Africa Specialty Nitriles Market Revenue (Billion), by Application 2025 & 2033
- Figure 76: Middle East and Africa Specialty Nitriles Market Volume (K Tons), by Application 2025 & 2033
- Figure 77: Middle East and Africa Specialty Nitriles Market Revenue Share (%), by Application 2025 & 2033
- Figure 78: Middle East and Africa Specialty Nitriles Market Volume Share (%), by Application 2025 & 2033
- Figure 79: Middle East and Africa Specialty Nitriles Market Revenue (Billion), by Country 2025 & 2033
- Figure 80: Middle East and Africa Specialty Nitriles Market Volume (K Tons), by Country 2025 & 2033
- Figure 81: Middle East and Africa Specialty Nitriles Market Revenue Share (%), by Country 2025 & 2033
- Figure 82: Middle East and Africa Specialty Nitriles Market Volume Share (%), by Country 2025 & 2033
List of Tables
- Table 1: Global Specialty Nitriles Market Revenue Billion Forecast, by Manufacturing Process 2020 & 2033
- Table 2: Global Specialty Nitriles Market Volume K Tons Forecast, by Manufacturing Process 2020 & 2033
- Table 3: Global Specialty Nitriles Market Revenue Billion Forecast, by Types 2020 & 2033
- Table 4: Global Specialty Nitriles Market Volume K Tons Forecast, by Types 2020 & 2033
- Table 5: Global Specialty Nitriles Market Revenue Billion Forecast, by Application 2020 & 2033
- Table 6: Global Specialty Nitriles Market Volume K Tons Forecast, by Application 2020 & 2033
- Table 7: Global Specialty Nitriles Market Revenue Billion Forecast, by Region 2020 & 2033
- Table 8: Global Specialty Nitriles Market Volume K Tons Forecast, by Region 2020 & 2033
- Table 9: Global Specialty Nitriles Market Revenue Billion Forecast, by Manufacturing Process 2020 & 2033
- Table 10: Global Specialty Nitriles Market Volume K Tons Forecast, by Manufacturing Process 2020 & 2033
- Table 11: Global Specialty Nitriles Market Revenue Billion Forecast, by Types 2020 & 2033
- Table 12: Global Specialty Nitriles Market Volume K Tons Forecast, by Types 2020 & 2033
- Table 13: Global Specialty Nitriles Market Revenue Billion Forecast, by Application 2020 & 2033
- Table 14: Global Specialty Nitriles Market Volume K Tons Forecast, by Application 2020 & 2033
- Table 15: Global Specialty Nitriles Market Revenue Billion Forecast, by Country 2020 & 2033
- Table 16: Global Specialty Nitriles Market Volume K Tons Forecast, by Country 2020 & 2033
- Table 17: China Specialty Nitriles Market Revenue (Billion) Forecast, by Application 2020 & 2033
- Table 18: China Specialty Nitriles Market Volume (K Tons) Forecast, by Application 2020 & 2033
- Table 19: India Specialty Nitriles Market Revenue (Billion) Forecast, by Application 2020 & 2033
- Table 20: India Specialty Nitriles Market Volume (K Tons) Forecast, by Application 2020 & 2033
- Table 21: Japan Specialty Nitriles Market Revenue (Billion) Forecast, by Application 2020 & 2033
- Table 22: Japan Specialty Nitriles Market Volume (K Tons) Forecast, by Application 2020 & 2033
- Table 23: South Korea Specialty Nitriles Market Revenue (Billion) Forecast, by Application 2020 & 2033
- Table 24: South Korea Specialty Nitriles Market Volume (K Tons) Forecast, by Application 2020 & 2033
- Table 25: Rest of Asia Pacific Specialty Nitriles Market Revenue (Billion) Forecast, by Application 2020 & 2033
- Table 26: Rest of Asia Pacific Specialty Nitriles Market Volume (K Tons) Forecast, by Application 2020 & 2033
- Table 27: Global Specialty Nitriles Market Revenue Billion Forecast, by Manufacturing Process 2020 & 2033
- Table 28: Global Specialty Nitriles Market Volume K Tons Forecast, by Manufacturing Process 2020 & 2033
- Table 29: Global Specialty Nitriles Market Revenue Billion Forecast, by Types 2020 & 2033
- Table 30: Global Specialty Nitriles Market Volume K Tons Forecast, by Types 2020 & 2033
- Table 31: Global Specialty Nitriles Market Revenue Billion Forecast, by Application 2020 & 2033
- Table 32: Global Specialty Nitriles Market Volume K Tons Forecast, by Application 2020 & 2033
- Table 33: Global Specialty Nitriles Market Revenue Billion Forecast, by Country 2020 & 2033
- Table 34: Global Specialty Nitriles Market Volume K Tons Forecast, by Country 2020 & 2033
- Table 35: United States Specialty Nitriles Market Revenue (Billion) Forecast, by Application 2020 & 2033
- Table 36: United States Specialty Nitriles Market Volume (K Tons) Forecast, by Application 2020 & 2033
- Table 37: Canada Specialty Nitriles Market Revenue (Billion) Forecast, by Application 2020 & 2033
- Table 38: Canada Specialty Nitriles Market Volume (K Tons) Forecast, by Application 2020 & 2033
- Table 39: Mexico Specialty Nitriles Market Revenue (Billion) Forecast, by Application 2020 & 2033
- Table 40: Mexico Specialty Nitriles Market Volume (K Tons) Forecast, by Application 2020 & 2033
- Table 41: Global Specialty Nitriles Market Revenue Billion Forecast, by Manufacturing Process 2020 & 2033
- Table 42: Global Specialty Nitriles Market Volume K Tons Forecast, by Manufacturing Process 2020 & 2033
- Table 43: Global Specialty Nitriles Market Revenue Billion Forecast, by Types 2020 & 2033
- Table 44: Global Specialty Nitriles Market Volume K Tons Forecast, by Types 2020 & 2033
- Table 45: Global Specialty Nitriles Market Revenue Billion Forecast, by Application 2020 & 2033
- Table 46: Global Specialty Nitriles Market Volume K Tons Forecast, by Application 2020 & 2033
- Table 47: Global Specialty Nitriles Market Revenue Billion Forecast, by Country 2020 & 2033
- Table 48: Global Specialty Nitriles Market Volume K Tons Forecast, by Country 2020 & 2033
- Table 49: Germany Specialty Nitriles Market Revenue (Billion) Forecast, by Application 2020 & 2033
- Table 50: Germany Specialty Nitriles Market Volume (K Tons) Forecast, by Application 2020 & 2033
- Table 51: United Kingdom Specialty Nitriles Market Revenue (Billion) Forecast, by Application 2020 & 2033
- Table 52: United Kingdom Specialty Nitriles Market Volume (K Tons) Forecast, by Application 2020 & 2033
- Table 53: France Specialty Nitriles Market Revenue (Billion) Forecast, by Application 2020 & 2033
- Table 54: France Specialty Nitriles Market Volume (K Tons) Forecast, by Application 2020 & 2033
- Table 55: Italy Specialty Nitriles Market Revenue (Billion) Forecast, by Application 2020 & 2033
- Table 56: Italy Specialty Nitriles Market Volume (K Tons) Forecast, by Application 2020 & 2033
- Table 57: Rest of Europe Specialty Nitriles Market Revenue (Billion) Forecast, by Application 2020 & 2033
- Table 58: Rest of Europe Specialty Nitriles Market Volume (K Tons) Forecast, by Application 2020 & 2033
- Table 59: Global Specialty Nitriles Market Revenue Billion Forecast, by Manufacturing Process 2020 & 2033
- Table 60: Global Specialty Nitriles Market Volume K Tons Forecast, by Manufacturing Process 2020 & 2033
- Table 61: Global Specialty Nitriles Market Revenue Billion Forecast, by Types 2020 & 2033
- Table 62: Global Specialty Nitriles Market Volume K Tons Forecast, by Types 2020 & 2033
- Table 63: Global Specialty Nitriles Market Revenue Billion Forecast, by Application 2020 & 2033
- Table 64: Global Specialty Nitriles Market Volume K Tons Forecast, by Application 2020 & 2033
- Table 65: Global Specialty Nitriles Market Revenue Billion Forecast, by Country 2020 & 2033
- Table 66: Global Specialty Nitriles Market Volume K Tons Forecast, by Country 2020 & 2033
- Table 67: Brazil Specialty Nitriles Market Revenue (Billion) Forecast, by Application 2020 & 2033
- Table 68: Brazil Specialty Nitriles Market Volume (K Tons) Forecast, by Application 2020 & 2033
- Table 69: Argentina Specialty Nitriles Market Revenue (Billion) Forecast, by Application 2020 & 2033
- Table 70: Argentina Specialty Nitriles Market Volume (K Tons) Forecast, by Application 2020 & 2033
- Table 71: Rest of South America Specialty Nitriles Market Revenue (Billion) Forecast, by Application 2020 & 2033
- Table 72: Rest of South America Specialty Nitriles Market Volume (K Tons) Forecast, by Application 2020 & 2033
- Table 73: Global Specialty Nitriles Market Revenue Billion Forecast, by Manufacturing Process 2020 & 2033
- Table 74: Global Specialty Nitriles Market Volume K Tons Forecast, by Manufacturing Process 2020 & 2033
- Table 75: Global Specialty Nitriles Market Revenue Billion Forecast, by Types 2020 & 2033
- Table 76: Global Specialty Nitriles Market Volume K Tons Forecast, by Types 2020 & 2033
- Table 77: Global Specialty Nitriles Market Revenue Billion Forecast, by Application 2020 & 2033
- Table 78: Global Specialty Nitriles Market Volume K Tons Forecast, by Application 2020 & 2033
- Table 79: Global Specialty Nitriles Market Revenue Billion Forecast, by Country 2020 & 2033
- Table 80: Global Specialty Nitriles Market Volume K Tons Forecast, by Country 2020 & 2033
- Table 81: Saudi Arabia Specialty Nitriles Market Revenue (Billion) Forecast, by Application 2020 & 2033
- Table 82: Saudi Arabia Specialty Nitriles Market Volume (K Tons) Forecast, by Application 2020 & 2033
- Table 83: South Africa Specialty Nitriles Market Revenue (Billion) Forecast, by Application 2020 & 2033
- Table 84: South Africa Specialty Nitriles Market Volume (K Tons) Forecast, by Application 2020 & 2033
- Table 85: Rest of Middle East and Africa Specialty Nitriles Market Revenue (Billion) Forecast, by Application 2020 & 2033
- Table 86: Rest of Middle East and Africa Specialty Nitriles Market Volume (K Tons) Forecast, by Application 2020 & 2033
Frequently Asked Questions
1. What is the projected Compound Annual Growth Rate (CAGR) of the Specialty Nitriles Market?
The projected CAGR is approximately 4.5%.
2. Which companies are prominent players in the Specialty Nitriles Market?
Key companies in the market include INEOS, Duraco, Ascend Performance Materials, AlzChem Group AG, Denicso, Speciality Tapes, TIDI Products LLC, Emerald Performance Materials, Parchem fine & specialty chemicals, Marco Rubber & Plastics LLC, Zeon Chemicals L P .
3. What are the main segments of the Specialty Nitriles Market?
The market segments include Manufacturing Process, Types, Application.
4. Can you provide details about the market size?
The market size is estimated to be USD 2.9 Billion as of 2022.
5. What are some drivers contributing to market growth?
; Growing Applications in Automotive Industry; Others Drivers.
6. What are the notable trends driving market growth?
Automotive Components to Dominate the Market.
7. Are there any restraints impacting market growth?
; Health Hazard related to Nitrile Fumes; Unfavorable Conditions Arising Due to COVID-19 Outbreak.
8. Can you provide examples of recent developments in the market?
N/A
9. What pricing options are available for accessing the report?
Pricing options include single-user, multi-user, and enterprise licenses priced at USD 4750, USD 5250, and USD 8750 respectively.
10. Is the market size provided in terms of value or volume?
The market size is provided in terms of value, measured in Billion and volume, measured in K Tons.
11. Are there any specific market keywords associated with the report?
Yes, the market keyword associated with the report is "Specialty Nitriles Market," which aids in identifying and referencing the specific market segment covered.
12. How do I determine which pricing option suits my needs best?
The pricing options vary based on user requirements and access needs. Individual users may opt for single-user licenses, while businesses requiring broader access may choose multi-user or enterprise licenses for cost-effective access to the report.
13. Are there any additional resources or data provided in the Specialty Nitriles Market report?
While the report offers comprehensive insights, it's advisable to review the specific contents or supplementary materials provided to ascertain if additional resources or data are available.
14. How can I stay updated on further developments or reports in the Specialty Nitriles Market?
To stay informed about further developments, trends, and reports in the Specialty Nitriles Market, consider subscribing to industry newsletters, following relevant companies and organizations, or regularly checking reputable industry news sources and publications.
Methodology
Step 1 - Identification of Relevant Samples Size from Population Database


Step 2 - Approaches for Defining Global Market Size (Value, Volume* & Price*)

Note*: In applicable scenarios
Step 3 - Data Sources
Primary Research
- Web Analytics
- Survey Reports
- Research Institute
- Latest Research Reports
- Opinion Leaders
Secondary Research
- Annual Reports
- White Paper
- Latest Press Release
- Industry Association
- Paid Database
- Investor Presentations

Step 4 - Data Triangulation
Involves using different sources of information in order to increase the validity of a study
These sources are likely to be stakeholders in a program - participants, other researchers, program staff, other community members, and so on.
Then we put all data in single framework & apply various statistical tools to find out the dynamic on the market.
During the analysis stage, feedback from the stakeholder groups would be compared to determine areas of agreement as well as areas of divergence