

Key Insights
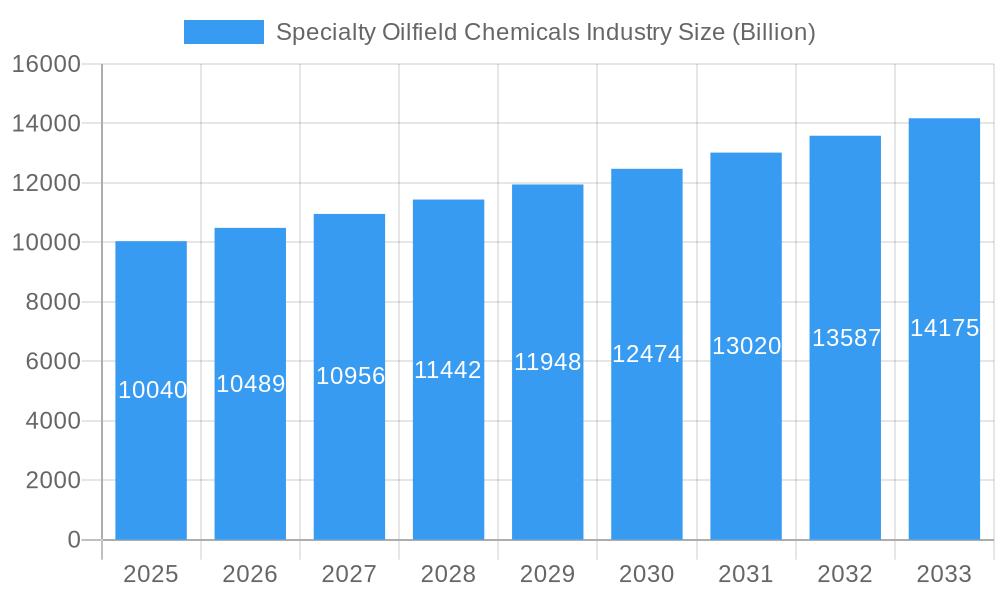
The global specialty oilfield chemicals market, projected to reach $29861.3 million by 2025, anticipates robust expansion. A compound annual growth rate (CAGR) of 3.2% from 2025 to 2033 underscores significant market evolution, propelled by several key drivers. The escalating demand for Enhanced Oil Recovery (EOR) techniques necessitates specialized chemicals for optimized performance, a primary growth catalyst. Moreover, stringent environmental regulations are accelerating the adoption of sustainable chemical solutions, fostering innovation in biocides and other eco-friendly segments. Technological advancements in drilling and completion processes also contribute, demanding sophisticated chemical formulations to enhance operational efficiency and reduce costs. Despite potential challenges from volatile oil prices and economic fluctuations, the long-term outlook remains positive, supported by consistent global energy needs and the imperative for efficient, sustainable oilfield operations. The market's segmentation by chemical type (e.g., biocides, corrosion inhibitors, demulsifiers, polymers, surfactants) and application (drilling, cementing, EOR, production, well stimulation, workover) highlights its intricate nature and the potential for specialized growth across various niches. Leading industry players, including Clariant, Chevron Phillips Chemical, Nouryon, and Schlumberger, are strategically investing in research and development to address evolving industry requirements, further stimulating market growth.
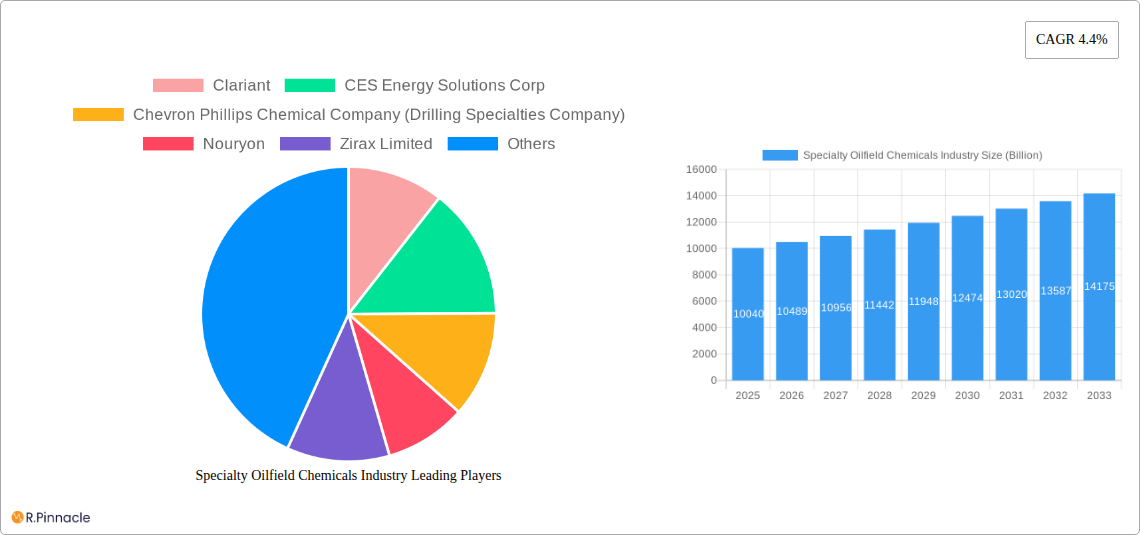
Specialty Oilfield Chemicals Industry Market Size (In Billion)
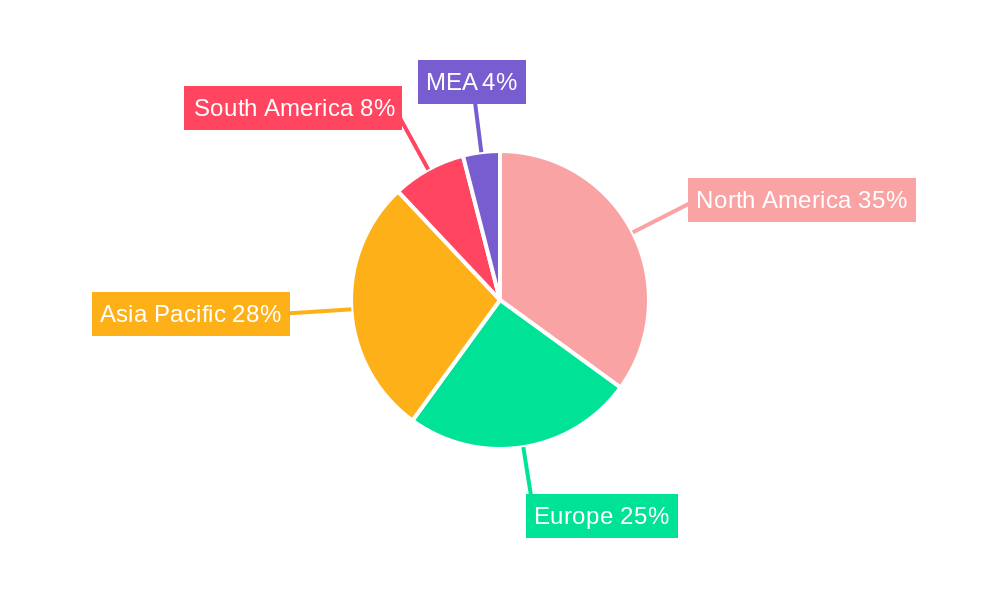
Geographic market dynamics will vary, with North America and the Asia-Pacific regions expected to lead expansion due to intensive exploration and production activities. However, regional regulatory frameworks governing chemical usage may impact adoption rates and market trajectories in specific areas. The competitive environment features a blend of established multinational corporations and agile niche players, each focusing on distinct market segments and technological innovations. This competitive intensity drives continuous innovation and the development of advanced, high-performance specialty oilfield chemicals, ensuring the sustained growth and refinement of this crucial industry sector. The forecast period of 2025-2033 presents considerable opportunities for market participants, contingent upon their adaptability to evolving technological demands and regulatory landscapes.
Specialty Oilfield Chemicals Industry Company Market Share
Specialty Oilfield Chemicals Industry: A Comprehensive Market Report (2019-2033)
This in-depth report provides a comprehensive analysis of the Specialty Oilfield Chemicals industry, projecting a market value exceeding $XX Billion by 2033. Designed for industry professionals, investors, and strategic planners, this report offers actionable insights into market dynamics, growth drivers, and future opportunities. With a focus on key players such as Clariant, Halliburton, and Schlumberger, this report leverages a robust data set spanning the historical period (2019-2024), base year (2025), and forecast period (2025-2033).
Specialty Oilfield Chemicals Industry Market Structure & Innovation Trends
The Specialty Oilfield Chemicals market is characterized by a moderately concentrated structure with several multinational giants holding significant market share. Clariant, Halliburton, and Schlumberger are among the leading players, collectively commanding an estimated XX% market share in 2025. Innovation is driven by the need for enhanced efficiency, reduced environmental impact, and improved performance in challenging operational environments. Stringent regulatory frameworks, particularly concerning environmental protection and worker safety, influence product development and adoption. The industry also witnesses ongoing mergers and acquisitions (M&A) activities, with deal values exceeding $XX Billion in recent years. These M&A activities aim to consolidate market share, expand product portfolios, and gain access to new technologies. Product substitutes, such as alternative drilling fluids and enhanced oil recovery techniques, pose a competitive challenge. End-user demographics largely comprise oil and gas exploration and production companies, with a growing focus on environmentally conscious solutions.
- Market Concentration: High, with top 5 players holding XX% market share (2025 estimate).
- M&A Activity: Significant, with total deal values exceeding $XX Billion (2019-2024).
- Innovation Drivers: Improved efficiency, environmental regulations, and enhanced performance.
- Regulatory Framework: Stringent regulations impacting product development and adoption.
- Product Substitutes: Growing availability of alternative technologies.
Specialty Oilfield Chemicals Industry Market Dynamics & Trends
The Specialty Oilfield Chemicals market is experiencing robust growth, driven by the increasing demand for oil and gas, coupled with technological advancements and the rising adoption of enhanced oil recovery techniques. The Compound Annual Growth Rate (CAGR) is projected to be XX% during the forecast period (2025-2033). Technological disruptions, such as the development of nanotechnology-based chemicals and the adoption of smart sensors, are transforming operational efficiency. Consumer preferences are shifting toward eco-friendly and sustainable products. Intense competition among key players is driving innovation and price optimization. Market penetration in emerging markets remains significant, especially in regions with substantial hydrocarbon reserves.
Dominant Regions & Segments in Specialty Oilfield Chemicals Industry
The North American and Middle Eastern regions currently dominate the Specialty Oilfield Chemicals market, driven by their large oil and gas production activities and substantial investments in infrastructure. Within the chemical types, corrosion and scale inhibitors, and polymers hold the largest market shares, owing to their critical role in maintaining operational efficiency and prolonging the lifespan of oil and gas wells. The drilling and cementing application segment commands a significant portion of the market.
- Key Drivers for North America: Established oil and gas infrastructure, strong regulatory support.
- Key Drivers for Middle East: Extensive hydrocarbon reserves, substantial investments in upstream activities.
- Dominant Chemical Type: Corrosion and Scale Inhibitors, due to their critical role in well integrity.
- Dominant Application: Drilling and Cementing, driven by high demand from upstream operations.
Specialty Oilfield Chemicals Industry Product Innovations
Recent advancements in specialty oilfield chemicals include the development of environmentally friendly formulations, improved performance additives, and intelligent chemicals that adapt to changing conditions. These innovations cater to the rising demand for sustainable and high-efficiency solutions, improving drilling efficiency and reducing the environmental footprint of oil and gas operations. The focus on advanced materials and bio-based alternatives further enhances market competitiveness.
Report Scope & Segmentation Analysis
This report provides a detailed segmentation analysis of the Specialty Oilfield Chemicals market by chemical type (Biocides, Corrosion and Scale Inhibitors, Demulsifiers, Polymers, Surfactants, Other Chemical Types) and application (Drilling and Cementing, Enhanced Oil Recovery, Production, Well Stimulation, Workover and Completion). Each segment’s market size, growth projections, and competitive landscape are thoroughly examined. Growth rates vary across segments, with some experiencing faster growth than others due to technological advancements and specific market demands. The competitive dynamics within each segment are influenced by factors such as technological innovation, pricing strategies, and market share.
Key Drivers of Specialty Oilfield Chemicals Industry Growth
Several factors contribute to the sustained growth of the Specialty Oilfield Chemicals industry. These include: increasing global demand for oil and gas, the growing adoption of enhanced oil recovery (EOR) techniques, and ongoing technological advancements leading to the development of high-performance chemicals. Stringent environmental regulations are also driving the demand for environmentally friendly chemical solutions. Investments in upstream activities, particularly in regions with significant hydrocarbon reserves, further fuel industry growth.
Challenges in the Specialty Oilfield Chemicals Industry Sector
The Specialty Oilfield Chemicals industry faces several challenges, including fluctuations in oil and gas prices, stringent environmental regulations imposing compliance costs, and the potential impact of geopolitical instability on supply chains. Competition from alternative technologies and the need for continuous innovation to maintain a competitive edge also pose significant challenges. The industry is also subjected to intense price competition.
Emerging Opportunities in Specialty Oilfield Chemicals Industry
The Specialty Oilfield Chemicals industry presents promising opportunities in the development and application of environmentally friendly chemicals, bio-based alternatives, and advanced materials. Expansion into emerging markets with significant oil and gas reserves, particularly in regions with growing energy demands, offers substantial potential for market growth. The increasing adoption of digital technologies, such as sensors and data analytics, presents opportunities for process optimization and cost reduction.
Leading Players in the Specialty Oilfield Chemicals Industry Market
- Clariant
- CES Energy Solutions Corp
- Chevron Phillips Chemical Company (Drilling Specialties Company)
- Nouryon
- Zirax Limited
- Solvay
- Innospec Oilfield Services
- Ecolab (NALCO Champion)
- Elementis PLC
- Croda International PLC
- Ashland
- BASF SE
- Huntsman International LLC
- Kemira
- Dow
- Flotek Industries Inc
- The Lubrizol Corporation
- Baker Hughes Company
- Halliburton
- MPRC
- Schlumberger Limited
- Albemarle Corporation
Key Developments in Specialty Oilfield Chemicals Industry Industry
- March 2022: Halliburton announced the opening of the Halliburton Chemical Reaction Plant in Saudi Arabia, expanding its manufacturing capacity and market reach in the Middle East.
- December 2022: Champion X opened a new oilfield services chemicals lab and distribution facility in Chaguaramas, Trinidad, enhancing its analytical capabilities and logistical support in the region.
Future Outlook for Specialty Oilfield Chemicals Industry Market
The Specialty Oilfield Chemicals market is poised for continued growth, driven by increasing global energy demand, technological advancements, and the adoption of sustainable practices. Strategic partnerships, investments in research and development, and expansion into new markets will shape the future landscape. The focus on efficiency, environmental sustainability, and digitalization will define the industry's trajectory.
Specialty Oilfield Chemicals Industry Segmentation
-
1. Chemical Type
- 1.1. Biocides
- 1.2. Corrosion and Scale Inhibitors
- 1.3. Demulsifiers
- 1.4. Polymers
- 1.5. Surfactants
- 1.6. Other Chemical Types
-
2. Application
- 2.1. Drilling and Cementing
- 2.2. Enhanced Oil Recovery
- 2.3. Production
- 2.4. Well Stimulation
- 2.5. Workover and Completion
Specialty Oilfield Chemicals Industry Segmentation By Geography
-
1. Asia Pacific
- 1.1. China
- 1.2. India
- 1.3. Indonesia
- 1.4. Malaysia
- 1.5. Thailand
- 1.6. Australia
-
2. Vietnam
- 2.1. Rest of Asia Pacific
-
3. North America
- 3.1. United States
- 3.2. Canada
- 3.3. Mexico
-
4. Europe
- 4.1. Russia
- 4.2. Norway
- 4.3. UK
- 4.4. Rest of Europe
-
5. South America
- 5.1. Brazil
- 5.2. Argentina
- 5.3. Columbia
- 5.4. Rest of South America
-
6. Middle East and Africa
- 6.1. Algeria
- 6.2. Iran
- 6.3. Iraq
- 6.4. Nigeria
- 6.5. Saudi Arabia
- 6.6. Rest of Middle East and Africa
Specialty Oilfield Chemicals Industry Regional Market Share
Geographic Coverage of Specialty Oilfield Chemicals Industry
Specialty Oilfield Chemicals Industry REPORT HIGHLIGHTS
| Aspects | Details |
|---|---|
| Study Period | 2020-2034 |
| Base Year | 2025 |
| Estimated Year | 2026 |
| Forecast Period | 2026-2034 |
| Historical Period | 2020-2025 |
| Growth Rate | CAGR of 3.2% from 2020-2034 |
| Segmentation |
|
Table of Contents
- 1. Introduction
- 1.1. Research Scope
- 1.2. Market Segmentation
- 1.3. Research Objective
- 1.4. Definitions and Assumptions
- 2. Executive Summary
- 2.1. Market Snapshot
- 3. Market Dynamics
- 3.1. Market Drivers
- 3.2. Market Restrains
- 3.3. Market Trends
- 3.4. Market Opportunities
- 4. Market Factor Analysis
- 4.1. Porters Five Forces
- 4.1.1. Bargaining Power of Suppliers
- 4.1.2. Bargaining Power of Buyers
- 4.1.3. Threat of New Entrants
- 4.1.4. Threat of Substitutes
- 4.1.5. Competitive Rivalry
- 4.2. PESTEL analysis
- 4.3. BCG Analysis
- 4.3.1. Stars (High Growth, High Market Share)
- 4.3.2. Cash Cows (Low Growth, High Market Share)
- 4.3.3. Question Mark (High Growth, Low Market Share)
- 4.3.4. Dogs (Low Growth, Low Market Share)
- 4.4. Ansoff Matrix Analysis
- 4.5. Supply Chain Analysis
- 4.6. Regulatory Landscape
- 4.7. Current Market Potential and Opportunity Assessment (TAM–SAM–SOM Framework)
- 4.8. PRI Analyst Note
- 4.1. Porters Five Forces
- 5. Market Analysis, Insights and Forecast 2021-2033
- 5.1. Market Analysis, Insights and Forecast - by Chemical Type
- 5.1.1. Biocides
- 5.1.2. Corrosion and Scale Inhibitors
- 5.1.3. Demulsifiers
- 5.1.4. Polymers
- 5.1.5. Surfactants
- 5.1.6. Other Chemical Types
- 5.2. Market Analysis, Insights and Forecast - by Application
- 5.2.1. Drilling and Cementing
- 5.2.2. Enhanced Oil Recovery
- 5.2.3. Production
- 5.2.4. Well Stimulation
- 5.2.5. Workover and Completion
- 5.3. Market Analysis, Insights and Forecast - by Region
- 5.3.1. Asia Pacific
- 5.3.2. Vietnam
- 5.3.3. North America
- 5.3.4. Europe
- 5.3.5. South America
- 5.3.6. Middle East and Africa
- 5.1. Market Analysis, Insights and Forecast - by Chemical Type
- 6. Global Specialty Oilfield Chemicals Industry Analysis, Insights and Forecast, 2021-2033
- 6.1. Market Analysis, Insights and Forecast - by Chemical Type
- 6.1.1. Biocides
- 6.1.2. Corrosion and Scale Inhibitors
- 6.1.3. Demulsifiers
- 6.1.4. Polymers
- 6.1.5. Surfactants
- 6.1.6. Other Chemical Types
- 6.2. Market Analysis, Insights and Forecast - by Application
- 6.2.1. Drilling and Cementing
- 6.2.2. Enhanced Oil Recovery
- 6.2.3. Production
- 6.2.4. Well Stimulation
- 6.2.5. Workover and Completion
- 6.1. Market Analysis, Insights and Forecast - by Chemical Type
- 7. Asia Pacific Specialty Oilfield Chemicals Industry Analysis, Insights and Forecast, 2020-2032
- 7.1. Market Analysis, Insights and Forecast - by Chemical Type
- 7.1.1. Biocides
- 7.1.2. Corrosion and Scale Inhibitors
- 7.1.3. Demulsifiers
- 7.1.4. Polymers
- 7.1.5. Surfactants
- 7.1.6. Other Chemical Types
- 7.2. Market Analysis, Insights and Forecast - by Application
- 7.2.1. Drilling and Cementing
- 7.2.2. Enhanced Oil Recovery
- 7.2.3. Production
- 7.2.4. Well Stimulation
- 7.2.5. Workover and Completion
- 7.1. Market Analysis, Insights and Forecast - by Chemical Type
- 8. Vietnam Specialty Oilfield Chemicals Industry Analysis, Insights and Forecast, 2020-2032
- 8.1. Market Analysis, Insights and Forecast - by Chemical Type
- 8.1.1. Biocides
- 8.1.2. Corrosion and Scale Inhibitors
- 8.1.3. Demulsifiers
- 8.1.4. Polymers
- 8.1.5. Surfactants
- 8.1.6. Other Chemical Types
- 8.2. Market Analysis, Insights and Forecast - by Application
- 8.2.1. Drilling and Cementing
- 8.2.2. Enhanced Oil Recovery
- 8.2.3. Production
- 8.2.4. Well Stimulation
- 8.2.5. Workover and Completion
- 8.1. Market Analysis, Insights and Forecast - by Chemical Type
- 9. North America Specialty Oilfield Chemicals Industry Analysis, Insights and Forecast, 2020-2032
- 9.1. Market Analysis, Insights and Forecast - by Chemical Type
- 9.1.1. Biocides
- 9.1.2. Corrosion and Scale Inhibitors
- 9.1.3. Demulsifiers
- 9.1.4. Polymers
- 9.1.5. Surfactants
- 9.1.6. Other Chemical Types
- 9.2. Market Analysis, Insights and Forecast - by Application
- 9.2.1. Drilling and Cementing
- 9.2.2. Enhanced Oil Recovery
- 9.2.3. Production
- 9.2.4. Well Stimulation
- 9.2.5. Workover and Completion
- 9.1. Market Analysis, Insights and Forecast - by Chemical Type
- 10. Europe Specialty Oilfield Chemicals Industry Analysis, Insights and Forecast, 2020-2032
- 10.1. Market Analysis, Insights and Forecast - by Chemical Type
- 10.1.1. Biocides
- 10.1.2. Corrosion and Scale Inhibitors
- 10.1.3. Demulsifiers
- 10.1.4. Polymers
- 10.1.5. Surfactants
- 10.1.6. Other Chemical Types
- 10.2. Market Analysis, Insights and Forecast - by Application
- 10.2.1. Drilling and Cementing
- 10.2.2. Enhanced Oil Recovery
- 10.2.3. Production
- 10.2.4. Well Stimulation
- 10.2.5. Workover and Completion
- 10.1. Market Analysis, Insights and Forecast - by Chemical Type
- 11. South America Specialty Oilfield Chemicals Industry Analysis, Insights and Forecast, 2020-2032
- 11.1. Market Analysis, Insights and Forecast - by Chemical Type
- 11.1.1. Biocides
- 11.1.2. Corrosion and Scale Inhibitors
- 11.1.3. Demulsifiers
- 11.1.4. Polymers
- 11.1.5. Surfactants
- 11.1.6. Other Chemical Types
- 11.2. Market Analysis, Insights and Forecast - by Application
- 11.2.1. Drilling and Cementing
- 11.2.2. Enhanced Oil Recovery
- 11.2.3. Production
- 11.2.4. Well Stimulation
- 11.2.5. Workover and Completion
- 11.1. Market Analysis, Insights and Forecast - by Chemical Type
- 12. Middle East and Africa Specialty Oilfield Chemicals Industry Analysis, Insights and Forecast, 2020-2032
- 12.1. Market Analysis, Insights and Forecast - by Chemical Type
- 12.1.1. Biocides
- 12.1.2. Corrosion and Scale Inhibitors
- 12.1.3. Demulsifiers
- 12.1.4. Polymers
- 12.1.5. Surfactants
- 12.1.6. Other Chemical Types
- 12.2. Market Analysis, Insights and Forecast - by Application
- 12.2.1. Drilling and Cementing
- 12.2.2. Enhanced Oil Recovery
- 12.2.3. Production
- 12.2.4. Well Stimulation
- 12.2.5. Workover and Completion
- 12.1. Market Analysis, Insights and Forecast - by Chemical Type
- 13. Competitive Analysis
- 13.1. Company Profiles
- 13.1.1 Clariant
- 13.1.1.1. Company Overview
- 13.1.1.2. Products
- 13.1.1.3. Company Financials
- 13.1.1.4. SWOT Analysis
- 13.1.2 CES Energy Solutions Corp
- 13.1.2.1. Company Overview
- 13.1.2.2. Products
- 13.1.2.3. Company Financials
- 13.1.2.4. SWOT Analysis
- 13.1.3 Chevron Phillips Chemical Company (Drilling Specialties Company)
- 13.1.3.1. Company Overview
- 13.1.3.2. Products
- 13.1.3.3. Company Financials
- 13.1.3.4. SWOT Analysis
- 13.1.4 Nouryon
- 13.1.4.1. Company Overview
- 13.1.4.2. Products
- 13.1.4.3. Company Financials
- 13.1.4.4. SWOT Analysis
- 13.1.5 Zirax Limited
- 13.1.5.1. Company Overview
- 13.1.5.2. Products
- 13.1.5.3. Company Financials
- 13.1.5.4. SWOT Analysis
- 13.1.6 Solvay
- 13.1.6.1. Company Overview
- 13.1.6.2. Products
- 13.1.6.3. Company Financials
- 13.1.6.4. SWOT Analysis
- 13.1.7 Innospec Oilfield Services
- 13.1.7.1. Company Overview
- 13.1.7.2. Products
- 13.1.7.3. Company Financials
- 13.1.7.4. SWOT Analysis
- 13.1.8 Ecolab (NALCO Champion)
- 13.1.8.1. Company Overview
- 13.1.8.2. Products
- 13.1.8.3. Company Financials
- 13.1.8.4. SWOT Analysis
- 13.1.9 Elementis PLC
- 13.1.9.1. Company Overview
- 13.1.9.2. Products
- 13.1.9.3. Company Financials
- 13.1.9.4. SWOT Analysis
- 13.1.10 Croda International PLC
- 13.1.10.1. Company Overview
- 13.1.10.2. Products
- 13.1.10.3. Company Financials
- 13.1.10.4. SWOT Analysis
- 13.1.11 Ashland
- 13.1.11.1. Company Overview
- 13.1.11.2. Products
- 13.1.11.3. Company Financials
- 13.1.11.4. SWOT Analysis
- 13.1.12 BASF SE
- 13.1.12.1. Company Overview
- 13.1.12.2. Products
- 13.1.12.3. Company Financials
- 13.1.12.4. SWOT Analysis
- 13.1.13 Huntsman International LLC
- 13.1.13.1. Company Overview
- 13.1.13.2. Products
- 13.1.13.3. Company Financials
- 13.1.13.4. SWOT Analysis
- 13.1.14 Kemira
- 13.1.14.1. Company Overview
- 13.1.14.2. Products
- 13.1.14.3. Company Financials
- 13.1.14.4. SWOT Analysis
- 13.1.15 Dow
- 13.1.15.1. Company Overview
- 13.1.15.2. Products
- 13.1.15.3. Company Financials
- 13.1.15.4. SWOT Analysis
- 13.1.16 Flotek Industries Inc
- 13.1.16.1. Company Overview
- 13.1.16.2. Products
- 13.1.16.3. Company Financials
- 13.1.16.4. SWOT Analysis
- 13.1.17 The Lubrizol Corporation
- 13.1.17.1. Company Overview
- 13.1.17.2. Products
- 13.1.17.3. Company Financials
- 13.1.17.4. SWOT Analysis
- 13.1.18 Baker Hughes Company
- 13.1.18.1. Company Overview
- 13.1.18.2. Products
- 13.1.18.3. Company Financials
- 13.1.18.4. SWOT Analysis
- 13.1.19 Halliburton
- 13.1.19.1. Company Overview
- 13.1.19.2. Products
- 13.1.19.3. Company Financials
- 13.1.19.4. SWOT Analysis
- 13.1.20 MPRC
- 13.1.20.1. Company Overview
- 13.1.20.2. Products
- 13.1.20.3. Company Financials
- 13.1.20.4. SWOT Analysis
- 13.1.21 Schlumberger Limited
- 13.1.21.1. Company Overview
- 13.1.21.2. Products
- 13.1.21.3. Company Financials
- 13.1.21.4. SWOT Analysis
- 13.1.22 Albemarle Corporation
- 13.1.22.1. Company Overview
- 13.1.22.2. Products
- 13.1.22.3. Company Financials
- 13.1.22.4. SWOT Analysis
- 13.1.1 Clariant
- 13.2. Market Entropy
- 13.2.1 Company's Key Areas Served
- 13.2.2 Recent Developments
- 13.3. Company Market Share Analysis 2025
- 13.3.1 Top 5 Companies Market Share Analysis
- 13.3.2 Top 3 Companies Market Share Analysis
- 13.4. List of Potential Customers
- 14. Research Methodology
List of Figures
- Figure 1: Global Specialty Oilfield Chemicals Industry Revenue Breakdown (million, %) by Region 2025 & 2033
- Figure 2: Global Specialty Oilfield Chemicals Industry Volume Breakdown (K Tons, %) by Region 2025 & 2033
- Figure 3: Asia Pacific Specialty Oilfield Chemicals Industry Revenue (million), by Chemical Type 2025 & 2033
- Figure 4: Asia Pacific Specialty Oilfield Chemicals Industry Volume (K Tons), by Chemical Type 2025 & 2033
- Figure 5: Asia Pacific Specialty Oilfield Chemicals Industry Revenue Share (%), by Chemical Type 2025 & 2033
- Figure 6: Asia Pacific Specialty Oilfield Chemicals Industry Volume Share (%), by Chemical Type 2025 & 2033
- Figure 7: Asia Pacific Specialty Oilfield Chemicals Industry Revenue (million), by Application 2025 & 2033
- Figure 8: Asia Pacific Specialty Oilfield Chemicals Industry Volume (K Tons), by Application 2025 & 2033
- Figure 9: Asia Pacific Specialty Oilfield Chemicals Industry Revenue Share (%), by Application 2025 & 2033
- Figure 10: Asia Pacific Specialty Oilfield Chemicals Industry Volume Share (%), by Application 2025 & 2033
- Figure 11: Asia Pacific Specialty Oilfield Chemicals Industry Revenue (million), by Country 2025 & 2033
- Figure 12: Asia Pacific Specialty Oilfield Chemicals Industry Volume (K Tons), by Country 2025 & 2033
- Figure 13: Asia Pacific Specialty Oilfield Chemicals Industry Revenue Share (%), by Country 2025 & 2033
- Figure 14: Asia Pacific Specialty Oilfield Chemicals Industry Volume Share (%), by Country 2025 & 2033
- Figure 15: Vietnam Specialty Oilfield Chemicals Industry Revenue (million), by Chemical Type 2025 & 2033
- Figure 16: Vietnam Specialty Oilfield Chemicals Industry Volume (K Tons), by Chemical Type 2025 & 2033
- Figure 17: Vietnam Specialty Oilfield Chemicals Industry Revenue Share (%), by Chemical Type 2025 & 2033
- Figure 18: Vietnam Specialty Oilfield Chemicals Industry Volume Share (%), by Chemical Type 2025 & 2033
- Figure 19: Vietnam Specialty Oilfield Chemicals Industry Revenue (million), by Application 2025 & 2033
- Figure 20: Vietnam Specialty Oilfield Chemicals Industry Volume (K Tons), by Application 2025 & 2033
- Figure 21: Vietnam Specialty Oilfield Chemicals Industry Revenue Share (%), by Application 2025 & 2033
- Figure 22: Vietnam Specialty Oilfield Chemicals Industry Volume Share (%), by Application 2025 & 2033
- Figure 23: Vietnam Specialty Oilfield Chemicals Industry Revenue (million), by Country 2025 & 2033
- Figure 24: Vietnam Specialty Oilfield Chemicals Industry Volume (K Tons), by Country 2025 & 2033
- Figure 25: Vietnam Specialty Oilfield Chemicals Industry Revenue Share (%), by Country 2025 & 2033
- Figure 26: Vietnam Specialty Oilfield Chemicals Industry Volume Share (%), by Country 2025 & 2033
- Figure 27: North America Specialty Oilfield Chemicals Industry Revenue (million), by Chemical Type 2025 & 2033
- Figure 28: North America Specialty Oilfield Chemicals Industry Volume (K Tons), by Chemical Type 2025 & 2033
- Figure 29: North America Specialty Oilfield Chemicals Industry Revenue Share (%), by Chemical Type 2025 & 2033
- Figure 30: North America Specialty Oilfield Chemicals Industry Volume Share (%), by Chemical Type 2025 & 2033
- Figure 31: North America Specialty Oilfield Chemicals Industry Revenue (million), by Application 2025 & 2033
- Figure 32: North America Specialty Oilfield Chemicals Industry Volume (K Tons), by Application 2025 & 2033
- Figure 33: North America Specialty Oilfield Chemicals Industry Revenue Share (%), by Application 2025 & 2033
- Figure 34: North America Specialty Oilfield Chemicals Industry Volume Share (%), by Application 2025 & 2033
- Figure 35: North America Specialty Oilfield Chemicals Industry Revenue (million), by Country 2025 & 2033
- Figure 36: North America Specialty Oilfield Chemicals Industry Volume (K Tons), by Country 2025 & 2033
- Figure 37: North America Specialty Oilfield Chemicals Industry Revenue Share (%), by Country 2025 & 2033
- Figure 38: North America Specialty Oilfield Chemicals Industry Volume Share (%), by Country 2025 & 2033
- Figure 39: Europe Specialty Oilfield Chemicals Industry Revenue (million), by Chemical Type 2025 & 2033
- Figure 40: Europe Specialty Oilfield Chemicals Industry Volume (K Tons), by Chemical Type 2025 & 2033
- Figure 41: Europe Specialty Oilfield Chemicals Industry Revenue Share (%), by Chemical Type 2025 & 2033
- Figure 42: Europe Specialty Oilfield Chemicals Industry Volume Share (%), by Chemical Type 2025 & 2033
- Figure 43: Europe Specialty Oilfield Chemicals Industry Revenue (million), by Application 2025 & 2033
- Figure 44: Europe Specialty Oilfield Chemicals Industry Volume (K Tons), by Application 2025 & 2033
- Figure 45: Europe Specialty Oilfield Chemicals Industry Revenue Share (%), by Application 2025 & 2033
- Figure 46: Europe Specialty Oilfield Chemicals Industry Volume Share (%), by Application 2025 & 2033
- Figure 47: Europe Specialty Oilfield Chemicals Industry Revenue (million), by Country 2025 & 2033
- Figure 48: Europe Specialty Oilfield Chemicals Industry Volume (K Tons), by Country 2025 & 2033
- Figure 49: Europe Specialty Oilfield Chemicals Industry Revenue Share (%), by Country 2025 & 2033
- Figure 50: Europe Specialty Oilfield Chemicals Industry Volume Share (%), by Country 2025 & 2033
- Figure 51: South America Specialty Oilfield Chemicals Industry Revenue (million), by Chemical Type 2025 & 2033
- Figure 52: South America Specialty Oilfield Chemicals Industry Volume (K Tons), by Chemical Type 2025 & 2033
- Figure 53: South America Specialty Oilfield Chemicals Industry Revenue Share (%), by Chemical Type 2025 & 2033
- Figure 54: South America Specialty Oilfield Chemicals Industry Volume Share (%), by Chemical Type 2025 & 2033
- Figure 55: South America Specialty Oilfield Chemicals Industry Revenue (million), by Application 2025 & 2033
- Figure 56: South America Specialty Oilfield Chemicals Industry Volume (K Tons), by Application 2025 & 2033
- Figure 57: South America Specialty Oilfield Chemicals Industry Revenue Share (%), by Application 2025 & 2033
- Figure 58: South America Specialty Oilfield Chemicals Industry Volume Share (%), by Application 2025 & 2033
- Figure 59: South America Specialty Oilfield Chemicals Industry Revenue (million), by Country 2025 & 2033
- Figure 60: South America Specialty Oilfield Chemicals Industry Volume (K Tons), by Country 2025 & 2033
- Figure 61: South America Specialty Oilfield Chemicals Industry Revenue Share (%), by Country 2025 & 2033
- Figure 62: South America Specialty Oilfield Chemicals Industry Volume Share (%), by Country 2025 & 2033
- Figure 63: Middle East and Africa Specialty Oilfield Chemicals Industry Revenue (million), by Chemical Type 2025 & 2033
- Figure 64: Middle East and Africa Specialty Oilfield Chemicals Industry Volume (K Tons), by Chemical Type 2025 & 2033
- Figure 65: Middle East and Africa Specialty Oilfield Chemicals Industry Revenue Share (%), by Chemical Type 2025 & 2033
- Figure 66: Middle East and Africa Specialty Oilfield Chemicals Industry Volume Share (%), by Chemical Type 2025 & 2033
- Figure 67: Middle East and Africa Specialty Oilfield Chemicals Industry Revenue (million), by Application 2025 & 2033
- Figure 68: Middle East and Africa Specialty Oilfield Chemicals Industry Volume (K Tons), by Application 2025 & 2033
- Figure 69: Middle East and Africa Specialty Oilfield Chemicals Industry Revenue Share (%), by Application 2025 & 2033
- Figure 70: Middle East and Africa Specialty Oilfield Chemicals Industry Volume Share (%), by Application 2025 & 2033
- Figure 71: Middle East and Africa Specialty Oilfield Chemicals Industry Revenue (million), by Country 2025 & 2033
- Figure 72: Middle East and Africa Specialty Oilfield Chemicals Industry Volume (K Tons), by Country 2025 & 2033
- Figure 73: Middle East and Africa Specialty Oilfield Chemicals Industry Revenue Share (%), by Country 2025 & 2033
- Figure 74: Middle East and Africa Specialty Oilfield Chemicals Industry Volume Share (%), by Country 2025 & 2033
List of Tables
- Table 1: Global Specialty Oilfield Chemicals Industry Revenue million Forecast, by Chemical Type 2020 & 2033
- Table 2: Global Specialty Oilfield Chemicals Industry Volume K Tons Forecast, by Chemical Type 2020 & 2033
- Table 3: Global Specialty Oilfield Chemicals Industry Revenue million Forecast, by Application 2020 & 2033
- Table 4: Global Specialty Oilfield Chemicals Industry Volume K Tons Forecast, by Application 2020 & 2033
- Table 5: Global Specialty Oilfield Chemicals Industry Revenue million Forecast, by Region 2020 & 2033
- Table 6: Global Specialty Oilfield Chemicals Industry Volume K Tons Forecast, by Region 2020 & 2033
- Table 7: Global Specialty Oilfield Chemicals Industry Revenue million Forecast, by Chemical Type 2020 & 2033
- Table 8: Global Specialty Oilfield Chemicals Industry Volume K Tons Forecast, by Chemical Type 2020 & 2033
- Table 9: Global Specialty Oilfield Chemicals Industry Revenue million Forecast, by Application 2020 & 2033
- Table 10: Global Specialty Oilfield Chemicals Industry Volume K Tons Forecast, by Application 2020 & 2033
- Table 11: Global Specialty Oilfield Chemicals Industry Revenue million Forecast, by Country 2020 & 2033
- Table 12: Global Specialty Oilfield Chemicals Industry Volume K Tons Forecast, by Country 2020 & 2033
- Table 13: China Specialty Oilfield Chemicals Industry Revenue (million) Forecast, by Application 2020 & 2033
- Table 14: China Specialty Oilfield Chemicals Industry Volume (K Tons) Forecast, by Application 2020 & 2033
- Table 15: India Specialty Oilfield Chemicals Industry Revenue (million) Forecast, by Application 2020 & 2033
- Table 16: India Specialty Oilfield Chemicals Industry Volume (K Tons) Forecast, by Application 2020 & 2033
- Table 17: Indonesia Specialty Oilfield Chemicals Industry Revenue (million) Forecast, by Application 2020 & 2033
- Table 18: Indonesia Specialty Oilfield Chemicals Industry Volume (K Tons) Forecast, by Application 2020 & 2033
- Table 19: Malaysia Specialty Oilfield Chemicals Industry Revenue (million) Forecast, by Application 2020 & 2033
- Table 20: Malaysia Specialty Oilfield Chemicals Industry Volume (K Tons) Forecast, by Application 2020 & 2033
- Table 21: Thailand Specialty Oilfield Chemicals Industry Revenue (million) Forecast, by Application 2020 & 2033
- Table 22: Thailand Specialty Oilfield Chemicals Industry Volume (K Tons) Forecast, by Application 2020 & 2033
- Table 23: Australia Specialty Oilfield Chemicals Industry Revenue (million) Forecast, by Application 2020 & 2033
- Table 24: Australia Specialty Oilfield Chemicals Industry Volume (K Tons) Forecast, by Application 2020 & 2033
- Table 25: Global Specialty Oilfield Chemicals Industry Revenue million Forecast, by Chemical Type 2020 & 2033
- Table 26: Global Specialty Oilfield Chemicals Industry Volume K Tons Forecast, by Chemical Type 2020 & 2033
- Table 27: Global Specialty Oilfield Chemicals Industry Revenue million Forecast, by Application 2020 & 2033
- Table 28: Global Specialty Oilfield Chemicals Industry Volume K Tons Forecast, by Application 2020 & 2033
- Table 29: Global Specialty Oilfield Chemicals Industry Revenue million Forecast, by Country 2020 & 2033
- Table 30: Global Specialty Oilfield Chemicals Industry Volume K Tons Forecast, by Country 2020 & 2033
- Table 31: Rest of Asia Pacific Specialty Oilfield Chemicals Industry Revenue (million) Forecast, by Application 2020 & 2033
- Table 32: Rest of Asia Pacific Specialty Oilfield Chemicals Industry Volume (K Tons) Forecast, by Application 2020 & 2033
- Table 33: Global Specialty Oilfield Chemicals Industry Revenue million Forecast, by Chemical Type 2020 & 2033
- Table 34: Global Specialty Oilfield Chemicals Industry Volume K Tons Forecast, by Chemical Type 2020 & 2033
- Table 35: Global Specialty Oilfield Chemicals Industry Revenue million Forecast, by Application 2020 & 2033
- Table 36: Global Specialty Oilfield Chemicals Industry Volume K Tons Forecast, by Application 2020 & 2033
- Table 37: Global Specialty Oilfield Chemicals Industry Revenue million Forecast, by Country 2020 & 2033
- Table 38: Global Specialty Oilfield Chemicals Industry Volume K Tons Forecast, by Country 2020 & 2033
- Table 39: United States Specialty Oilfield Chemicals Industry Revenue (million) Forecast, by Application 2020 & 2033
- Table 40: United States Specialty Oilfield Chemicals Industry Volume (K Tons) Forecast, by Application 2020 & 2033
- Table 41: Canada Specialty Oilfield Chemicals Industry Revenue (million) Forecast, by Application 2020 & 2033
- Table 42: Canada Specialty Oilfield Chemicals Industry Volume (K Tons) Forecast, by Application 2020 & 2033
- Table 43: Mexico Specialty Oilfield Chemicals Industry Revenue (million) Forecast, by Application 2020 & 2033
- Table 44: Mexico Specialty Oilfield Chemicals Industry Volume (K Tons) Forecast, by Application 2020 & 2033
- Table 45: Global Specialty Oilfield Chemicals Industry Revenue million Forecast, by Chemical Type 2020 & 2033
- Table 46: Global Specialty Oilfield Chemicals Industry Volume K Tons Forecast, by Chemical Type 2020 & 2033
- Table 47: Global Specialty Oilfield Chemicals Industry Revenue million Forecast, by Application 2020 & 2033
- Table 48: Global Specialty Oilfield Chemicals Industry Volume K Tons Forecast, by Application 2020 & 2033
- Table 49: Global Specialty Oilfield Chemicals Industry Revenue million Forecast, by Country 2020 & 2033
- Table 50: Global Specialty Oilfield Chemicals Industry Volume K Tons Forecast, by Country 2020 & 2033
- Table 51: Russia Specialty Oilfield Chemicals Industry Revenue (million) Forecast, by Application 2020 & 2033
- Table 52: Russia Specialty Oilfield Chemicals Industry Volume (K Tons) Forecast, by Application 2020 & 2033
- Table 53: Norway Specialty Oilfield Chemicals Industry Revenue (million) Forecast, by Application 2020 & 2033
- Table 54: Norway Specialty Oilfield Chemicals Industry Volume (K Tons) Forecast, by Application 2020 & 2033
- Table 55: UK Specialty Oilfield Chemicals Industry Revenue (million) Forecast, by Application 2020 & 2033
- Table 56: UK Specialty Oilfield Chemicals Industry Volume (K Tons) Forecast, by Application 2020 & 2033
- Table 57: Rest of Europe Specialty Oilfield Chemicals Industry Revenue (million) Forecast, by Application 2020 & 2033
- Table 58: Rest of Europe Specialty Oilfield Chemicals Industry Volume (K Tons) Forecast, by Application 2020 & 2033
- Table 59: Global Specialty Oilfield Chemicals Industry Revenue million Forecast, by Chemical Type 2020 & 2033
- Table 60: Global Specialty Oilfield Chemicals Industry Volume K Tons Forecast, by Chemical Type 2020 & 2033
- Table 61: Global Specialty Oilfield Chemicals Industry Revenue million Forecast, by Application 2020 & 2033
- Table 62: Global Specialty Oilfield Chemicals Industry Volume K Tons Forecast, by Application 2020 & 2033
- Table 63: Global Specialty Oilfield Chemicals Industry Revenue million Forecast, by Country 2020 & 2033
- Table 64: Global Specialty Oilfield Chemicals Industry Volume K Tons Forecast, by Country 2020 & 2033
- Table 65: Brazil Specialty Oilfield Chemicals Industry Revenue (million) Forecast, by Application 2020 & 2033
- Table 66: Brazil Specialty Oilfield Chemicals Industry Volume (K Tons) Forecast, by Application 2020 & 2033
- Table 67: Argentina Specialty Oilfield Chemicals Industry Revenue (million) Forecast, by Application 2020 & 2033
- Table 68: Argentina Specialty Oilfield Chemicals Industry Volume (K Tons) Forecast, by Application 2020 & 2033
- Table 69: Columbia Specialty Oilfield Chemicals Industry Revenue (million) Forecast, by Application 2020 & 2033
- Table 70: Columbia Specialty Oilfield Chemicals Industry Volume (K Tons) Forecast, by Application 2020 & 2033
- Table 71: Rest of South America Specialty Oilfield Chemicals Industry Revenue (million) Forecast, by Application 2020 & 2033
- Table 72: Rest of South America Specialty Oilfield Chemicals Industry Volume (K Tons) Forecast, by Application 2020 & 2033
- Table 73: Global Specialty Oilfield Chemicals Industry Revenue million Forecast, by Chemical Type 2020 & 2033
- Table 74: Global Specialty Oilfield Chemicals Industry Volume K Tons Forecast, by Chemical Type 2020 & 2033
- Table 75: Global Specialty Oilfield Chemicals Industry Revenue million Forecast, by Application 2020 & 2033
- Table 76: Global Specialty Oilfield Chemicals Industry Volume K Tons Forecast, by Application 2020 & 2033
- Table 77: Global Specialty Oilfield Chemicals Industry Revenue million Forecast, by Country 2020 & 2033
- Table 78: Global Specialty Oilfield Chemicals Industry Volume K Tons Forecast, by Country 2020 & 2033
- Table 79: Algeria Specialty Oilfield Chemicals Industry Revenue (million) Forecast, by Application 2020 & 2033
- Table 80: Algeria Specialty Oilfield Chemicals Industry Volume (K Tons) Forecast, by Application 2020 & 2033
- Table 81: Iran Specialty Oilfield Chemicals Industry Revenue (million) Forecast, by Application 2020 & 2033
- Table 82: Iran Specialty Oilfield Chemicals Industry Volume (K Tons) Forecast, by Application 2020 & 2033
- Table 83: Iraq Specialty Oilfield Chemicals Industry Revenue (million) Forecast, by Application 2020 & 2033
- Table 84: Iraq Specialty Oilfield Chemicals Industry Volume (K Tons) Forecast, by Application 2020 & 2033
- Table 85: Nigeria Specialty Oilfield Chemicals Industry Revenue (million) Forecast, by Application 2020 & 2033
- Table 86: Nigeria Specialty Oilfield Chemicals Industry Volume (K Tons) Forecast, by Application 2020 & 2033
- Table 87: Saudi Arabia Specialty Oilfield Chemicals Industry Revenue (million) Forecast, by Application 2020 & 2033
- Table 88: Saudi Arabia Specialty Oilfield Chemicals Industry Volume (K Tons) Forecast, by Application 2020 & 2033
- Table 89: Rest of Middle East and Africa Specialty Oilfield Chemicals Industry Revenue (million) Forecast, by Application 2020 & 2033
- Table 90: Rest of Middle East and Africa Specialty Oilfield Chemicals Industry Volume (K Tons) Forecast, by Application 2020 & 2033
Frequently Asked Questions
1. What is the projected Compound Annual Growth Rate (CAGR) of the Specialty Oilfield Chemicals Industry?
The projected CAGR is approximately 3.2%.
2. Which companies are prominent players in the Specialty Oilfield Chemicals Industry?
Key companies in the market include Clariant, CES Energy Solutions Corp, Chevron Phillips Chemical Company (Drilling Specialties Company), Nouryon, Zirax Limited, Solvay, Innospec Oilfield Services, Ecolab (NALCO Champion), Elementis PLC, Croda International PLC, Ashland, BASF SE, Huntsman International LLC, Kemira, Dow, Flotek Industries Inc, The Lubrizol Corporation, Baker Hughes Company, Halliburton, MPRC, Schlumberger Limited, Albemarle Corporation.
3. What are the main segments of the Specialty Oilfield Chemicals Industry?
The market segments include Chemical Type, Application.
4. Can you provide details about the market size?
The market size is estimated to be USD 29861.3 million as of 2022.
5. What are some drivers contributing to market growth?
Increased Shale Gas Exploration and Production; Rising Demand for Petroleum-based Fuel from the Transportation Industry.
6. What are the notable trends driving market growth?
Drilling and Cementing Application to Dominate the Market.
7. Are there any restraints impacting market growth?
Clean Energy Initiatives.
8. Can you provide examples of recent developments in the market?
December 2022: Champion X announced the opening of a new oilfield services chemicals lab and distribution facility in Chaguaramas, Trinidad. This lab facility will perform various analysis tests such as corrosion coupon analysis, chemical compatibility testing, and bacteria level determination in produced water.
9. What pricing options are available for accessing the report?
Pricing options include single-user, multi-user, and enterprise licenses priced at USD 3,950, USD 4,950, and USD 6,950 respectively.
10. Is the market size provided in terms of value or volume?
The market size is provided in terms of value, measured in million and volume, measured in K Tons.
11. Are there any specific market keywords associated with the report?
Yes, the market keyword associated with the report is "Specialty Oilfield Chemicals Industry," which aids in identifying and referencing the specific market segment covered.
12. How do I determine which pricing option suits my needs best?
The pricing options vary based on user requirements and access needs. Individual users may opt for single-user licenses, while businesses requiring broader access may choose multi-user or enterprise licenses for cost-effective access to the report.
13. Are there any additional resources or data provided in the Specialty Oilfield Chemicals Industry report?
While the report offers comprehensive insights, it's advisable to review the specific contents or supplementary materials provided to ascertain if additional resources or data are available.
14. How can I stay updated on further developments or reports in the Specialty Oilfield Chemicals Industry?
To stay informed about further developments, trends, and reports in the Specialty Oilfield Chemicals Industry, consider subscribing to industry newsletters, following relevant companies and organizations, or regularly checking reputable industry news sources and publications.
Methodology
Step 1 - Identification of Relevant Samples Size from Population Database


Step 2 - Approaches for Defining Global Market Size (Value, Volume* & Price*)

Note*: In applicable scenarios
Step 3 - Data Sources
Primary Research
- Web Analytics
- Survey Reports
- Research Institute
- Latest Research Reports
- Opinion Leaders
Secondary Research
- Annual Reports
- White Paper
- Latest Press Release
- Industry Association
- Paid Database
- Investor Presentations

Step 4 - Data Triangulation
Involves using different sources of information in order to increase the validity of a study
These sources are likely to be stakeholders in a program - participants, other researchers, program staff, other community members, and so on.
Then we put all data in single framework & apply various statistical tools to find out the dynamic on the market.
During the analysis stage, feedback from the stakeholder groups would be compared to determine areas of agreement as well as areas of divergence