

Key Insights
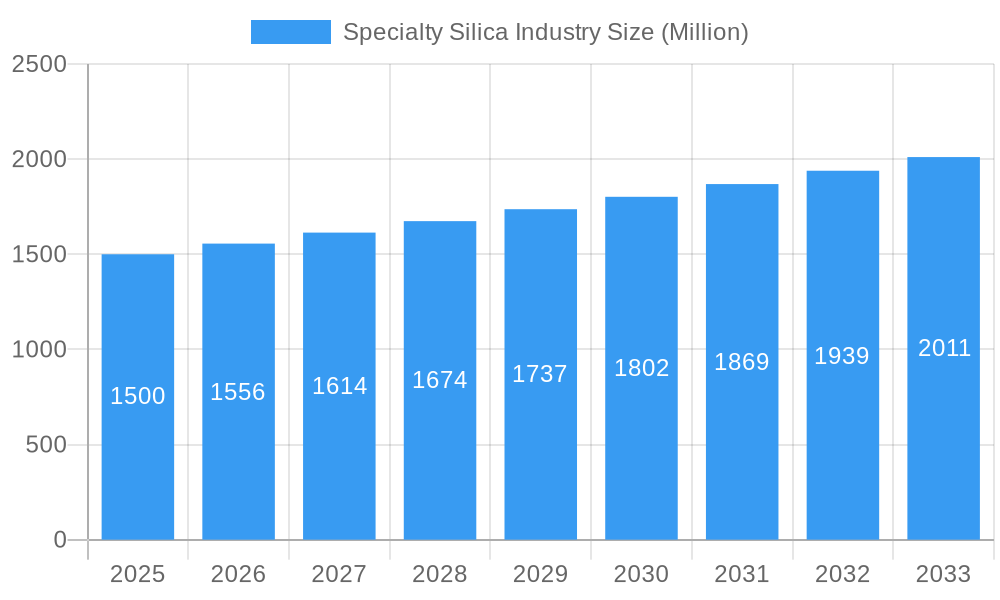
The specialty silica market, valued at approximately $XX million in 2025, is projected to experience robust growth, driven by increasing demand across diverse sectors. A Compound Annual Growth Rate (CAGR) of 3.77% from 2025 to 2033 indicates a significant expansion, fueled primarily by the burgeoning automotive, construction, and electronics industries. These sectors rely heavily on specialty silica's unique properties – high purity, specific surface area, and controlled particle size – for applications ranging from tire reinforcement and coatings to advanced electronics and pharmaceuticals. Technological advancements leading to improved silica production methods and the development of novel silica-based materials further contribute to market growth. While competitive pressures and fluctuations in raw material prices pose potential restraints, the overall market outlook remains positive, driven by continued innovation and expanding applications.
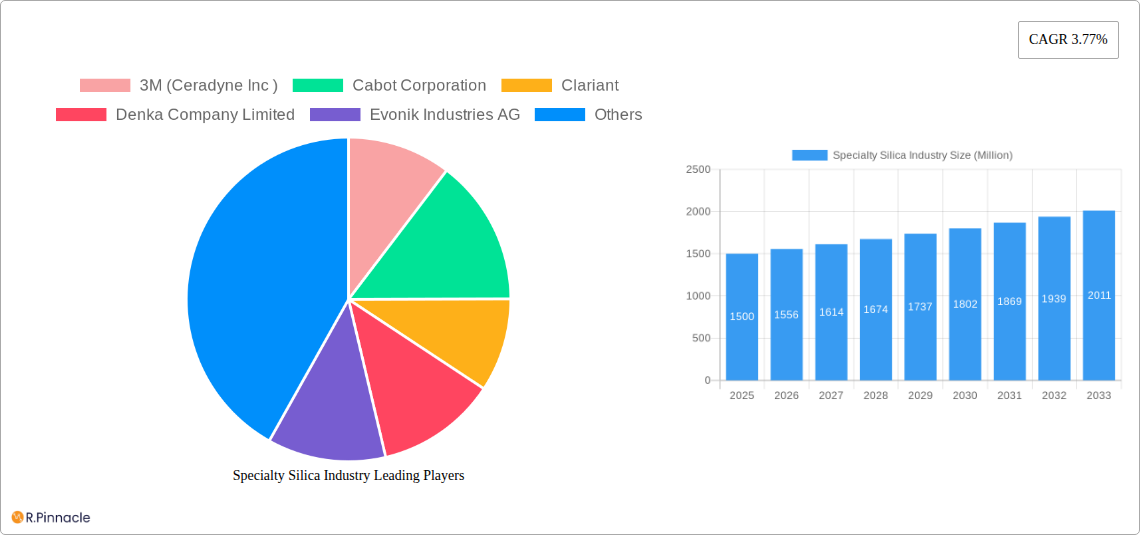
Specialty Silica Industry Market Size (In Billion)
The market is segmented by various types of specialty silica, each catering to specific application needs. Major players like 3M (Ceradyne Inc), Cabot Corporation, and Evonik Industries AG are actively involved in research and development, driving innovation and competitive differentiation. Regional variations in market size reflect differences in industrial development and adoption rates. North America and Europe currently hold significant market shares, although growth in Asia-Pacific is expected to accelerate due to rapid industrialization and rising consumer demand. The forecast period of 2025-2033 presents significant opportunities for market expansion, particularly in emerging economies where infrastructure development and technological adoption are driving demand for high-performance materials. Further research into sustainable manufacturing processes and environmentally friendly silica-based products will be crucial for long-term market sustainability and growth.
Specialty Silica Industry Company Market Share
Specialty Silica Industry Market Report: 2019-2033
This comprehensive report provides an in-depth analysis of the Specialty Silica Industry, offering invaluable insights for industry professionals, investors, and strategic decision-makers. With a detailed examination of market dynamics, competitive landscape, and future trends, this report is essential for navigating the complexities of this evolving sector. The study period covers 2019-2033, with 2025 as the base and estimated year.
Study Period: 2019–2033 Base Year: 2025 Estimated Year: 2025 Forecast Period: 2025–2033 Historical Period: 2019–2024
Specialty Silica Industry Market Structure & Innovation Trends
This section analyzes the market concentration, highlighting key players and their market share, alongside innovation drivers, regulatory landscapes, product substitutes, end-user demographics, and mergers & acquisitions (M&A) activity. The highly fragmented nature of the Specialty Silica market is explored, with a focus on the strategic implications of consolidation.
- Market Concentration: The Specialty Silica market is moderately concentrated, with the top five players accounting for approximately xx% of the global market share in 2024.
- Innovation Drivers: Sustainability initiatives, driven by increasing environmental regulations and consumer demand for eco-friendly products, are major drivers of innovation. Advancements in nanotechnology and material science are also shaping new product developments.
- Regulatory Frameworks: Stringent environmental regulations concerning silica dust and emissions are impacting manufacturing processes and prompting the adoption of cleaner production technologies.
- Product Substitutes: Competition from alternative materials, such as polymers and ceramic fillers, is influencing market dynamics and driving innovation in specialty silica applications.
- End-User Demographics: The key end-use sectors driving demand include tire manufacturing, construction, coatings, and personal care. Analysis of these sectors' growth trajectories is crucial for predicting future demand.
- M&A Activities: The past five years have witnessed several significant M&A transactions, with total deal values exceeding $xx Million. These activities reflect industry consolidation and efforts to expand product portfolios. Examples include [mention specific, significant M&A examples and associated values if available].
Specialty Silica Industry Market Dynamics & Trends
This section delves into the market growth drivers, technological advancements, evolving consumer preferences, and competitive dynamics within the Specialty Silica market. The report analyzes past performance and projects future growth, providing comprehensive insights into market trends. The market is expected to grow at a Compound Annual Growth Rate (CAGR) of xx% during the forecast period (2025-2033).
[Insert 600 words exploring market growth drivers, technological disruptions, consumer preferences, competitive dynamics, and specific metrics like CAGR and market penetration. This should build upon the points raised in the previous section and incorporate more detail.]
Dominant Regions & Segments in Specialty Silica Industry
This section identifies the leading geographical regions and market segments within the Specialty Silica industry, detailing the factors contributing to their dominance. The report highlights regional variations in demand, production, and consumption patterns.
[Insert 600 words highlighting the leading region, country, or segment, using bullet points for key drivers and paragraphs for dominance analysis.]
- Key Drivers:
- [Bullet points for specific regional and segment growth factors, such as economic policies, infrastructural development, and consumer behavior.]
[Detailed paragraph analysis of dominance, drawing on data and insights.]
Specialty Silica Industry Product Innovations
This section summarizes recent product developments, applications, and their competitive advantages within the Specialty Silica industry. The focus is on technological advancements that are shaping market trends and consumer demand.
[Insert 100-150 words summarizing product developments, applications, and competitive advantages. Focus on technological trends and market fit. For example, discuss the rise of sustainable and bio-based silica production.]
Report Scope & Segmentation Analysis
This section provides a detailed overview of the market segmentation, offering insights into each segment's growth prospects and competitive dynamics.
[Insert 100-150 words detailing all market segmentations, including growth projections, market sizes, and competitive dynamics. Use a paragraph per segment.]
Key Drivers of Specialty Silica Industry Growth
This section outlines the key factors driving the growth of the Specialty Silica industry, highlighting technological advancements, economic factors, and regulatory changes.
[Insert 150 words outlining growth drivers, using paragraphs or lists. Focus on technological, economic, and regulatory factors with specific examples.]
Challenges in the Specialty Silica Industry Sector
This section discusses the challenges and restraints facing the Specialty Silica industry, including regulatory hurdles, supply chain issues, and competitive pressures.
[Insert 150 words discussing barriers and restraints, in paragraph or list form. Address regulatory hurdles, supply chain issues, and competitive pressures with quantifiable impacts where possible.]
Emerging Opportunities in Specialty Silica Industry
This section highlights emerging trends and opportunities within the Specialty Silica industry, focusing on new markets, technologies, and evolving consumer preferences.
[Insert 150 words highlighting emerging trends and opportunities, using paragraphs or lists. Focus on new markets, technologies, or consumer preferences.]
Leading Players in the Specialty Silica Industry Market
This section lists the key players in the Specialty Silica industry. Where possible, hyperlinks to company websites are provided.
- 3M (Ceradyne Inc)
- Cabot Corporation
- Clariant
- Denka Company Limited
- Evonik Industries AG
- Fuji Silysia Chemical
- Fuso Chemical Co Ltd
- Glassven C A
- Imerys
- Merck KGaA
- Nouryon
- Orisil
- Tata Chemicals
- W R Grace & Co
- Wacker Chemie AG
*List Not Exhaustive
Key Developments in Specialty Silica Industry
This section details significant industry developments, emphasizing their impact on market dynamics.
- January 2023: Solvay announces investment in its Livorno, Italy plant to establish a unit for circular highly dispersible silica (HDS) using bio-based sodium silicate from rice husk ash, aiming for a 50% reduction in CO2 emissions per tonne of silica by the end of 2024.
- September 2022: Evonik Industries AG collaborates with Pörner Group and Phichit Bio Power to offer sustainable Ultrasil precipitated silica, reducing its CO2 footprint by 30% compared to regular silica.
Future Outlook for Specialty Silica Industry Market
This section summarizes the growth accelerators and strategic opportunities within the Specialty Silica industry, projecting future market potential.
[Insert 150 words summarizing growth accelerators, focusing on future market potential and strategic opportunities. Mention the continuing importance of sustainability and innovation.]
Specialty Silica Industry Segmentation
-
1. Type
- 1.1. Precipitated Silica
- 1.2. Silica Gel
- 1.3. Fumed Silica
- 1.4. Colloidal Silica
- 1.5. Fused Silica
-
2. Application
- 2.1. Rubber
- 2.2. Personal Care
- 2.3. Food and Feed
- 2.4. Chemicals
- 2.5. Plastics
- 2.6. Paints, Coatings and Inks
- 2.7. Metal and Refractories
- 2.8. Other Applications
Specialty Silica Industry Segmentation By Geography
-
1. Asia Pacific
- 1.1. China
- 1.2. India
- 1.3. Japan
- 1.4. South Korea
- 1.5. Rest of Asia Pacific
-
2. North America
- 2.1. United States
- 2.2. Canada
- 2.3. Mexico
-
3. Europe
- 3.1. Germany
- 3.2. United Kingdom
- 3.3. Italy
- 3.4. France
- 3.5. Rest of Europe
-
4. South America
- 4.1. Brazil
- 4.2. Argentina
- 4.3. Rest of South America
-
5. Middle East and Africa
- 5.1. Saudi Arabia
- 5.2. South Africa
- 5.3. Rest of Middle East and Africa

Specialty Silica Industry Regional Market Share
Geographic Coverage of Specialty Silica Industry
Specialty Silica Industry REPORT HIGHLIGHTS
| Aspects | Details |
|---|---|
| Study Period | 2020-2034 |
| Base Year | 2025 |
| Estimated Year | 2026 |
| Forecast Period | 2026-2034 |
| Historical Period | 2020-2025 |
| Growth Rate | CAGR of 3.77% from 2020-2034 |
| Segmentation |
|
Table of Contents
- 1. Introduction
- 1.1. Research Scope
- 1.2. Market Segmentation
- 1.3. Research Objective
- 1.4. Definitions and Assumptions
- 2. Executive Summary
- 2.1. Market Snapshot
- 3. Market Dynamics
- 3.1. Market Drivers
- 3.2. Market Restrains
- 3.3. Market Trends
- 3.4. Market Opportunities
- 4. Market Factor Analysis
- 4.1. Porters Five Forces
- 4.1.1. Bargaining Power of Suppliers
- 4.1.2. Bargaining Power of Buyers
- 4.1.3. Threat of New Entrants
- 4.1.4. Threat of Substitutes
- 4.1.5. Competitive Rivalry
- 4.2. PESTEL analysis
- 4.3. BCG Analysis
- 4.3.1. Stars (High Growth, High Market Share)
- 4.3.2. Cash Cows (Low Growth, High Market Share)
- 4.3.3. Question Mark (High Growth, Low Market Share)
- 4.3.4. Dogs (Low Growth, Low Market Share)
- 4.4. Ansoff Matrix Analysis
- 4.5. Supply Chain Analysis
- 4.6. Regulatory Landscape
- 4.7. Current Market Potential and Opportunity Assessment (TAM–SAM–SOM Framework)
- 4.8. PRI Analyst Note
- 4.1. Porters Five Forces
- 5. Market Analysis, Insights and Forecast 2021-2033
- 5.1. Market Analysis, Insights and Forecast - by Type
- 5.1.1. Precipitated Silica
- 5.1.2. Silica Gel
- 5.1.3. Fumed Silica
- 5.1.4. Colloidal Silica
- 5.1.5. Fused Silica
- 5.2. Market Analysis, Insights and Forecast - by Application
- 5.2.1. Rubber
- 5.2.2. Personal Care
- 5.2.3. Food and Feed
- 5.2.4. Chemicals
- 5.2.5. Plastics
- 5.2.6. Paints, Coatings and Inks
- 5.2.7. Metal and Refractories
- 5.2.8. Other Applications
- 5.3. Market Analysis, Insights and Forecast - by Region
- 5.3.1. Asia Pacific
- 5.3.2. North America
- 5.3.3. Europe
- 5.3.4. South America
- 5.3.5. Middle East and Africa
- 5.1. Market Analysis, Insights and Forecast - by Type
- 6. Global Specialty Silica Industry Analysis, Insights and Forecast, 2021-2033
- 6.1. Market Analysis, Insights and Forecast - by Type
- 6.1.1. Precipitated Silica
- 6.1.2. Silica Gel
- 6.1.3. Fumed Silica
- 6.1.4. Colloidal Silica
- 6.1.5. Fused Silica
- 6.2. Market Analysis, Insights and Forecast - by Application
- 6.2.1. Rubber
- 6.2.2. Personal Care
- 6.2.3. Food and Feed
- 6.2.4. Chemicals
- 6.2.5. Plastics
- 6.2.6. Paints, Coatings and Inks
- 6.2.7. Metal and Refractories
- 6.2.8. Other Applications
- 6.1. Market Analysis, Insights and Forecast - by Type
- 7. Asia Pacific Specialty Silica Industry Analysis, Insights and Forecast, 2020-2032
- 7.1. Market Analysis, Insights and Forecast - by Type
- 7.1.1. Precipitated Silica
- 7.1.2. Silica Gel
- 7.1.3. Fumed Silica
- 7.1.4. Colloidal Silica
- 7.1.5. Fused Silica
- 7.2. Market Analysis, Insights and Forecast - by Application
- 7.2.1. Rubber
- 7.2.2. Personal Care
- 7.2.3. Food and Feed
- 7.2.4. Chemicals
- 7.2.5. Plastics
- 7.2.6. Paints, Coatings and Inks
- 7.2.7. Metal and Refractories
- 7.2.8. Other Applications
- 7.1. Market Analysis, Insights and Forecast - by Type
- 8. North America Specialty Silica Industry Analysis, Insights and Forecast, 2020-2032
- 8.1. Market Analysis, Insights and Forecast - by Type
- 8.1.1. Precipitated Silica
- 8.1.2. Silica Gel
- 8.1.3. Fumed Silica
- 8.1.4. Colloidal Silica
- 8.1.5. Fused Silica
- 8.2. Market Analysis, Insights and Forecast - by Application
- 8.2.1. Rubber
- 8.2.2. Personal Care
- 8.2.3. Food and Feed
- 8.2.4. Chemicals
- 8.2.5. Plastics
- 8.2.6. Paints, Coatings and Inks
- 8.2.7. Metal and Refractories
- 8.2.8. Other Applications
- 8.1. Market Analysis, Insights and Forecast - by Type
- 9. Europe Specialty Silica Industry Analysis, Insights and Forecast, 2020-2032
- 9.1. Market Analysis, Insights and Forecast - by Type
- 9.1.1. Precipitated Silica
- 9.1.2. Silica Gel
- 9.1.3. Fumed Silica
- 9.1.4. Colloidal Silica
- 9.1.5. Fused Silica
- 9.2. Market Analysis, Insights and Forecast - by Application
- 9.2.1. Rubber
- 9.2.2. Personal Care
- 9.2.3. Food and Feed
- 9.2.4. Chemicals
- 9.2.5. Plastics
- 9.2.6. Paints, Coatings and Inks
- 9.2.7. Metal and Refractories
- 9.2.8. Other Applications
- 9.1. Market Analysis, Insights and Forecast - by Type
- 10. South America Specialty Silica Industry Analysis, Insights and Forecast, 2020-2032
- 10.1. Market Analysis, Insights and Forecast - by Type
- 10.1.1. Precipitated Silica
- 10.1.2. Silica Gel
- 10.1.3. Fumed Silica
- 10.1.4. Colloidal Silica
- 10.1.5. Fused Silica
- 10.2. Market Analysis, Insights and Forecast - by Application
- 10.2.1. Rubber
- 10.2.2. Personal Care
- 10.2.3. Food and Feed
- 10.2.4. Chemicals
- 10.2.5. Plastics
- 10.2.6. Paints, Coatings and Inks
- 10.2.7. Metal and Refractories
- 10.2.8. Other Applications
- 10.1. Market Analysis, Insights and Forecast - by Type
- 11. Middle East and Africa Specialty Silica Industry Analysis, Insights and Forecast, 2020-2032
- 11.1. Market Analysis, Insights and Forecast - by Type
- 11.1.1. Precipitated Silica
- 11.1.2. Silica Gel
- 11.1.3. Fumed Silica
- 11.1.4. Colloidal Silica
- 11.1.5. Fused Silica
- 11.2. Market Analysis, Insights and Forecast - by Application
- 11.2.1. Rubber
- 11.2.2. Personal Care
- 11.2.3. Food and Feed
- 11.2.4. Chemicals
- 11.2.5. Plastics
- 11.2.6. Paints, Coatings and Inks
- 11.2.7. Metal and Refractories
- 11.2.8. Other Applications
- 11.1. Market Analysis, Insights and Forecast - by Type
- 12. Competitive Analysis
- 12.1. Company Profiles
- 12.1.1 3M (Ceradyne Inc )
- 12.1.1.1. Company Overview
- 12.1.1.2. Products
- 12.1.1.3. Company Financials
- 12.1.1.4. SWOT Analysis
- 12.1.2 Cabot Corporation
- 12.1.2.1. Company Overview
- 12.1.2.2. Products
- 12.1.2.3. Company Financials
- 12.1.2.4. SWOT Analysis
- 12.1.3 Clariant
- 12.1.3.1. Company Overview
- 12.1.3.2. Products
- 12.1.3.3. Company Financials
- 12.1.3.4. SWOT Analysis
- 12.1.4 Denka Company Limited
- 12.1.4.1. Company Overview
- 12.1.4.2. Products
- 12.1.4.3. Company Financials
- 12.1.4.4. SWOT Analysis
- 12.1.5 Evonik Industries AG
- 12.1.5.1. Company Overview
- 12.1.5.2. Products
- 12.1.5.3. Company Financials
- 12.1.5.4. SWOT Analysis
- 12.1.6 Fuji Silysia Chemical
- 12.1.6.1. Company Overview
- 12.1.6.2. Products
- 12.1.6.3. Company Financials
- 12.1.6.4. SWOT Analysis
- 12.1.7 Fuso Chemical Co Ltd
- 12.1.7.1. Company Overview
- 12.1.7.2. Products
- 12.1.7.3. Company Financials
- 12.1.7.4. SWOT Analysis
- 12.1.8 Glassven C A
- 12.1.8.1. Company Overview
- 12.1.8.2. Products
- 12.1.8.3. Company Financials
- 12.1.8.4. SWOT Analysis
- 12.1.9 Imerys
- 12.1.9.1. Company Overview
- 12.1.9.2. Products
- 12.1.9.3. Company Financials
- 12.1.9.4. SWOT Analysis
- 12.1.10 Merck KGaA
- 12.1.10.1. Company Overview
- 12.1.10.2. Products
- 12.1.10.3. Company Financials
- 12.1.10.4. SWOT Analysis
- 12.1.11 Nouryon
- 12.1.11.1. Company Overview
- 12.1.11.2. Products
- 12.1.11.3. Company Financials
- 12.1.11.4. SWOT Analysis
- 12.1.12 Orisil
- 12.1.12.1. Company Overview
- 12.1.12.2. Products
- 12.1.12.3. Company Financials
- 12.1.12.4. SWOT Analysis
- 12.1.13 Tata Chemicals
- 12.1.13.1. Company Overview
- 12.1.13.2. Products
- 12.1.13.3. Company Financials
- 12.1.13.4. SWOT Analysis
- 12.1.14 W R Grace & Co
- 12.1.14.1. Company Overview
- 12.1.14.2. Products
- 12.1.14.3. Company Financials
- 12.1.14.4. SWOT Analysis
- 12.1.15 Wacker Chemie AG*List Not Exhaustive
- 12.1.15.1. Company Overview
- 12.1.15.2. Products
- 12.1.15.3. Company Financials
- 12.1.15.4. SWOT Analysis
- 12.1.1 3M (Ceradyne Inc )
- 12.2. Market Entropy
- 12.2.1 Company's Key Areas Served
- 12.2.2 Recent Developments
- 12.3. Company Market Share Analysis 2025
- 12.3.1 Top 5 Companies Market Share Analysis
- 12.3.2 Top 3 Companies Market Share Analysis
- 12.4. List of Potential Customers
- 13. Research Methodology
List of Figures
- Figure 1: Global Specialty Silica Industry Revenue Breakdown (Million, %) by Region 2025 & 2033
- Figure 2: Asia Pacific Specialty Silica Industry Revenue (Million), by Type 2025 & 2033
- Figure 3: Asia Pacific Specialty Silica Industry Revenue Share (%), by Type 2025 & 2033
- Figure 4: Asia Pacific Specialty Silica Industry Revenue (Million), by Application 2025 & 2033
- Figure 5: Asia Pacific Specialty Silica Industry Revenue Share (%), by Application 2025 & 2033
- Figure 6: Asia Pacific Specialty Silica Industry Revenue (Million), by Country 2025 & 2033
- Figure 7: Asia Pacific Specialty Silica Industry Revenue Share (%), by Country 2025 & 2033
- Figure 8: North America Specialty Silica Industry Revenue (Million), by Type 2025 & 2033
- Figure 9: North America Specialty Silica Industry Revenue Share (%), by Type 2025 & 2033
- Figure 10: North America Specialty Silica Industry Revenue (Million), by Application 2025 & 2033
- Figure 11: North America Specialty Silica Industry Revenue Share (%), by Application 2025 & 2033
- Figure 12: North America Specialty Silica Industry Revenue (Million), by Country 2025 & 2033
- Figure 13: North America Specialty Silica Industry Revenue Share (%), by Country 2025 & 2033
- Figure 14: Europe Specialty Silica Industry Revenue (Million), by Type 2025 & 2033
- Figure 15: Europe Specialty Silica Industry Revenue Share (%), by Type 2025 & 2033
- Figure 16: Europe Specialty Silica Industry Revenue (Million), by Application 2025 & 2033
- Figure 17: Europe Specialty Silica Industry Revenue Share (%), by Application 2025 & 2033
- Figure 18: Europe Specialty Silica Industry Revenue (Million), by Country 2025 & 2033
- Figure 19: Europe Specialty Silica Industry Revenue Share (%), by Country 2025 & 2033
- Figure 20: South America Specialty Silica Industry Revenue (Million), by Type 2025 & 2033
- Figure 21: South America Specialty Silica Industry Revenue Share (%), by Type 2025 & 2033
- Figure 22: South America Specialty Silica Industry Revenue (Million), by Application 2025 & 2033
- Figure 23: South America Specialty Silica Industry Revenue Share (%), by Application 2025 & 2033
- Figure 24: South America Specialty Silica Industry Revenue (Million), by Country 2025 & 2033
- Figure 25: South America Specialty Silica Industry Revenue Share (%), by Country 2025 & 2033
- Figure 26: Middle East and Africa Specialty Silica Industry Revenue (Million), by Type 2025 & 2033
- Figure 27: Middle East and Africa Specialty Silica Industry Revenue Share (%), by Type 2025 & 2033
- Figure 28: Middle East and Africa Specialty Silica Industry Revenue (Million), by Application 2025 & 2033
- Figure 29: Middle East and Africa Specialty Silica Industry Revenue Share (%), by Application 2025 & 2033
- Figure 30: Middle East and Africa Specialty Silica Industry Revenue (Million), by Country 2025 & 2033
- Figure 31: Middle East and Africa Specialty Silica Industry Revenue Share (%), by Country 2025 & 2033
List of Tables
- Table 1: Global Specialty Silica Industry Revenue Million Forecast, by Type 2020 & 2033
- Table 2: Global Specialty Silica Industry Revenue Million Forecast, by Application 2020 & 2033
- Table 3: Global Specialty Silica Industry Revenue Million Forecast, by Region 2020 & 2033
- Table 4: Global Specialty Silica Industry Revenue Million Forecast, by Type 2020 & 2033
- Table 5: Global Specialty Silica Industry Revenue Million Forecast, by Application 2020 & 2033
- Table 6: Global Specialty Silica Industry Revenue Million Forecast, by Country 2020 & 2033
- Table 7: China Specialty Silica Industry Revenue (Million) Forecast, by Application 2020 & 2033
- Table 8: India Specialty Silica Industry Revenue (Million) Forecast, by Application 2020 & 2033
- Table 9: Japan Specialty Silica Industry Revenue (Million) Forecast, by Application 2020 & 2033
- Table 10: South Korea Specialty Silica Industry Revenue (Million) Forecast, by Application 2020 & 2033
- Table 11: Rest of Asia Pacific Specialty Silica Industry Revenue (Million) Forecast, by Application 2020 & 2033
- Table 12: Global Specialty Silica Industry Revenue Million Forecast, by Type 2020 & 2033
- Table 13: Global Specialty Silica Industry Revenue Million Forecast, by Application 2020 & 2033
- Table 14: Global Specialty Silica Industry Revenue Million Forecast, by Country 2020 & 2033
- Table 15: United States Specialty Silica Industry Revenue (Million) Forecast, by Application 2020 & 2033
- Table 16: Canada Specialty Silica Industry Revenue (Million) Forecast, by Application 2020 & 2033
- Table 17: Mexico Specialty Silica Industry Revenue (Million) Forecast, by Application 2020 & 2033
- Table 18: Global Specialty Silica Industry Revenue Million Forecast, by Type 2020 & 2033
- Table 19: Global Specialty Silica Industry Revenue Million Forecast, by Application 2020 & 2033
- Table 20: Global Specialty Silica Industry Revenue Million Forecast, by Country 2020 & 2033
- Table 21: Germany Specialty Silica Industry Revenue (Million) Forecast, by Application 2020 & 2033
- Table 22: United Kingdom Specialty Silica Industry Revenue (Million) Forecast, by Application 2020 & 2033
- Table 23: Italy Specialty Silica Industry Revenue (Million) Forecast, by Application 2020 & 2033
- Table 24: France Specialty Silica Industry Revenue (Million) Forecast, by Application 2020 & 2033
- Table 25: Rest of Europe Specialty Silica Industry Revenue (Million) Forecast, by Application 2020 & 2033
- Table 26: Global Specialty Silica Industry Revenue Million Forecast, by Type 2020 & 2033
- Table 27: Global Specialty Silica Industry Revenue Million Forecast, by Application 2020 & 2033
- Table 28: Global Specialty Silica Industry Revenue Million Forecast, by Country 2020 & 2033
- Table 29: Brazil Specialty Silica Industry Revenue (Million) Forecast, by Application 2020 & 2033
- Table 30: Argentina Specialty Silica Industry Revenue (Million) Forecast, by Application 2020 & 2033
- Table 31: Rest of South America Specialty Silica Industry Revenue (Million) Forecast, by Application 2020 & 2033
- Table 32: Global Specialty Silica Industry Revenue Million Forecast, by Type 2020 & 2033
- Table 33: Global Specialty Silica Industry Revenue Million Forecast, by Application 2020 & 2033
- Table 34: Global Specialty Silica Industry Revenue Million Forecast, by Country 2020 & 2033
- Table 35: Saudi Arabia Specialty Silica Industry Revenue (Million) Forecast, by Application 2020 & 2033
- Table 36: South Africa Specialty Silica Industry Revenue (Million) Forecast, by Application 2020 & 2033
- Table 37: Rest of Middle East and Africa Specialty Silica Industry Revenue (Million) Forecast, by Application 2020 & 2033
Frequently Asked Questions
1. What is the projected Compound Annual Growth Rate (CAGR) of the Specialty Silica Industry?
The projected CAGR is approximately 3.77%.
2. Which companies are prominent players in the Specialty Silica Industry?
Key companies in the market include 3M (Ceradyne Inc ), Cabot Corporation, Clariant, Denka Company Limited, Evonik Industries AG, Fuji Silysia Chemical, Fuso Chemical Co Ltd, Glassven C A, Imerys, Merck KGaA, Nouryon, Orisil, Tata Chemicals, W R Grace & Co, Wacker Chemie AG*List Not Exhaustive.
3. What are the main segments of the Specialty Silica Industry?
The market segments include Type, Application.
4. Can you provide details about the market size?
The market size is estimated to be USD XX Million as of 2022.
5. What are some drivers contributing to market growth?
Growing Demand from the Rubber Industry; Increasing Utilization of Specialty Silica in Personal Care Products; Other Drivers.
6. What are the notable trends driving market growth?
Increasing Demand from the Rubber Industry.
7. Are there any restraints impacting market growth?
Growing Demand from the Rubber Industry; Increasing Utilization of Specialty Silica in Personal Care Products; Other Drivers.
8. Can you provide examples of recent developments in the market?
In January 2023, Solvay announced an investment at its Livorno, Italy, plant to establish the company's first unit of circular highly dispersible silica (HDS) created using bio-based sodium silicate generated from rice husk ash. When combined with renewable energy integration at the facility, Solvay will be able to achieve a 50% decrease in CO2 emissions per tonne of silica. In terms of CO2 footprint, this will make the Livorno location Europe's best-in-class silica manufacturing site. The new product's production is planned to begin by the end of 2024.
9. What pricing options are available for accessing the report?
Pricing options include single-user, multi-user, and enterprise licenses priced at USD 4750, USD 5250, and USD 8750 respectively.
10. Is the market size provided in terms of value or volume?
The market size is provided in terms of value, measured in Million.
11. Are there any specific market keywords associated with the report?
Yes, the market keyword associated with the report is "Specialty Silica Industry," which aids in identifying and referencing the specific market segment covered.
12. How do I determine which pricing option suits my needs best?
The pricing options vary based on user requirements and access needs. Individual users may opt for single-user licenses, while businesses requiring broader access may choose multi-user or enterprise licenses for cost-effective access to the report.
13. Are there any additional resources or data provided in the Specialty Silica Industry report?
While the report offers comprehensive insights, it's advisable to review the specific contents or supplementary materials provided to ascertain if additional resources or data are available.
14. How can I stay updated on further developments or reports in the Specialty Silica Industry?
To stay informed about further developments, trends, and reports in the Specialty Silica Industry, consider subscribing to industry newsletters, following relevant companies and organizations, or regularly checking reputable industry news sources and publications.
Methodology
Step 1 - Identification of Relevant Samples Size from Population Database


Step 2 - Approaches for Defining Global Market Size (Value, Volume* & Price*)

Note*: In applicable scenarios
Step 3 - Data Sources
Primary Research
- Web Analytics
- Survey Reports
- Research Institute
- Latest Research Reports
- Opinion Leaders
Secondary Research
- Annual Reports
- White Paper
- Latest Press Release
- Industry Association
- Paid Database
- Investor Presentations

Step 4 - Data Triangulation
Involves using different sources of information in order to increase the validity of a study
These sources are likely to be stakeholders in a program - participants, other researchers, program staff, other community members, and so on.
Then we put all data in single framework & apply various statistical tools to find out the dynamic on the market.
During the analysis stage, feedback from the stakeholder groups would be compared to determine areas of agreement as well as areas of divergence