


Key Insights
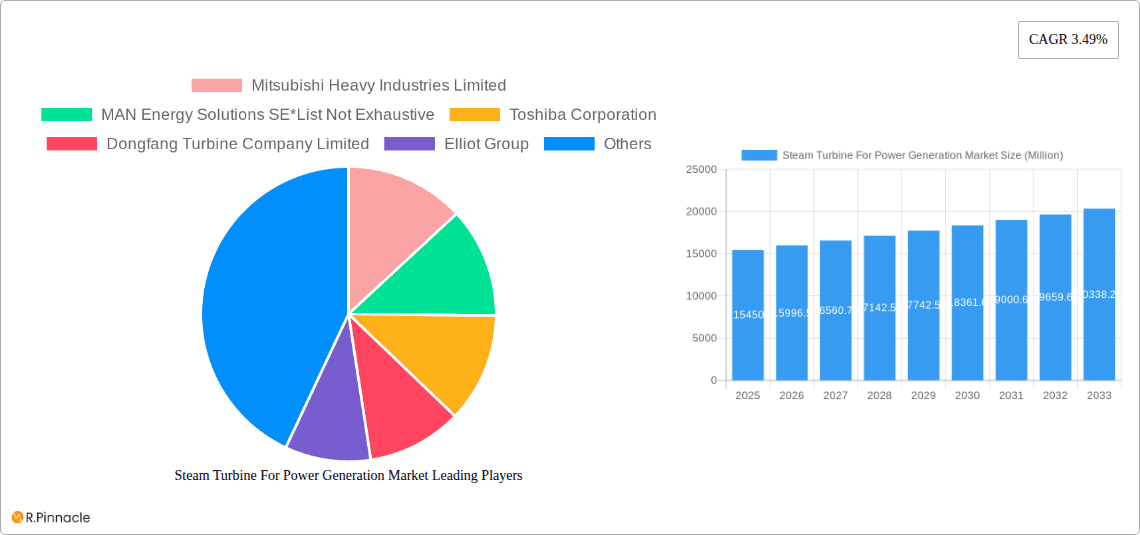
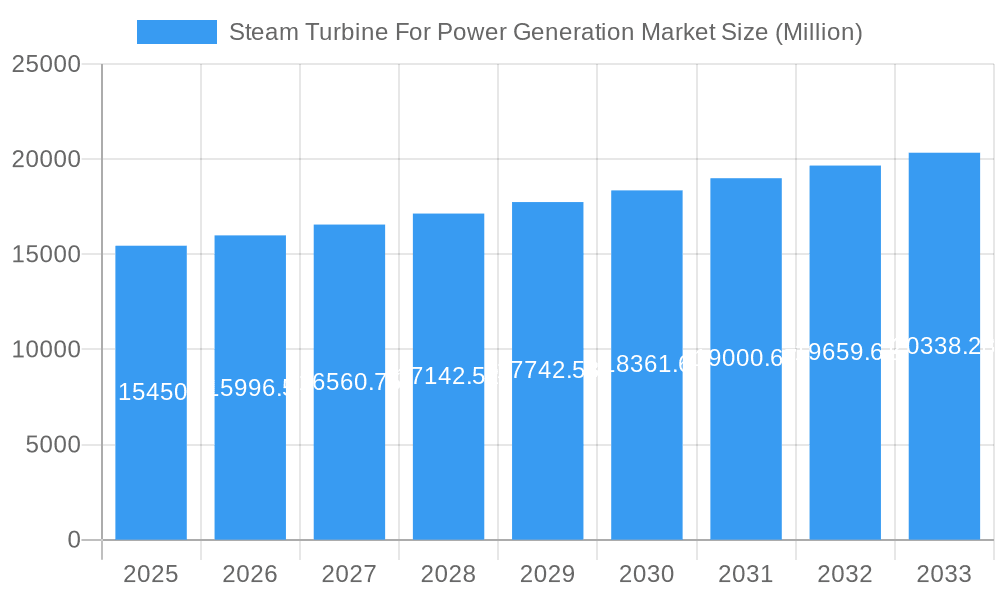
The global Steam Turbine for Power Generation market, valued at $15.45 billion in 2025, is projected to experience steady growth, driven by increasing global energy demand and the ongoing transition towards cleaner energy sources. The market's 3.49% CAGR from 2025 to 2033 indicates a consistent expansion, although this rate suggests a relatively mature market with established players. Growth is fueled by several key factors: the continued reliance on fossil fuel-based power generation, particularly in developing economies, which necessitates efficient steam turbines; the increasing adoption of combined cycle power plants (CCPPs) which utilize steam turbines for enhanced efficiency; and government initiatives promoting energy security and modernization of power infrastructure. However, the market faces restraints, including fluctuating fossil fuel prices, stringent environmental regulations leading to a shift towards renewables, and the high capital costs associated with steam turbine installation and maintenance. Segment-wise, the Gas plant type segment holds a significant share due to its widespread use and relatively lower initial investment compared to other plant types. Within the capacity segment, the 20-40 MW range is expected to demonstrate robust growth, driven by demand from mid-sized power plants and industrial applications. Major players, including Mitsubishi Heavy Industries, MAN Energy Solutions, Toshiba, and Siemens Energy, are focusing on technological advancements, such as improving efficiency, reducing emissions, and enhancing digital capabilities to maintain their competitive edge.
Steam Turbine For Power Generation Market Market Size (In Billion)

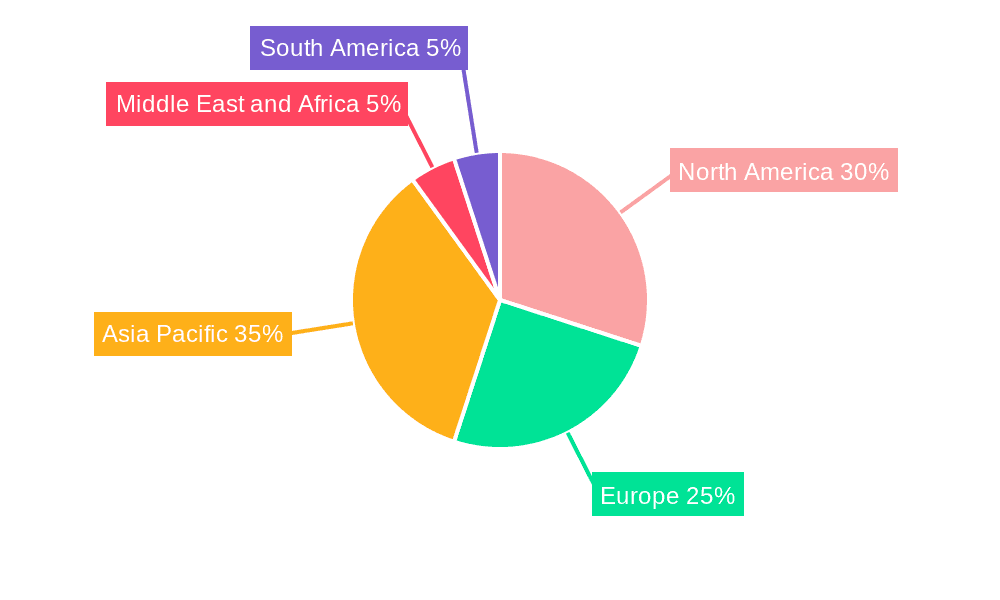
The geographic distribution of the market is diverse, with North America and Asia-Pacific leading the demand. China and India's rapid industrialization and expanding power grids contribute significantly to the Asia-Pacific region's dominance. Europe, while a mature market, shows consistent growth due to ongoing upgrades and modernization of its existing power plants. The Middle East and Africa regions, experiencing substantial economic growth and infrastructure development, are projected to witness a rise in demand for steam turbines, albeit at a slower pace than other regions. Market competition is intense, characterized by established players offering innovative solutions and newer entrants focusing on niche applications. The long-term forecast indicates sustained growth, driven by the continuous need for reliable and efficient power generation, but the rate of growth will be influenced by factors such as global economic conditions, energy policy shifts, and advancements in renewable energy technologies.
Steam Turbine For Power Generation Market Company Market Share
Steam Turbine For Power Generation Market: A Comprehensive Report (2019-2033)
This in-depth report provides a comprehensive analysis of the Steam Turbine For Power Generation Market, offering invaluable insights for industry professionals, investors, and strategic decision-makers. Covering the period from 2019 to 2033, with a focus on 2025, this report meticulously examines market dynamics, competitive landscapes, and future growth prospects. The study period is 2019–2033, the base year is 2025, the estimated year is 2025, and the forecast period is 2025–2033. The historical period covered is 2019–2024.
Steam Turbine For Power Generation Market Market Structure & Innovation Trends
This section analyzes the market structure, highlighting key trends shaping the industry. The report delves into market concentration, assessing the market share held by leading players such as Mitsubishi Heavy Industries Limited, MAN Energy Solutions SE, Toshiba Corporation, Dongfang Turbine Company Limited, Elliot Group, Bharat Heavy Electricals Limited, WEG S A, Doosan Enerbility Co Ltd, Siemens Energy AG, and General Electric Company. The analysis also considers the impact of mergers and acquisitions (M&A) activities, providing an overview of recent deals and their influence on market dynamics. Specific M&A deal values, while not publicly available for all transactions, are estimated where possible (xx Million USD). Furthermore, the report examines innovation drivers, including technological advancements in turbine design and efficiency, and regulatory frameworks impacting the adoption of steam turbines in power generation. The analysis also covers the influence of substitute technologies and end-user demographics on market growth. A detailed assessment of the competitive landscape, including strategies employed by major players and their market share, is provided, offering strategic insights for businesses operating in this sector. The report includes estimates on market share for key players, calculated using available public data and market estimates. For example, Mitsubishi Heavy Industries Limited may hold approximately xx% market share, while General Electric Company might hold around yy%. These figures are estimates and are subject to further verification through specialized market intelligence providers.
Steam Turbine For Power Generation Market Market Dynamics & Trends
This section explores the key drivers and trends influencing the growth of the steam turbine market for power generation. The analysis focuses on factors such as the increasing global energy demand, the rising need for efficient and reliable power generation solutions, and government initiatives promoting renewable energy integration. The report estimates a Compound Annual Growth Rate (CAGR) of xx% for the forecast period (2025-2033), driven by factors such as increasing investments in power generation infrastructure and the adoption of advanced technologies like supercritical and ultra-supercritical steam turbines. The market penetration rate for steam turbines in various power generation segments (Gas, Coal, Nuclear) will be meticulously analyzed, with projections for increased adoption in emerging markets. Technological disruptions, such as the development of more efficient and sustainable steam turbine designs, are also discussed, along with their impact on market dynamics. The report thoroughly examines consumer preferences, focusing on trends like the growing demand for environmentally friendly power generation solutions and the increasing adoption of smart grid technologies. Competitive dynamics are analyzed through a Porter's Five Forces framework, which will provide detailed insight into competitive rivalry, the bargaining power of buyers and suppliers, the threat of new entrants, and the threat of substitute products.
Dominant Regions & Segments in Steam Turbine For Power Generation Market
This section identifies the leading regions and segments within the steam turbine for power generation market. The analysis considers various factors such as regional energy consumption patterns, government policies, economic growth, and infrastructure development. The report may conclude that Asia-Pacific region exhibits the highest market dominance, driven by substantial investments in coal and gas-fired power plants.
Leading Regions: Asia-Pacific (xx Million USD market size in 2025, xx% market share), North America (yy Million USD market size in 2025, yy% market share), Europe (zz Million USD market size in 2025, zz% market share). (Note: These figures are estimates and require detailed analysis.)
Plant Type: Coal-fired power plants dominate the market, followed by gas-fired plants, with Other Plant Types (Nuclear, CHP) showing steady, though slower, growth. The report will quantify the size of each of the market segments.
Capacity: The segment of steam turbines with capacity Above 40 MW currently holds the largest market share, with steady growth expected due to large-scale power projects. However, the smaller capacity segments (Less than 20 MW and 20-40 MW) show promising growth potential, driven by decentralized power generation and renewable energy integration. Specific market size and growth projections for each capacity segment will be incorporated.
The detailed dominance analysis for each region and segment will explain the factors driving their performance in the market. For example, government policies supporting renewable energy sources will positively impact the “Other Plant Types” segment, while economic growth will spur demand for larger capacity steam turbines. Each region's specific economic policies and infrastructure development will be examined to elucidate their influence on steam turbine market dominance.
Steam Turbine For Power Generation Market Product Innovations
Recent product developments in the steam turbine for power generation market focus on improving efficiency, reducing emissions, and enhancing reliability. Manufacturers are investing in advanced materials, digital technologies, and optimized designs to create more efficient and sustainable steam turbines. This includes innovations in blade design, control systems, and integration with renewable energy sources. These innovations improve market fit by addressing the growing demand for cleaner and more efficient power generation. The competitive advantages gained through these innovations include reduced operating costs and improved environmental performance.
Report Scope & Segmentation Analysis
This report comprehensively segments the steam turbine for power generation market based on plant type (Gas, Coal, Other Plant Types), and capacity (Less than 20 MW, 20-40 MW, Above 40 MW). Each segment's growth projections, market sizes (in Millions of USD), and competitive dynamics are analyzed in detail. The report presents separate sections for each segment, providing comprehensive analysis for each of them.
Plant Type: Gas-fired steam turbines are expected to exhibit growth due to their relative efficiency and lower emissions compared to coal. Coal-fired steam turbines, despite environmental concerns, will retain a significant portion of the market share due to their established presence in many regions. The "Other Plant Types" segment, though smaller, is anticipated to witness growth driven by the increasing adoption of nuclear and CHP (Combined Heat and Power) technologies.
Capacity: The "Above 40 MW" capacity segment dominates the market due to large-scale power generation projects. The "Less than 20 MW" and "20-40 MW" segments, however, are predicted to demonstrate considerable growth, driven by the increasing trend towards decentralized power generation and smaller-scale renewable energy projects.
Key Drivers of Steam Turbine For Power Generation Market Growth
Several factors drive the growth of the steam turbine for power generation market. Technological advancements leading to increased efficiency and reduced emissions are key drivers. Economic growth and rising energy demand, particularly in developing countries, also fuel market expansion. Government policies and regulations supporting renewable energy integration and promoting clean energy sources play a significant role. For instance, many governments are providing subsidies and incentives for companies to adopt greener technologies, positively impacting the adoption of more efficient steam turbine models.
Challenges in the Steam Turbine For Power Generation Market Sector
The steam turbine for power generation market faces several challenges. Stringent environmental regulations and the need to reduce carbon emissions pose significant hurdles. Supply chain disruptions and rising material costs impact production and profitability. Intense competition among established players and the emergence of new technologies present further challenges. The increasing cost of raw materials such as coal or natural gas, coupled with fluctuations in their prices, has a significant impact on the financial viability of steam turbine power plants. Furthermore, the complexities involved in acquiring permits and licenses for constructing power plants add to the challenges.
Emerging Opportunities in Steam Turbine For Power Generation Market
Emerging opportunities exist in the steam turbine market for power generation. The growing demand for efficient power generation in emerging economies presents significant potential. The integration of steam turbines with renewable energy sources, such as solar and wind power, offers considerable opportunities for hybrid power generation systems. Advancements in digital technologies, including the use of artificial intelligence and machine learning, provide avenues for improved operation and maintenance of steam turbines.
Leading Players in the Steam Turbine For Power Generation Market Market
Key Developments in Steam Turbine For Power Generation Market Industry
April 2023: Doosan Koda Power secured a contract to supply a steam turbine for the South Clyde Energy Centre in Scotland, a facility utilizing energy-from-waste. This project highlights the growing market for sustainable energy solutions and will power approximately 70,000 homes upon completion in 2025.
April 2023: The Thar Block-1 thermal power plant commenced commercial operation in Pakistan. This 1,320 MW project, integrated with Shanghai Electric's steam turbines and other equipment, demonstrates the continued demand for large-scale power generation.
January 2023: Bharat Heavy Electricals Limited (BHEL) was awarded a USD 36.46 Million contract for the rehabilitation and modernization of steam turbines at Gujarat's Ukai Thermal Power Station. This deal emphasizes the ongoing need for maintenance and upgrades in existing power plants.
Future Outlook for Steam Turbine For Power Generation Market Market
The future of the steam turbine for power generation market appears promising. Continued growth is anticipated, driven by factors such as increasing energy demand, rising investments in power infrastructure, and technological advancements. Strategic opportunities exist for companies to develop more efficient and sustainable steam turbines, integrating them with renewable energy sources, and exploring emerging markets. The market will likely witness increased competition among major players, necessitating innovation and strategic partnerships to maintain market share. The focus on sustainability and emissions reduction will also influence market trends.
Steam Turbine For Power Generation Market Segmentation
-
1. Plant Type
- 1.1. Gas
- 1.2. Coal
- 1.3. Other Plant Types (Nuclear, CHP, etc.)
-
2. Capacity
- 2.1. Below 40 MW
- 2.2. Above 40 MW
Steam Turbine For Power Generation Market Segmentation By Geography
-
1. North America
- 1.1. United States
- 1.2. Canada
- 1.3. Rest of North America
-
2. Asia Pacific
- 2.1. China
- 2.2. India
- 2.3. Japan
- 2.4. South Korea
- 2.5. Malaysia
- 2.6. Thailand
- 2.7. Indonesia
- 2.8. Vietnam
- 2.9. Rest of Asia Pacific
-
3. Europe
- 3.1. Germany
- 3.2. France
- 3.3. United Kingdom
- 3.4. Italy
- 3.5. Spain
- 3.6. NORDIC
- 3.7. Turkey
- 3.8. Russia
- 3.9. Rest of Europe
-
4. Middle East and Africa
- 4.1. Saudi Arabia
- 4.2. United Arab Emirates
- 4.3. South Africa
- 4.4. Qatar
- 4.5. Nigeria
- 4.6. Oman
- 4.7. Egypt
- 4.8. Algeria
- 4.9. Rest of Middle East and Africa
-
5. South America
- 5.1. Brazil
- 5.2. Argentina
- 5.3. Colombia
- 5.4. Rest of South America
Steam Turbine For Power Generation Market Regional Market Share
Geographic Coverage of Steam Turbine For Power Generation Market
Steam Turbine For Power Generation Market REPORT HIGHLIGHTS
| Aspects | Details |
|---|---|
| Study Period | 2020-2034 |
| Base Year | 2025 |
| Estimated Year | 2026 |
| Forecast Period | 2026-2034 |
| Historical Period | 2020-2025 |
| Growth Rate | CAGR of 3.49% from 2020-2034 |
| Segmentation |
|
Table of Contents
- 1. Introduction
- 1.1. Research Scope
- 1.2. Market Segmentation
- 1.3. Research Methodology
- 1.4. Definitions and Assumptions
- 2. Executive Summary
- 2.1. Introduction
- 3. Market Dynamics
- 3.1. Introduction
- 3.2. Market Drivers
- 3.2.1. 4.; Need for Continuous 24/7 Supply of Electricity 4.; Increasing Penetration of Natural Gas for Power Generation
- 3.3. Market Restrains
- 3.3.1. 4.; The Complex Maintenance Process of Components And the Emergence of Toxic Wastes that Affect the Environment
- 3.4. Market Trends
- 3.4.1. Natural Gas Plants to Witness Significant Growth
- 4. Market Factor Analysis
- 4.1. Porters Five Forces
- 4.2. Supply/Value Chain
- 4.3. PESTEL analysis
- 4.4. Market Entropy
- 4.5. Patent/Trademark Analysis
- 5. Global Steam Turbine For Power Generation Market Analysis, Insights and Forecast, 2020-2032
- 5.1. Market Analysis, Insights and Forecast - by Plant Type
- 5.1.1. Gas
- 5.1.2. Coal
- 5.1.3. Other Plant Types (Nuclear, CHP, etc.)
- 5.2. Market Analysis, Insights and Forecast - by Capacity
- 5.2.1. Below 40 MW
- 5.2.2. Above 40 MW
- 5.3. Market Analysis, Insights and Forecast - by Region
- 5.3.1. North America
- 5.3.2. Asia Pacific
- 5.3.3. Europe
- 5.3.4. Middle East and Africa
- 5.3.5. South America
- 5.1. Market Analysis, Insights and Forecast - by Plant Type
- 6. North America Steam Turbine For Power Generation Market Analysis, Insights and Forecast, 2020-2032
- 6.1. Market Analysis, Insights and Forecast - by Plant Type
- 6.1.1. Gas
- 6.1.2. Coal
- 6.1.3. Other Plant Types (Nuclear, CHP, etc.)
- 6.2. Market Analysis, Insights and Forecast - by Capacity
- 6.2.1. Below 40 MW
- 6.2.2. Above 40 MW
- 6.1. Market Analysis, Insights and Forecast - by Plant Type
- 7. Asia Pacific Steam Turbine For Power Generation Market Analysis, Insights and Forecast, 2020-2032
- 7.1. Market Analysis, Insights and Forecast - by Plant Type
- 7.1.1. Gas
- 7.1.2. Coal
- 7.1.3. Other Plant Types (Nuclear, CHP, etc.)
- 7.2. Market Analysis, Insights and Forecast - by Capacity
- 7.2.1. Below 40 MW
- 7.2.2. Above 40 MW
- 7.1. Market Analysis, Insights and Forecast - by Plant Type
- 8. Europe Steam Turbine For Power Generation Market Analysis, Insights and Forecast, 2020-2032
- 8.1. Market Analysis, Insights and Forecast - by Plant Type
- 8.1.1. Gas
- 8.1.2. Coal
- 8.1.3. Other Plant Types (Nuclear, CHP, etc.)
- 8.2. Market Analysis, Insights and Forecast - by Capacity
- 8.2.1. Below 40 MW
- 8.2.2. Above 40 MW
- 8.1. Market Analysis, Insights and Forecast - by Plant Type
- 9. Middle East and Africa Steam Turbine For Power Generation Market Analysis, Insights and Forecast, 2020-2032
- 9.1. Market Analysis, Insights and Forecast - by Plant Type
- 9.1.1. Gas
- 9.1.2. Coal
- 9.1.3. Other Plant Types (Nuclear, CHP, etc.)
- 9.2. Market Analysis, Insights and Forecast - by Capacity
- 9.2.1. Below 40 MW
- 9.2.2. Above 40 MW
- 9.1. Market Analysis, Insights and Forecast - by Plant Type
- 10. South America Steam Turbine For Power Generation Market Analysis, Insights and Forecast, 2020-2032
- 10.1. Market Analysis, Insights and Forecast - by Plant Type
- 10.1.1. Gas
- 10.1.2. Coal
- 10.1.3. Other Plant Types (Nuclear, CHP, etc.)
- 10.2. Market Analysis, Insights and Forecast - by Capacity
- 10.2.1. Below 40 MW
- 10.2.2. Above 40 MW
- 10.1. Market Analysis, Insights and Forecast - by Plant Type
- 11. Competitive Analysis
- 11.1. Global Market Share Analysis 2025
- 11.2. Company Profiles
- 11.2.1 Mitsubishi Heavy Industries Limited
- 11.2.1.1. Overview
- 11.2.1.2. Products
- 11.2.1.3. SWOT Analysis
- 11.2.1.4. Recent Developments
- 11.2.1.5. Financials (Based on Availability)
- 11.2.2 MAN Energy Solutions SE*List Not Exhaustive
- 11.2.2.1. Overview
- 11.2.2.2. Products
- 11.2.2.3. SWOT Analysis
- 11.2.2.4. Recent Developments
- 11.2.2.5. Financials (Based on Availability)
- 11.2.3 Toshiba Corporation
- 11.2.3.1. Overview
- 11.2.3.2. Products
- 11.2.3.3. SWOT Analysis
- 11.2.3.4. Recent Developments
- 11.2.3.5. Financials (Based on Availability)
- 11.2.4 Dongfang Turbine Company Limited
- 11.2.4.1. Overview
- 11.2.4.2. Products
- 11.2.4.3. SWOT Analysis
- 11.2.4.4. Recent Developments
- 11.2.4.5. Financials (Based on Availability)
- 11.2.5 Elliot Group
- 11.2.5.1. Overview
- 11.2.5.2. Products
- 11.2.5.3. SWOT Analysis
- 11.2.5.4. Recent Developments
- 11.2.5.5. Financials (Based on Availability)
- 11.2.6 Bharat Heavy Electricals Limited
- 11.2.6.1. Overview
- 11.2.6.2. Products
- 11.2.6.3. SWOT Analysis
- 11.2.6.4. Recent Developments
- 11.2.6.5. Financials (Based on Availability)
- 11.2.7 WEG S A
- 11.2.7.1. Overview
- 11.2.7.2. Products
- 11.2.7.3. SWOT Analysis
- 11.2.7.4. Recent Developments
- 11.2.7.5. Financials (Based on Availability)
- 11.2.8 Doosan Enerbility Co Ltd
- 11.2.8.1. Overview
- 11.2.8.2. Products
- 11.2.8.3. SWOT Analysis
- 11.2.8.4. Recent Developments
- 11.2.8.5. Financials (Based on Availability)
- 11.2.9 Siemens Energy AG
- 11.2.9.1. Overview
- 11.2.9.2. Products
- 11.2.9.3. SWOT Analysis
- 11.2.9.4. Recent Developments
- 11.2.9.5. Financials (Based on Availability)
- 11.2.10 General Electric Company
- 11.2.10.1. Overview
- 11.2.10.2. Products
- 11.2.10.3. SWOT Analysis
- 11.2.10.4. Recent Developments
- 11.2.10.5. Financials (Based on Availability)
- 11.2.1 Mitsubishi Heavy Industries Limited
List of Figures
- Figure 1: Global Steam Turbine For Power Generation Market Revenue Breakdown (Million, %) by Region 2025 & 2033
- Figure 2: North America Steam Turbine For Power Generation Market Revenue (Million), by Plant Type 2025 & 2033
- Figure 3: North America Steam Turbine For Power Generation Market Revenue Share (%), by Plant Type 2025 & 2033
- Figure 4: North America Steam Turbine For Power Generation Market Revenue (Million), by Capacity 2025 & 2033
- Figure 5: North America Steam Turbine For Power Generation Market Revenue Share (%), by Capacity 2025 & 2033
- Figure 6: North America Steam Turbine For Power Generation Market Revenue (Million), by Country 2025 & 2033
- Figure 7: North America Steam Turbine For Power Generation Market Revenue Share (%), by Country 2025 & 2033
- Figure 8: Asia Pacific Steam Turbine For Power Generation Market Revenue (Million), by Plant Type 2025 & 2033
- Figure 9: Asia Pacific Steam Turbine For Power Generation Market Revenue Share (%), by Plant Type 2025 & 2033
- Figure 10: Asia Pacific Steam Turbine For Power Generation Market Revenue (Million), by Capacity 2025 & 2033
- Figure 11: Asia Pacific Steam Turbine For Power Generation Market Revenue Share (%), by Capacity 2025 & 2033
- Figure 12: Asia Pacific Steam Turbine For Power Generation Market Revenue (Million), by Country 2025 & 2033
- Figure 13: Asia Pacific Steam Turbine For Power Generation Market Revenue Share (%), by Country 2025 & 2033
- Figure 14: Europe Steam Turbine For Power Generation Market Revenue (Million), by Plant Type 2025 & 2033
- Figure 15: Europe Steam Turbine For Power Generation Market Revenue Share (%), by Plant Type 2025 & 2033
- Figure 16: Europe Steam Turbine For Power Generation Market Revenue (Million), by Capacity 2025 & 2033
- Figure 17: Europe Steam Turbine For Power Generation Market Revenue Share (%), by Capacity 2025 & 2033
- Figure 18: Europe Steam Turbine For Power Generation Market Revenue (Million), by Country 2025 & 2033
- Figure 19: Europe Steam Turbine For Power Generation Market Revenue Share (%), by Country 2025 & 2033
- Figure 20: Middle East and Africa Steam Turbine For Power Generation Market Revenue (Million), by Plant Type 2025 & 2033
- Figure 21: Middle East and Africa Steam Turbine For Power Generation Market Revenue Share (%), by Plant Type 2025 & 2033
- Figure 22: Middle East and Africa Steam Turbine For Power Generation Market Revenue (Million), by Capacity 2025 & 2033
- Figure 23: Middle East and Africa Steam Turbine For Power Generation Market Revenue Share (%), by Capacity 2025 & 2033
- Figure 24: Middle East and Africa Steam Turbine For Power Generation Market Revenue (Million), by Country 2025 & 2033
- Figure 25: Middle East and Africa Steam Turbine For Power Generation Market Revenue Share (%), by Country 2025 & 2033
- Figure 26: South America Steam Turbine For Power Generation Market Revenue (Million), by Plant Type 2025 & 2033
- Figure 27: South America Steam Turbine For Power Generation Market Revenue Share (%), by Plant Type 2025 & 2033
- Figure 28: South America Steam Turbine For Power Generation Market Revenue (Million), by Capacity 2025 & 2033
- Figure 29: South America Steam Turbine For Power Generation Market Revenue Share (%), by Capacity 2025 & 2033
- Figure 30: South America Steam Turbine For Power Generation Market Revenue (Million), by Country 2025 & 2033
- Figure 31: South America Steam Turbine For Power Generation Market Revenue Share (%), by Country 2025 & 2033
List of Tables
- Table 1: Global Steam Turbine For Power Generation Market Revenue Million Forecast, by Plant Type 2020 & 2033
- Table 2: Global Steam Turbine For Power Generation Market Revenue Million Forecast, by Capacity 2020 & 2033
- Table 3: Global Steam Turbine For Power Generation Market Revenue Million Forecast, by Region 2020 & 2033
- Table 4: Global Steam Turbine For Power Generation Market Revenue Million Forecast, by Plant Type 2020 & 2033
- Table 5: Global Steam Turbine For Power Generation Market Revenue Million Forecast, by Capacity 2020 & 2033
- Table 6: Global Steam Turbine For Power Generation Market Revenue Million Forecast, by Country 2020 & 2033
- Table 7: United States Steam Turbine For Power Generation Market Revenue (Million) Forecast, by Application 2020 & 2033
- Table 8: Canada Steam Turbine For Power Generation Market Revenue (Million) Forecast, by Application 2020 & 2033
- Table 9: Rest of North America Steam Turbine For Power Generation Market Revenue (Million) Forecast, by Application 2020 & 2033
- Table 10: Global Steam Turbine For Power Generation Market Revenue Million Forecast, by Plant Type 2020 & 2033
- Table 11: Global Steam Turbine For Power Generation Market Revenue Million Forecast, by Capacity 2020 & 2033
- Table 12: Global Steam Turbine For Power Generation Market Revenue Million Forecast, by Country 2020 & 2033
- Table 13: China Steam Turbine For Power Generation Market Revenue (Million) Forecast, by Application 2020 & 2033
- Table 14: India Steam Turbine For Power Generation Market Revenue (Million) Forecast, by Application 2020 & 2033
- Table 15: Japan Steam Turbine For Power Generation Market Revenue (Million) Forecast, by Application 2020 & 2033
- Table 16: South Korea Steam Turbine For Power Generation Market Revenue (Million) Forecast, by Application 2020 & 2033
- Table 17: Malaysia Steam Turbine For Power Generation Market Revenue (Million) Forecast, by Application 2020 & 2033
- Table 18: Thailand Steam Turbine For Power Generation Market Revenue (Million) Forecast, by Application 2020 & 2033
- Table 19: Indonesia Steam Turbine For Power Generation Market Revenue (Million) Forecast, by Application 2020 & 2033
- Table 20: Vietnam Steam Turbine For Power Generation Market Revenue (Million) Forecast, by Application 2020 & 2033
- Table 21: Rest of Asia Pacific Steam Turbine For Power Generation Market Revenue (Million) Forecast, by Application 2020 & 2033
- Table 22: Global Steam Turbine For Power Generation Market Revenue Million Forecast, by Plant Type 2020 & 2033
- Table 23: Global Steam Turbine For Power Generation Market Revenue Million Forecast, by Capacity 2020 & 2033
- Table 24: Global Steam Turbine For Power Generation Market Revenue Million Forecast, by Country 2020 & 2033
- Table 25: Germany Steam Turbine For Power Generation Market Revenue (Million) Forecast, by Application 2020 & 2033
- Table 26: France Steam Turbine For Power Generation Market Revenue (Million) Forecast, by Application 2020 & 2033
- Table 27: United Kingdom Steam Turbine For Power Generation Market Revenue (Million) Forecast, by Application 2020 & 2033
- Table 28: Italy Steam Turbine For Power Generation Market Revenue (Million) Forecast, by Application 2020 & 2033
- Table 29: Spain Steam Turbine For Power Generation Market Revenue (Million) Forecast, by Application 2020 & 2033
- Table 30: NORDIC Steam Turbine For Power Generation Market Revenue (Million) Forecast, by Application 2020 & 2033
- Table 31: Turkey Steam Turbine For Power Generation Market Revenue (Million) Forecast, by Application 2020 & 2033
- Table 32: Russia Steam Turbine For Power Generation Market Revenue (Million) Forecast, by Application 2020 & 2033
- Table 33: Rest of Europe Steam Turbine For Power Generation Market Revenue (Million) Forecast, by Application 2020 & 2033
- Table 34: Global Steam Turbine For Power Generation Market Revenue Million Forecast, by Plant Type 2020 & 2033
- Table 35: Global Steam Turbine For Power Generation Market Revenue Million Forecast, by Capacity 2020 & 2033
- Table 36: Global Steam Turbine For Power Generation Market Revenue Million Forecast, by Country 2020 & 2033
- Table 37: Saudi Arabia Steam Turbine For Power Generation Market Revenue (Million) Forecast, by Application 2020 & 2033
- Table 38: United Arab Emirates Steam Turbine For Power Generation Market Revenue (Million) Forecast, by Application 2020 & 2033
- Table 39: South Africa Steam Turbine For Power Generation Market Revenue (Million) Forecast, by Application 2020 & 2033
- Table 40: Qatar Steam Turbine For Power Generation Market Revenue (Million) Forecast, by Application 2020 & 2033
- Table 41: Nigeria Steam Turbine For Power Generation Market Revenue (Million) Forecast, by Application 2020 & 2033
- Table 42: Oman Steam Turbine For Power Generation Market Revenue (Million) Forecast, by Application 2020 & 2033
- Table 43: Egypt Steam Turbine For Power Generation Market Revenue (Million) Forecast, by Application 2020 & 2033
- Table 44: Algeria Steam Turbine For Power Generation Market Revenue (Million) Forecast, by Application 2020 & 2033
- Table 45: Rest of Middle East and Africa Steam Turbine For Power Generation Market Revenue (Million) Forecast, by Application 2020 & 2033
- Table 46: Global Steam Turbine For Power Generation Market Revenue Million Forecast, by Plant Type 2020 & 2033
- Table 47: Global Steam Turbine For Power Generation Market Revenue Million Forecast, by Capacity 2020 & 2033
- Table 48: Global Steam Turbine For Power Generation Market Revenue Million Forecast, by Country 2020 & 2033
- Table 49: Brazil Steam Turbine For Power Generation Market Revenue (Million) Forecast, by Application 2020 & 2033
- Table 50: Argentina Steam Turbine For Power Generation Market Revenue (Million) Forecast, by Application 2020 & 2033
- Table 51: Colombia Steam Turbine For Power Generation Market Revenue (Million) Forecast, by Application 2020 & 2033
- Table 52: Rest of South America Steam Turbine For Power Generation Market Revenue (Million) Forecast, by Application 2020 & 2033
Frequently Asked Questions
1. What is the projected Compound Annual Growth Rate (CAGR) of the Steam Turbine For Power Generation Market?
The projected CAGR is approximately 3.49%.
2. Which companies are prominent players in the Steam Turbine For Power Generation Market?
Key companies in the market include Mitsubishi Heavy Industries Limited, MAN Energy Solutions SE*List Not Exhaustive, Toshiba Corporation, Dongfang Turbine Company Limited, Elliot Group, Bharat Heavy Electricals Limited, WEG S A, Doosan Enerbility Co Ltd, Siemens Energy AG, General Electric Company.
3. What are the main segments of the Steam Turbine For Power Generation Market?
The market segments include Plant Type, Capacity.
4. Can you provide details about the market size?
The market size is estimated to be USD 15.45 Million as of 2022.
5. What are some drivers contributing to market growth?
4.; Need for Continuous 24/7 Supply of Electricity 4.; Increasing Penetration of Natural Gas for Power Generation.
6. What are the notable trends driving market growth?
Natural Gas Plants to Witness Significant Growth.
7. Are there any restraints impacting market growth?
4.; The Complex Maintenance Process of Components And the Emergence of Toxic Wastes that Affect the Environment.
8. Can you provide examples of recent developments in the market?
April 2023: Doosan Koda Power was awarded a contract to supply a steam turbine to the South Clyde Energy Centre, a Scottish energy-from-waste (EfW) facility. When completed, this new facility will likely power 70,000 homes. Commercial operations will begin in 2025, with Scotland's ban on landfilling biodegradable municipal garbage.
9. What pricing options are available for accessing the report?
Pricing options include single-user, multi-user, and enterprise licenses priced at USD 4750, USD 5250, and USD 8750 respectively.
10. Is the market size provided in terms of value or volume?
The market size is provided in terms of value, measured in Million.
11. Are there any specific market keywords associated with the report?
Yes, the market keyword associated with the report is "Steam Turbine For Power Generation Market," which aids in identifying and referencing the specific market segment covered.
12. How do I determine which pricing option suits my needs best?
The pricing options vary based on user requirements and access needs. Individual users may opt for single-user licenses, while businesses requiring broader access may choose multi-user or enterprise licenses for cost-effective access to the report.
13. Are there any additional resources or data provided in the Steam Turbine For Power Generation Market report?
While the report offers comprehensive insights, it's advisable to review the specific contents or supplementary materials provided to ascertain if additional resources or data are available.
14. How can I stay updated on further developments or reports in the Steam Turbine For Power Generation Market?
To stay informed about further developments, trends, and reports in the Steam Turbine For Power Generation Market, consider subscribing to industry newsletters, following relevant companies and organizations, or regularly checking reputable industry news sources and publications.
Methodology
Step 1 - Identification of Relevant Samples Size from Population Database


Step 2 - Approaches for Defining Global Market Size (Value, Volume* & Price*)

Note*: In applicable scenarios
Step 3 - Data Sources
Primary Research
- Web Analytics
- Survey Reports
- Research Institute
- Latest Research Reports
- Opinion Leaders
Secondary Research
- Annual Reports
- White Paper
- Latest Press Release
- Industry Association
- Paid Database
- Investor Presentations

Step 4 - Data Triangulation
Involves using different sources of information in order to increase the validity of a study
These sources are likely to be stakeholders in a program - participants, other researchers, program staff, other community members, and so on.
Then we put all data in single framework & apply various statistical tools to find out the dynamic on the market.
During the analysis stage, feedback from the stakeholder groups would be compared to determine areas of agreement as well as areas of divergence