

Key Insights
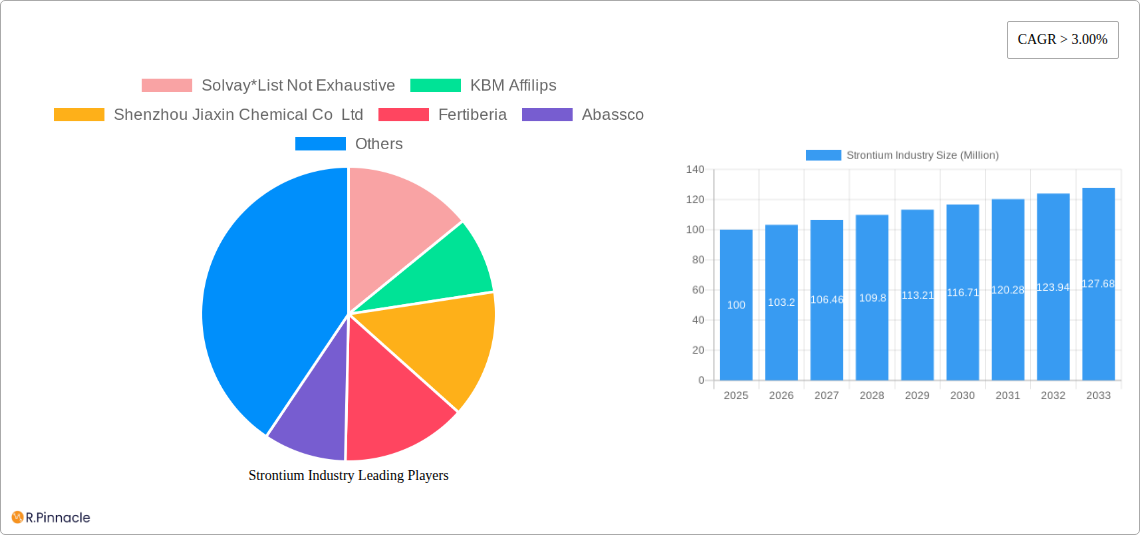
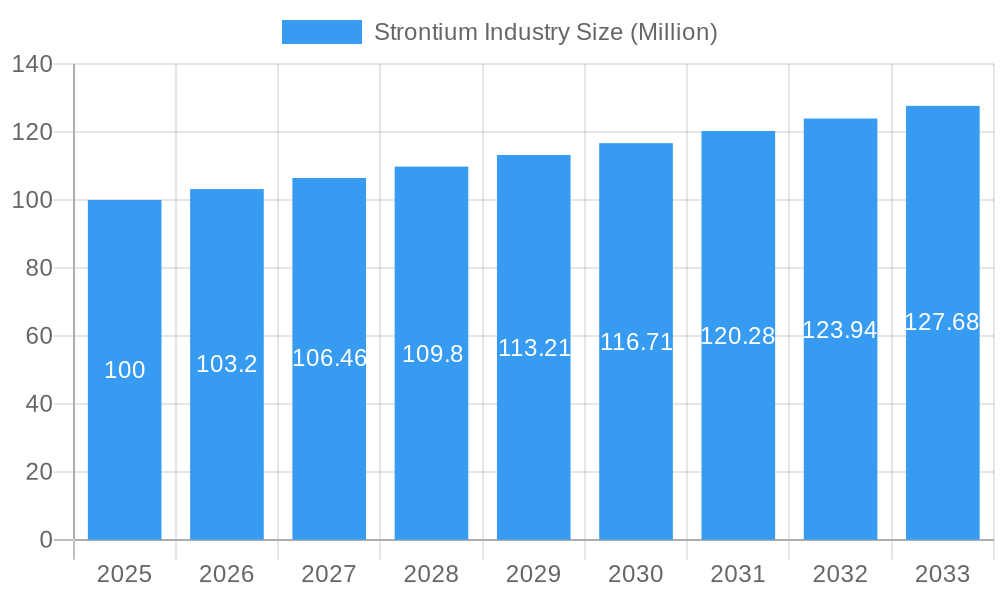
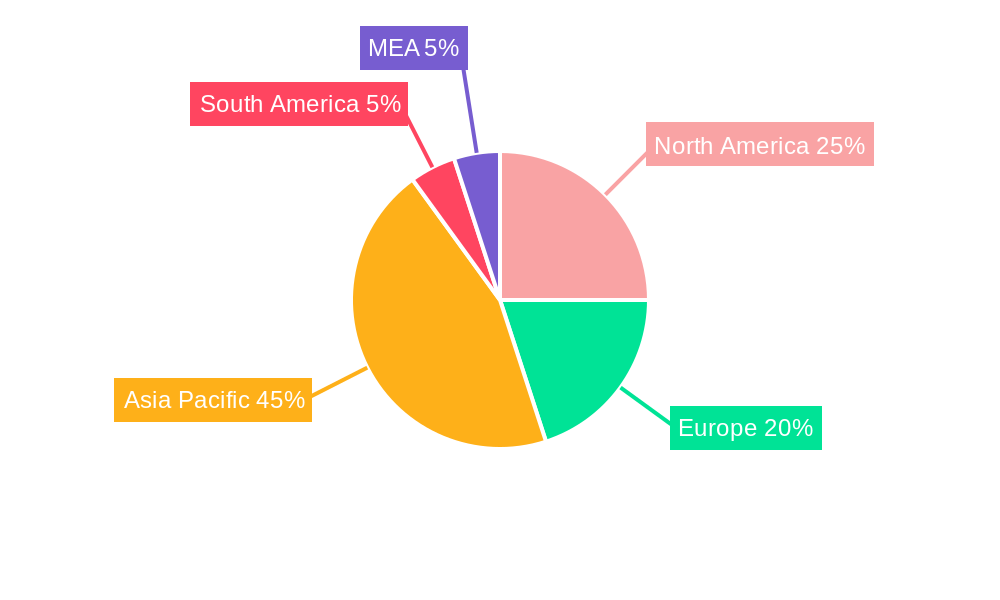
The global strontium market, currently valued at approximately $100 million in 2025, is projected to experience robust growth, exhibiting a Compound Annual Growth Rate (CAGR) exceeding 3.00% from 2025 to 2033. This expansion is driven by increasing demand across diverse applications. The electrical and electronics sector is a significant contributor, fueled by the use of strontium in electronic components and energy storage solutions. Growth in the medical and dental industries, leveraging strontium's properties in dental materials and medical imaging, further propels market expansion. The paints and coatings segment also contributes significantly, utilizing strontium compounds for enhanced properties like brightness and durability. While the personal care and pyrotechnic sectors represent smaller but growing segments, their combined contribution adds to the overall market dynamism. Furthermore, emerging applications in glass and ceramics are expected to further stimulate market growth in the forecast period. Key players like Solvay, KBM Affilips, and several Chinese manufacturers are actively shaping the market landscape through innovation and strategic expansion. Regional analysis suggests a significant market share held by Asia Pacific, driven primarily by China's robust manufacturing sector and its considerable demand for strontium compounds. North America and Europe also hold substantial shares, reflecting mature markets and established applications within these regions. However, the market faces certain restraints, including price fluctuations of raw materials and the potential for substitute materials in certain applications. Nevertheless, the overall outlook for the strontium market remains positive, with promising growth prospects fueled by technological advancements and increasing demand across various industrial sectors.
Strontium Industry Market Size (In Million)
The market segmentation by product (strontium carbonate, sulfate, nitrate, and others) reveals varying growth trajectories, primarily influenced by the specific properties of each compound and their suitability for different applications. The strontium carbonate segment currently holds a dominant position due to its widespread use across various applications. However, the strontium nitrate segment is projected to witness faster growth fueled by its application in pyrotechnics and other niche applications. Geographical diversification remains a key strategic imperative for market players. While Asia-Pacific is a primary focus due to its large market size, opportunities exist in developing regions as industrialization and infrastructure development accelerate demand for strontium-based materials. Therefore, companies are likely to focus on building strategic partnerships and expanding manufacturing capabilities in key regions to leverage these growth opportunities. The competitive landscape is marked by the presence of both established multinational players and regional manufacturers. Competition is primarily driven by pricing strategies, product innovation, and geographical reach.
Strontium Industry Company Market Share
Strontium Industry Market Report: 2019-2033 Forecast
This comprehensive report provides an in-depth analysis of the Strontium Industry, offering invaluable insights for industry professionals, investors, and strategic decision-makers. The study period covers 2019-2033, with a base year of 2025 and a forecast period of 2025-2033. The report leverages extensive data analysis to project a robust understanding of market dynamics, future trends, and key players. Expect detailed segmentation by product (Strontium Carbonate, Strontium Sulfate, Strontium Nitrate, Other Products) and application (Electrical and electronics, Medical and Dental, Paints and Coatings, Personal Care, Pyrotechnic, Other Applications), along with a comprehensive competitive landscape analysis. This report projects a xx Million market value by 2033.
Strontium Industry Market Structure & Innovation Trends
This section analyzes the Strontium market's competitive landscape, including market concentration, innovation drivers, regulatory influences, and M&A activity. We examine the market share held by key players like Solvay, KBM Affilips, Shenzhou Jiaxin Chemical Co Ltd, and others, revealing the level of market consolidation. The report further explores the role of innovation in driving market growth, analyzing technological advancements and their impact on product development and application expansion. Regulatory frameworks impacting the industry are detailed, along with discussions on product substitutes and their market penetration. Finally, an overview of significant M&A activities, including deal values (estimated at xx Million in total for the period), contributes to a complete understanding of the market's dynamic structure.
Strontium Industry Market Dynamics & Trends
This section delves into the key drivers and trends shaping the Strontium market. We analyze market growth drivers such as increasing demand from key applications, technological advancements leading to improved product performance, and evolving consumer preferences. A detailed analysis of technological disruptions, their impact on market dynamics, and the competitive landscape is presented. The compound annual growth rate (CAGR) for the forecast period (2025-2033) is projected to be xx%, with market penetration rates analyzed for each key application segment. This section provides a comprehensive overview of the market’s evolution, highlighting both opportunities and challenges.
Dominant Regions & Segments in Strontium Industry
This section identifies the leading regions and segments within the Strontium market. A detailed dominance analysis is presented for each key segment, including:
- By Product:
- Strontium Carbonate: Dominated by [Name of leading company/region], driven by [Key drivers – e.g., economic policies, infrastructure].
- Strontium Sulfate: Dominated by [Name of leading company/region], driven by [Key drivers – e.g., economic policies, infrastructure].
- Strontium Nitrate: Dominated by [Name of leading company/region], driven by [Key drivers – e.g., economic policies, infrastructure].
- Other Products (Strontium Hydroxide): Dominated by [Name of leading company/region], driven by [Key drivers – e.g., economic policies, infrastructure].
- By Application:
- Electrical and electronics: Dominated by [Name of leading company/region], driven by [Key drivers – e.g., economic policies, infrastructure].
- Medical and Dental: Dominated by [Name of leading company/region], driven by [Key drivers – e.g., economic policies, infrastructure].
- Paints and Coatings: Dominated by [Name of leading company/region], driven by [Key drivers – e.g., economic policies, infrastructure].
- Personal Care: Dominated by [Name of leading company/region], driven by [Key drivers – e.g., economic policies, infrastructure].
- Pyrotechnic: Dominated by [Name of leading company/region], driven by [Key drivers – e.g., economic policies, infrastructure].
- Other Applications (Glass and Ceramics): Dominated by [Name of leading company/region], driven by [Key drivers – e.g., economic policies, infrastructure].
The analysis considers factors like economic growth, infrastructure development, and government regulations in determining regional and segmental dominance.
Strontium Industry Product Innovations
Recent innovations in Strontium products focus on enhancing performance characteristics, expanding applications, and improving cost-effectiveness. Technological advancements, such as the development of novel synthesis methods and improved purification techniques, are driving product differentiation and competitive advantage. These innovations are crucial in meeting the evolving demands of various end-use industries, ensuring the Strontium market's continued growth.
Report Scope & Segmentation Analysis
This report provides a detailed segmentation of the Strontium market by product type and application. Each segment's market size, growth projections, and competitive dynamics are analyzed. The report encompasses the historical period (2019-2024), the base year (2025), and the forecast period (2025-2033). Growth projections are provided for each segment, highlighting areas of high potential and future market dynamics.
Key Drivers of Strontium Industry Growth
The Strontium industry's growth is propelled by several key factors. Rising demand from the electronics and pyrotechnics sectors is a significant driver. Technological advancements leading to improved product performance and efficiency also contribute. Favorable government policies and investments in infrastructure projects further stimulate market growth. The expansion of applications in emerging economies also presents significant opportunities.
Challenges in the Strontium Industry Sector
The Strontium industry faces several challenges. Fluctuations in raw material prices impact profitability. Stringent environmental regulations increase production costs. Intense competition among existing players necessitates continuous innovation and cost optimization. These factors can pose significant barriers to market entry and affect overall growth. The estimated impact of these challenges on market growth is projected to be a reduction in CAGR by xx% over the forecast period.
Emerging Opportunities in Strontium Industry
The Strontium industry is witnessing the emergence of several opportunities. Growth in the renewable energy sector is driving demand for Strontium-based products in energy storage systems. Advances in materials science are opening up new applications in various industries. Exploration of new markets in developing countries presents significant potential for expansion.
Leading Players in the Strontium Industry Market
- Solvay
- KBM Affilips
- Shenzhou Jiaxin Chemical Co Ltd
- Fertiberia
- Abassco
- Shijiazhuang Zhengding JINSHI Chemical Co Ltd
- Nanjing Jinyan Strontium Industry Co Ltd
- Joyieng Chemical Limited
- SAKAI CHEMICAL INDUSTRY CO LTD
- Hebei Xinji Chemical Group Co Ltd
- ProChem Inc
- Barium & Chemicals Inc
- Noah Chemicals
- Chongqing Yuanhe Fine Chemicals Inc
Key Developments in Strontium Industry
- October 2023: ProChem Inc. joined the Society of Chemical Manufacturers & Affiliates (SOCMA), enhancing its industry standing and access to resources. This strategic move is expected to positively impact ProChem's growth and competitiveness within the specialty chemicals sector.
Future Outlook for Strontium Industry Market
The Strontium industry is poised for continued growth, driven by technological advancements, expansion into new applications, and increasing demand from key sectors. Strategic partnerships and investments in research and development will further shape the market's future. The focus on sustainability and environmental responsibility will play a key role in shaping future industry practices and innovation.
Strontium Industry Segmentation
-
1. Product
- 1.1. Strontium Carbonate
- 1.2. Strontium Sulfate
- 1.3. Strontium Nitrate
- 1.4. Other Products (Strontium Hydroxide)
-
2. Application
- 2.1. Electrical and electronics
- 2.2. Medical and Dental
- 2.3. Paints and Coatings
- 2.4. Personal Care
- 2.5. Pyrotechnic
- 2.6. Other Applications (Glass and Ceramics)
Strontium Industry Segmentation By Geography
- 1. China
- 2. India
- 3. Japan
- 4. South Korea
- 5. Thailand
- 6. Malaysia
- 7. Indonesia
- 8. Vietnam
-
9. Rest of Asia Pacific
- 9.1. North America
- 10. United States
- 11. Canada
-
12. Mexico
- 12.1. Europe
- 13. Germany
- 14. United Kingdom
- 15. Italy
- 16. France
- 17. Spain
- 18. Turkey
- 19. Russia
- 20. NORDIC
-
21. Rest of Europe
- 21.1. South America
- 22. Brazil
- 23. Argentina
- 24. Colombia
-
25. Rest of South America
- 25.1. Middle East and Africa
- 26. Saudi Arabia
- 27. South Africa
- 28. Nigeria
- 29. Egypt
- 30. Qatar
- 31. United Arab Emirates
- 32. Rest of Middle East and Africa
Strontium Industry Regional Market Share
Geographic Coverage of Strontium Industry
Strontium Industry REPORT HIGHLIGHTS
| Aspects | Details |
|---|---|
| Study Period | 2020-2034 |
| Base Year | 2025 |
| Estimated Year | 2026 |
| Forecast Period | 2026-2034 |
| Historical Period | 2020-2025 |
| Growth Rate | CAGR of > 3.00% from 2020-2034 |
| Segmentation |
|
Table of Contents
- 1. Introduction
- 1.1. Research Scope
- 1.2. Market Segmentation
- 1.3. Research Objective
- 1.4. Definitions and Assumptions
- 2. Executive Summary
- 2.1. Market Snapshot
- 3. Market Dynamics
- 3.1. Market Drivers
- 3.2. Market Restrains
- 3.3. Market Trends
- 3.4. Market Opportunities
- 4. Market Factor Analysis
- 4.1. Porters Five Forces
- 4.1.1. Bargaining Power of Suppliers
- 4.1.2. Bargaining Power of Buyers
- 4.1.3. Threat of New Entrants
- 4.1.4. Threat of Substitutes
- 4.1.5. Competitive Rivalry
- 4.2. PESTEL analysis
- 4.3. BCG Analysis
- 4.3.1. Stars (High Growth, High Market Share)
- 4.3.2. Cash Cows (Low Growth, High Market Share)
- 4.3.3. Question Mark (High Growth, Low Market Share)
- 4.3.4. Dogs (Low Growth, Low Market Share)
- 4.4. Ansoff Matrix Analysis
- 4.5. Supply Chain Analysis
- 4.6. Regulatory Landscape
- 4.7. Current Market Potential and Opportunity Assessment (TAM–SAM–SOM Framework)
- 4.8. PRI Analyst Note
- 4.1. Porters Five Forces
- 5. Market Analysis, Insights and Forecast 2021-2033
- 5.1. Market Analysis, Insights and Forecast - by Product
- 5.1.1. Strontium Carbonate
- 5.1.2. Strontium Sulfate
- 5.1.3. Strontium Nitrate
- 5.1.4. Other Products (Strontium Hydroxide)
- 5.2. Market Analysis, Insights and Forecast - by Application
- 5.2.1. Electrical and electronics
- 5.2.2. Medical and Dental
- 5.2.3. Paints and Coatings
- 5.2.4. Personal Care
- 5.2.5. Pyrotechnic
- 5.2.6. Other Applications (Glass and Ceramics)
- 5.3. Market Analysis, Insights and Forecast - by Region
- 5.3.1. China
- 5.3.2. India
- 5.3.3. Japan
- 5.3.4. South Korea
- 5.3.5. Thailand
- 5.3.6. Malaysia
- 5.3.7. Indonesia
- 5.3.8. Vietnam
- 5.3.9. Rest of Asia Pacific
- 5.3.10. United States
- 5.3.11. Canada
- 5.3.12. Mexico
- 5.3.13. Germany
- 5.3.14. United Kingdom
- 5.3.15. Italy
- 5.3.16. France
- 5.3.17. Spain
- 5.3.18. Turkey
- 5.3.19. Russia
- 5.3.20. NORDIC
- 5.3.21. Rest of Europe
- 5.3.22. Brazil
- 5.3.23. Argentina
- 5.3.24. Colombia
- 5.3.25. Rest of South America
- 5.3.26. Saudi Arabia
- 5.3.27. South Africa
- 5.3.28. Nigeria
- 5.3.29. Egypt
- 5.3.30. Qatar
- 5.3.31. United Arab Emirates
- 5.3.32. Rest of Middle East and Africa
- 5.1. Market Analysis, Insights and Forecast - by Product
- 6. Global Strontium Industry Analysis, Insights and Forecast, 2021-2033
- 6.1. Market Analysis, Insights and Forecast - by Product
- 6.1.1. Strontium Carbonate
- 6.1.2. Strontium Sulfate
- 6.1.3. Strontium Nitrate
- 6.1.4. Other Products (Strontium Hydroxide)
- 6.2. Market Analysis, Insights and Forecast - by Application
- 6.2.1. Electrical and electronics
- 6.2.2. Medical and Dental
- 6.2.3. Paints and Coatings
- 6.2.4. Personal Care
- 6.2.5. Pyrotechnic
- 6.2.6. Other Applications (Glass and Ceramics)
- 6.1. Market Analysis, Insights and Forecast - by Product
- 7. China Strontium Industry Analysis, Insights and Forecast, 2020-2032
- 7.1. Market Analysis, Insights and Forecast - by Product
- 7.1.1. Strontium Carbonate
- 7.1.2. Strontium Sulfate
- 7.1.3. Strontium Nitrate
- 7.1.4. Other Products (Strontium Hydroxide)
- 7.2. Market Analysis, Insights and Forecast - by Application
- 7.2.1. Electrical and electronics
- 7.2.2. Medical and Dental
- 7.2.3. Paints and Coatings
- 7.2.4. Personal Care
- 7.2.5. Pyrotechnic
- 7.2.6. Other Applications (Glass and Ceramics)
- 7.1. Market Analysis, Insights and Forecast - by Product
- 8. India Strontium Industry Analysis, Insights and Forecast, 2020-2032
- 8.1. Market Analysis, Insights and Forecast - by Product
- 8.1.1. Strontium Carbonate
- 8.1.2. Strontium Sulfate
- 8.1.3. Strontium Nitrate
- 8.1.4. Other Products (Strontium Hydroxide)
- 8.2. Market Analysis, Insights and Forecast - by Application
- 8.2.1. Electrical and electronics
- 8.2.2. Medical and Dental
- 8.2.3. Paints and Coatings
- 8.2.4. Personal Care
- 8.2.5. Pyrotechnic
- 8.2.6. Other Applications (Glass and Ceramics)
- 8.1. Market Analysis, Insights and Forecast - by Product
- 9. Japan Strontium Industry Analysis, Insights and Forecast, 2020-2032
- 9.1. Market Analysis, Insights and Forecast - by Product
- 9.1.1. Strontium Carbonate
- 9.1.2. Strontium Sulfate
- 9.1.3. Strontium Nitrate
- 9.1.4. Other Products (Strontium Hydroxide)
- 9.2. Market Analysis, Insights and Forecast - by Application
- 9.2.1. Electrical and electronics
- 9.2.2. Medical and Dental
- 9.2.3. Paints and Coatings
- 9.2.4. Personal Care
- 9.2.5. Pyrotechnic
- 9.2.6. Other Applications (Glass and Ceramics)
- 9.1. Market Analysis, Insights and Forecast - by Product
- 10. South Korea Strontium Industry Analysis, Insights and Forecast, 2020-2032
- 10.1. Market Analysis, Insights and Forecast - by Product
- 10.1.1. Strontium Carbonate
- 10.1.2. Strontium Sulfate
- 10.1.3. Strontium Nitrate
- 10.1.4. Other Products (Strontium Hydroxide)
- 10.2. Market Analysis, Insights and Forecast - by Application
- 10.2.1. Electrical and electronics
- 10.2.2. Medical and Dental
- 10.2.3. Paints and Coatings
- 10.2.4. Personal Care
- 10.2.5. Pyrotechnic
- 10.2.6. Other Applications (Glass and Ceramics)
- 10.1. Market Analysis, Insights and Forecast - by Product
- 11. Thailand Strontium Industry Analysis, Insights and Forecast, 2020-2032
- 11.1. Market Analysis, Insights and Forecast - by Product
- 11.1.1. Strontium Carbonate
- 11.1.2. Strontium Sulfate
- 11.1.3. Strontium Nitrate
- 11.1.4. Other Products (Strontium Hydroxide)
- 11.2. Market Analysis, Insights and Forecast - by Application
- 11.2.1. Electrical and electronics
- 11.2.2. Medical and Dental
- 11.2.3. Paints and Coatings
- 11.2.4. Personal Care
- 11.2.5. Pyrotechnic
- 11.2.6. Other Applications (Glass and Ceramics)
- 11.1. Market Analysis, Insights and Forecast - by Product
- 12. Malaysia Strontium Industry Analysis, Insights and Forecast, 2020-2032
- 12.1. Market Analysis, Insights and Forecast - by Product
- 12.1.1. Strontium Carbonate
- 12.1.2. Strontium Sulfate
- 12.1.3. Strontium Nitrate
- 12.1.4. Other Products (Strontium Hydroxide)
- 12.2. Market Analysis, Insights and Forecast - by Application
- 12.2.1. Electrical and electronics
- 12.2.2. Medical and Dental
- 12.2.3. Paints and Coatings
- 12.2.4. Personal Care
- 12.2.5. Pyrotechnic
- 12.2.6. Other Applications (Glass and Ceramics)
- 12.1. Market Analysis, Insights and Forecast - by Product
- 13. Indonesia Strontium Industry Analysis, Insights and Forecast, 2020-2032
- 13.1. Market Analysis, Insights and Forecast - by Product
- 13.1.1. Strontium Carbonate
- 13.1.2. Strontium Sulfate
- 13.1.3. Strontium Nitrate
- 13.1.4. Other Products (Strontium Hydroxide)
- 13.2. Market Analysis, Insights and Forecast - by Application
- 13.2.1. Electrical and electronics
- 13.2.2. Medical and Dental
- 13.2.3. Paints and Coatings
- 13.2.4. Personal Care
- 13.2.5. Pyrotechnic
- 13.2.6. Other Applications (Glass and Ceramics)
- 13.1. Market Analysis, Insights and Forecast - by Product
- 14. Vietnam Strontium Industry Analysis, Insights and Forecast, 2020-2032
- 14.1. Market Analysis, Insights and Forecast - by Product
- 14.1.1. Strontium Carbonate
- 14.1.2. Strontium Sulfate
- 14.1.3. Strontium Nitrate
- 14.1.4. Other Products (Strontium Hydroxide)
- 14.2. Market Analysis, Insights and Forecast - by Application
- 14.2.1. Electrical and electronics
- 14.2.2. Medical and Dental
- 14.2.3. Paints and Coatings
- 14.2.4. Personal Care
- 14.2.5. Pyrotechnic
- 14.2.6. Other Applications (Glass and Ceramics)
- 14.1. Market Analysis, Insights and Forecast - by Product
- 15. Rest of Asia Pacific Strontium Industry Analysis, Insights and Forecast, 2020-2032
- 15.1. Market Analysis, Insights and Forecast - by Product
- 15.1.1. Strontium Carbonate
- 15.1.2. Strontium Sulfate
- 15.1.3. Strontium Nitrate
- 15.1.4. Other Products (Strontium Hydroxide)
- 15.2. Market Analysis, Insights and Forecast - by Application
- 15.2.1. Electrical and electronics
- 15.2.2. Medical and Dental
- 15.2.3. Paints and Coatings
- 15.2.4. Personal Care
- 15.2.5. Pyrotechnic
- 15.2.6. Other Applications (Glass and Ceramics)
- 15.1. Market Analysis, Insights and Forecast - by Product
- 16. United States Strontium Industry Analysis, Insights and Forecast, 2020-2032
- 16.1. Market Analysis, Insights and Forecast - by Product
- 16.1.1. Strontium Carbonate
- 16.1.2. Strontium Sulfate
- 16.1.3. Strontium Nitrate
- 16.1.4. Other Products (Strontium Hydroxide)
- 16.2. Market Analysis, Insights and Forecast - by Application
- 16.2.1. Electrical and electronics
- 16.2.2. Medical and Dental
- 16.2.3. Paints and Coatings
- 16.2.4. Personal Care
- 16.2.5. Pyrotechnic
- 16.2.6. Other Applications (Glass and Ceramics)
- 16.1. Market Analysis, Insights and Forecast - by Product
- 17. Canada Strontium Industry Analysis, Insights and Forecast, 2020-2032
- 17.1. Market Analysis, Insights and Forecast - by Product
- 17.1.1. Strontium Carbonate
- 17.1.2. Strontium Sulfate
- 17.1.3. Strontium Nitrate
- 17.1.4. Other Products (Strontium Hydroxide)
- 17.2. Market Analysis, Insights and Forecast - by Application
- 17.2.1. Electrical and electronics
- 17.2.2. Medical and Dental
- 17.2.3. Paints and Coatings
- 17.2.4. Personal Care
- 17.2.5. Pyrotechnic
- 17.2.6. Other Applications (Glass and Ceramics)
- 17.1. Market Analysis, Insights and Forecast - by Product
- 18. Mexico Strontium Industry Analysis, Insights and Forecast, 2020-2032
- 18.1. Market Analysis, Insights and Forecast - by Product
- 18.1.1. Strontium Carbonate
- 18.1.2. Strontium Sulfate
- 18.1.3. Strontium Nitrate
- 18.1.4. Other Products (Strontium Hydroxide)
- 18.2. Market Analysis, Insights and Forecast - by Application
- 18.2.1. Electrical and electronics
- 18.2.2. Medical and Dental
- 18.2.3. Paints and Coatings
- 18.2.4. Personal Care
- 18.2.5. Pyrotechnic
- 18.2.6. Other Applications (Glass and Ceramics)
- 18.1. Market Analysis, Insights and Forecast - by Product
- 19. Germany Strontium Industry Analysis, Insights and Forecast, 2020-2032
- 19.1. Market Analysis, Insights and Forecast - by Product
- 19.1.1. Strontium Carbonate
- 19.1.2. Strontium Sulfate
- 19.1.3. Strontium Nitrate
- 19.1.4. Other Products (Strontium Hydroxide)
- 19.2. Market Analysis, Insights and Forecast - by Application
- 19.2.1. Electrical and electronics
- 19.2.2. Medical and Dental
- 19.2.3. Paints and Coatings
- 19.2.4. Personal Care
- 19.2.5. Pyrotechnic
- 19.2.6. Other Applications (Glass and Ceramics)
- 19.1. Market Analysis, Insights and Forecast - by Product
- 20. United Kingdom Strontium Industry Analysis, Insights and Forecast, 2020-2032
- 20.1. Market Analysis, Insights and Forecast - by Product
- 20.1.1. Strontium Carbonate
- 20.1.2. Strontium Sulfate
- 20.1.3. Strontium Nitrate
- 20.1.4. Other Products (Strontium Hydroxide)
- 20.2. Market Analysis, Insights and Forecast - by Application
- 20.2.1. Electrical and electronics
- 20.2.2. Medical and Dental
- 20.2.3. Paints and Coatings
- 20.2.4. Personal Care
- 20.2.5. Pyrotechnic
- 20.2.6. Other Applications (Glass and Ceramics)
- 20.1. Market Analysis, Insights and Forecast - by Product
- 21. Italy Strontium Industry Analysis, Insights and Forecast, 2020-2032
- 21.1. Market Analysis, Insights and Forecast - by Product
- 21.1.1. Strontium Carbonate
- 21.1.2. Strontium Sulfate
- 21.1.3. Strontium Nitrate
- 21.1.4. Other Products (Strontium Hydroxide)
- 21.2. Market Analysis, Insights and Forecast - by Application
- 21.2.1. Electrical and electronics
- 21.2.2. Medical and Dental
- 21.2.3. Paints and Coatings
- 21.2.4. Personal Care
- 21.2.5. Pyrotechnic
- 21.2.6. Other Applications (Glass and Ceramics)
- 21.1. Market Analysis, Insights and Forecast - by Product
- 22. France Strontium Industry Analysis, Insights and Forecast, 2020-2032
- 22.1. Market Analysis, Insights and Forecast - by Product
- 22.1.1. Strontium Carbonate
- 22.1.2. Strontium Sulfate
- 22.1.3. Strontium Nitrate
- 22.1.4. Other Products (Strontium Hydroxide)
- 22.2. Market Analysis, Insights and Forecast - by Application
- 22.2.1. Electrical and electronics
- 22.2.2. Medical and Dental
- 22.2.3. Paints and Coatings
- 22.2.4. Personal Care
- 22.2.5. Pyrotechnic
- 22.2.6. Other Applications (Glass and Ceramics)
- 22.1. Market Analysis, Insights and Forecast - by Product
- 23. Spain Strontium Industry Analysis, Insights and Forecast, 2020-2032
- 23.1. Market Analysis, Insights and Forecast - by Product
- 23.1.1. Strontium Carbonate
- 23.1.2. Strontium Sulfate
- 23.1.3. Strontium Nitrate
- 23.1.4. Other Products (Strontium Hydroxide)
- 23.2. Market Analysis, Insights and Forecast - by Application
- 23.2.1. Electrical and electronics
- 23.2.2. Medical and Dental
- 23.2.3. Paints and Coatings
- 23.2.4. Personal Care
- 23.2.5. Pyrotechnic
- 23.2.6. Other Applications (Glass and Ceramics)
- 23.1. Market Analysis, Insights and Forecast - by Product
- 24. Turkey Strontium Industry Analysis, Insights and Forecast, 2020-2032
- 24.1. Market Analysis, Insights and Forecast - by Product
- 24.1.1. Strontium Carbonate
- 24.1.2. Strontium Sulfate
- 24.1.3. Strontium Nitrate
- 24.1.4. Other Products (Strontium Hydroxide)
- 24.2. Market Analysis, Insights and Forecast - by Application
- 24.2.1. Electrical and electronics
- 24.2.2. Medical and Dental
- 24.2.3. Paints and Coatings
- 24.2.4. Personal Care
- 24.2.5. Pyrotechnic
- 24.2.6. Other Applications (Glass and Ceramics)
- 24.1. Market Analysis, Insights and Forecast - by Product
- 25. Russia Strontium Industry Analysis, Insights and Forecast, 2020-2032
- 25.1. Market Analysis, Insights and Forecast - by Product
- 25.1.1. Strontium Carbonate
- 25.1.2. Strontium Sulfate
- 25.1.3. Strontium Nitrate
- 25.1.4. Other Products (Strontium Hydroxide)
- 25.2. Market Analysis, Insights and Forecast - by Application
- 25.2.1. Electrical and electronics
- 25.2.2. Medical and Dental
- 25.2.3. Paints and Coatings
- 25.2.4. Personal Care
- 25.2.5. Pyrotechnic
- 25.2.6. Other Applications (Glass and Ceramics)
- 25.1. Market Analysis, Insights and Forecast - by Product
- 26. NORDIC Strontium Industry Analysis, Insights and Forecast, 2020-2032
- 26.1. Market Analysis, Insights and Forecast - by Product
- 26.1.1. Strontium Carbonate
- 26.1.2. Strontium Sulfate
- 26.1.3. Strontium Nitrate
- 26.1.4. Other Products (Strontium Hydroxide)
- 26.2. Market Analysis, Insights and Forecast - by Application
- 26.2.1. Electrical and electronics
- 26.2.2. Medical and Dental
- 26.2.3. Paints and Coatings
- 26.2.4. Personal Care
- 26.2.5. Pyrotechnic
- 26.2.6. Other Applications (Glass and Ceramics)
- 26.1. Market Analysis, Insights and Forecast - by Product
- 27. Rest of Europe Strontium Industry Analysis, Insights and Forecast, 2020-2032
- 27.1. Market Analysis, Insights and Forecast - by Product
- 27.1.1. Strontium Carbonate
- 27.1.2. Strontium Sulfate
- 27.1.3. Strontium Nitrate
- 27.1.4. Other Products (Strontium Hydroxide)
- 27.2. Market Analysis, Insights and Forecast - by Application
- 27.2.1. Electrical and electronics
- 27.2.2. Medical and Dental
- 27.2.3. Paints and Coatings
- 27.2.4. Personal Care
- 27.2.5. Pyrotechnic
- 27.2.6. Other Applications (Glass and Ceramics)
- 27.1. Market Analysis, Insights and Forecast - by Product
- 28. Brazil Strontium Industry Analysis, Insights and Forecast, 2020-2032
- 28.1. Market Analysis, Insights and Forecast - by Product
- 28.1.1. Strontium Carbonate
- 28.1.2. Strontium Sulfate
- 28.1.3. Strontium Nitrate
- 28.1.4. Other Products (Strontium Hydroxide)
- 28.2. Market Analysis, Insights and Forecast - by Application
- 28.2.1. Electrical and electronics
- 28.2.2. Medical and Dental
- 28.2.3. Paints and Coatings
- 28.2.4. Personal Care
- 28.2.5. Pyrotechnic
- 28.2.6. Other Applications (Glass and Ceramics)
- 28.1. Market Analysis, Insights and Forecast - by Product
- 29. Argentina Strontium Industry Analysis, Insights and Forecast, 2020-2032
- 29.1. Market Analysis, Insights and Forecast - by Product
- 29.1.1. Strontium Carbonate
- 29.1.2. Strontium Sulfate
- 29.1.3. Strontium Nitrate
- 29.1.4. Other Products (Strontium Hydroxide)
- 29.2. Market Analysis, Insights and Forecast - by Application
- 29.2.1. Electrical and electronics
- 29.2.2. Medical and Dental
- 29.2.3. Paints and Coatings
- 29.2.4. Personal Care
- 29.2.5. Pyrotechnic
- 29.2.6. Other Applications (Glass and Ceramics)
- 29.1. Market Analysis, Insights and Forecast - by Product
- 30. Colombia Strontium Industry Analysis, Insights and Forecast, 2020-2032
- 30.1. Market Analysis, Insights and Forecast - by Product
- 30.1.1. Strontium Carbonate
- 30.1.2. Strontium Sulfate
- 30.1.3. Strontium Nitrate
- 30.1.4. Other Products (Strontium Hydroxide)
- 30.2. Market Analysis, Insights and Forecast - by Application
- 30.2.1. Electrical and electronics
- 30.2.2. Medical and Dental
- 30.2.3. Paints and Coatings
- 30.2.4. Personal Care
- 30.2.5. Pyrotechnic
- 30.2.6. Other Applications (Glass and Ceramics)
- 30.1. Market Analysis, Insights and Forecast - by Product
- 31. Rest of South America Strontium Industry Analysis, Insights and Forecast, 2020-2032
- 31.1. Market Analysis, Insights and Forecast - by Product
- 31.1.1. Strontium Carbonate
- 31.1.2. Strontium Sulfate
- 31.1.3. Strontium Nitrate
- 31.1.4. Other Products (Strontium Hydroxide)
- 31.2. Market Analysis, Insights and Forecast - by Application
- 31.2.1. Electrical and electronics
- 31.2.2. Medical and Dental
- 31.2.3. Paints and Coatings
- 31.2.4. Personal Care
- 31.2.5. Pyrotechnic
- 31.2.6. Other Applications (Glass and Ceramics)
- 31.1. Market Analysis, Insights and Forecast - by Product
- 32. Saudi Arabia Strontium Industry Analysis, Insights and Forecast, 2020-2032
- 32.1. Market Analysis, Insights and Forecast - by Product
- 32.1.1. Strontium Carbonate
- 32.1.2. Strontium Sulfate
- 32.1.3. Strontium Nitrate
- 32.1.4. Other Products (Strontium Hydroxide)
- 32.2. Market Analysis, Insights and Forecast - by Application
- 32.2.1. Electrical and electronics
- 32.2.2. Medical and Dental
- 32.2.3. Paints and Coatings
- 32.2.4. Personal Care
- 32.2.5. Pyrotechnic
- 32.2.6. Other Applications (Glass and Ceramics)
- 32.1. Market Analysis, Insights and Forecast - by Product
- 33. South Africa Strontium Industry Analysis, Insights and Forecast, 2020-2032
- 33.1. Market Analysis, Insights and Forecast - by Product
- 33.1.1. Strontium Carbonate
- 33.1.2. Strontium Sulfate
- 33.1.3. Strontium Nitrate
- 33.1.4. Other Products (Strontium Hydroxide)
- 33.2. Market Analysis, Insights and Forecast - by Application
- 33.2.1. Electrical and electronics
- 33.2.2. Medical and Dental
- 33.2.3. Paints and Coatings
- 33.2.4. Personal Care
- 33.2.5. Pyrotechnic
- 33.2.6. Other Applications (Glass and Ceramics)
- 33.1. Market Analysis, Insights and Forecast - by Product
- 34. Nigeria Strontium Industry Analysis, Insights and Forecast, 2020-2032
- 34.1. Market Analysis, Insights and Forecast - by Product
- 34.1.1. Strontium Carbonate
- 34.1.2. Strontium Sulfate
- 34.1.3. Strontium Nitrate
- 34.1.4. Other Products (Strontium Hydroxide)
- 34.2. Market Analysis, Insights and Forecast - by Application
- 34.2.1. Electrical and electronics
- 34.2.2. Medical and Dental
- 34.2.3. Paints and Coatings
- 34.2.4. Personal Care
- 34.2.5. Pyrotechnic
- 34.2.6. Other Applications (Glass and Ceramics)
- 34.1. Market Analysis, Insights and Forecast - by Product
- 35. Egypt Strontium Industry Analysis, Insights and Forecast, 2020-2032
- 35.1. Market Analysis, Insights and Forecast - by Product
- 35.1.1. Strontium Carbonate
- 35.1.2. Strontium Sulfate
- 35.1.3. Strontium Nitrate
- 35.1.4. Other Products (Strontium Hydroxide)
- 35.2. Market Analysis, Insights and Forecast - by Application
- 35.2.1. Electrical and electronics
- 35.2.2. Medical and Dental
- 35.2.3. Paints and Coatings
- 35.2.4. Personal Care
- 35.2.5. Pyrotechnic
- 35.2.6. Other Applications (Glass and Ceramics)
- 35.1. Market Analysis, Insights and Forecast - by Product
- 36. Qatar Strontium Industry Analysis, Insights and Forecast, 2020-2032
- 36.1. Market Analysis, Insights and Forecast - by Product
- 36.1.1. Strontium Carbonate
- 36.1.2. Strontium Sulfate
- 36.1.3. Strontium Nitrate
- 36.1.4. Other Products (Strontium Hydroxide)
- 36.2. Market Analysis, Insights and Forecast - by Application
- 36.2.1. Electrical and electronics
- 36.2.2. Medical and Dental
- 36.2.3. Paints and Coatings
- 36.2.4. Personal Care
- 36.2.5. Pyrotechnic
- 36.2.6. Other Applications (Glass and Ceramics)
- 36.1. Market Analysis, Insights and Forecast - by Product
- 37. United Arab Emirates Strontium Industry Analysis, Insights and Forecast, 2020-2032
- 37.1. Market Analysis, Insights and Forecast - by Product
- 37.1.1. Strontium Carbonate
- 37.1.2. Strontium Sulfate
- 37.1.3. Strontium Nitrate
- 37.1.4. Other Products (Strontium Hydroxide)
- 37.2. Market Analysis, Insights and Forecast - by Application
- 37.2.1. Electrical and electronics
- 37.2.2. Medical and Dental
- 37.2.3. Paints and Coatings
- 37.2.4. Personal Care
- 37.2.5. Pyrotechnic
- 37.2.6. Other Applications (Glass and Ceramics)
- 37.1. Market Analysis, Insights and Forecast - by Product
- 38. Rest of Middle East and Africa Strontium Industry Analysis, Insights and Forecast, 2020-2032
- 38.1. Market Analysis, Insights and Forecast - by Product
- 38.1.1. Strontium Carbonate
- 38.1.2. Strontium Sulfate
- 38.1.3. Strontium Nitrate
- 38.1.4. Other Products (Strontium Hydroxide)
- 38.2. Market Analysis, Insights and Forecast - by Application
- 38.2.1. Electrical and electronics
- 38.2.2. Medical and Dental
- 38.2.3. Paints and Coatings
- 38.2.4. Personal Care
- 38.2.5. Pyrotechnic
- 38.2.6. Other Applications (Glass and Ceramics)
- 38.1. Market Analysis, Insights and Forecast - by Product
- 39. Competitive Analysis
- 39.1. Company Profiles
- 39.1.1 Solvay*List Not Exhaustive
- 39.1.1.1. Company Overview
- 39.1.1.2. Products
- 39.1.1.3. Company Financials
- 39.1.1.4. SWOT Analysis
- 39.1.2 KBM Affilips
- 39.1.2.1. Company Overview
- 39.1.2.2. Products
- 39.1.2.3. Company Financials
- 39.1.2.4. SWOT Analysis
- 39.1.3 Shenzhou Jiaxin Chemical Co Ltd
- 39.1.3.1. Company Overview
- 39.1.3.2. Products
- 39.1.3.3. Company Financials
- 39.1.3.4. SWOT Analysis
- 39.1.4 Fertiberia
- 39.1.4.1. Company Overview
- 39.1.4.2. Products
- 39.1.4.3. Company Financials
- 39.1.4.4. SWOT Analysis
- 39.1.5 Abassco
- 39.1.5.1. Company Overview
- 39.1.5.2. Products
- 39.1.5.3. Company Financials
- 39.1.5.4. SWOT Analysis
- 39.1.6 Shijiazhuang Zhengding JINSHI Chemical Co Ltd
- 39.1.6.1. Company Overview
- 39.1.6.2. Products
- 39.1.6.3. Company Financials
- 39.1.6.4. SWOT Analysis
- 39.1.7 Nanjing Jinyan Strontium Industry Co Ltd
- 39.1.7.1. Company Overview
- 39.1.7.2. Products
- 39.1.7.3. Company Financials
- 39.1.7.4. SWOT Analysis
- 39.1.8 Joyieng Chemical Limited
- 39.1.8.1. Company Overview
- 39.1.8.2. Products
- 39.1.8.3. Company Financials
- 39.1.8.4. SWOT Analysis
- 39.1.9 SAKAI CHEMICAL INDUSTRY CO LTD
- 39.1.9.1. Company Overview
- 39.1.9.2. Products
- 39.1.9.3. Company Financials
- 39.1.9.4. SWOT Analysis
- 39.1.10 Hebei Xinji Chemical Group Co Ltd
- 39.1.10.1. Company Overview
- 39.1.10.2. Products
- 39.1.10.3. Company Financials
- 39.1.10.4. SWOT Analysis
- 39.1.11 ProChem Inc
- 39.1.11.1. Company Overview
- 39.1.11.2. Products
- 39.1.11.3. Company Financials
- 39.1.11.4. SWOT Analysis
- 39.1.12 Barium & Chemicals Inc
- 39.1.12.1. Company Overview
- 39.1.12.2. Products
- 39.1.12.3. Company Financials
- 39.1.12.4. SWOT Analysis
- 39.1.13 Noah Chemicals
- 39.1.13.1. Company Overview
- 39.1.13.2. Products
- 39.1.13.3. Company Financials
- 39.1.13.4. SWOT Analysis
- 39.1.14 Chongqing Yuanhe Fine Chemicals Inc
- 39.1.14.1. Company Overview
- 39.1.14.2. Products
- 39.1.14.3. Company Financials
- 39.1.14.4. SWOT Analysis
- 39.1.1 Solvay*List Not Exhaustive
- 39.2. Market Entropy
- 39.2.1 Company's Key Areas Served
- 39.2.2 Recent Developments
- 39.3. Company Market Share Analysis 2025
- 39.3.1 Top 5 Companies Market Share Analysis
- 39.3.2 Top 3 Companies Market Share Analysis
- 39.4. List of Potential Customers
- 40. Research Methodology
List of Figures
- Figure 1: Global Strontium Industry Revenue Breakdown (Million, %) by Region 2025 & 2033
- Figure 2: China Strontium Industry Revenue (Million), by Product 2025 & 2033
- Figure 3: China Strontium Industry Revenue Share (%), by Product 2025 & 2033
- Figure 4: China Strontium Industry Revenue (Million), by Application 2025 & 2033
- Figure 5: China Strontium Industry Revenue Share (%), by Application 2025 & 2033
- Figure 6: China Strontium Industry Revenue (Million), by Country 2025 & 2033
- Figure 7: China Strontium Industry Revenue Share (%), by Country 2025 & 2033
- Figure 8: India Strontium Industry Revenue (Million), by Product 2025 & 2033
- Figure 9: India Strontium Industry Revenue Share (%), by Product 2025 & 2033
- Figure 10: India Strontium Industry Revenue (Million), by Application 2025 & 2033
- Figure 11: India Strontium Industry Revenue Share (%), by Application 2025 & 2033
- Figure 12: India Strontium Industry Revenue (Million), by Country 2025 & 2033
- Figure 13: India Strontium Industry Revenue Share (%), by Country 2025 & 2033
- Figure 14: Japan Strontium Industry Revenue (Million), by Product 2025 & 2033
- Figure 15: Japan Strontium Industry Revenue Share (%), by Product 2025 & 2033
- Figure 16: Japan Strontium Industry Revenue (Million), by Application 2025 & 2033
- Figure 17: Japan Strontium Industry Revenue Share (%), by Application 2025 & 2033
- Figure 18: Japan Strontium Industry Revenue (Million), by Country 2025 & 2033
- Figure 19: Japan Strontium Industry Revenue Share (%), by Country 2025 & 2033
- Figure 20: South Korea Strontium Industry Revenue (Million), by Product 2025 & 2033
- Figure 21: South Korea Strontium Industry Revenue Share (%), by Product 2025 & 2033
- Figure 22: South Korea Strontium Industry Revenue (Million), by Application 2025 & 2033
- Figure 23: South Korea Strontium Industry Revenue Share (%), by Application 2025 & 2033
- Figure 24: South Korea Strontium Industry Revenue (Million), by Country 2025 & 2033
- Figure 25: South Korea Strontium Industry Revenue Share (%), by Country 2025 & 2033
- Figure 26: Thailand Strontium Industry Revenue (Million), by Product 2025 & 2033
- Figure 27: Thailand Strontium Industry Revenue Share (%), by Product 2025 & 2033
- Figure 28: Thailand Strontium Industry Revenue (Million), by Application 2025 & 2033
- Figure 29: Thailand Strontium Industry Revenue Share (%), by Application 2025 & 2033
- Figure 30: Thailand Strontium Industry Revenue (Million), by Country 2025 & 2033
- Figure 31: Thailand Strontium Industry Revenue Share (%), by Country 2025 & 2033
- Figure 32: Malaysia Strontium Industry Revenue (Million), by Product 2025 & 2033
- Figure 33: Malaysia Strontium Industry Revenue Share (%), by Product 2025 & 2033
- Figure 34: Malaysia Strontium Industry Revenue (Million), by Application 2025 & 2033
- Figure 35: Malaysia Strontium Industry Revenue Share (%), by Application 2025 & 2033
- Figure 36: Malaysia Strontium Industry Revenue (Million), by Country 2025 & 2033
- Figure 37: Malaysia Strontium Industry Revenue Share (%), by Country 2025 & 2033
- Figure 38: Indonesia Strontium Industry Revenue (Million), by Product 2025 & 2033
- Figure 39: Indonesia Strontium Industry Revenue Share (%), by Product 2025 & 2033
- Figure 40: Indonesia Strontium Industry Revenue (Million), by Application 2025 & 2033
- Figure 41: Indonesia Strontium Industry Revenue Share (%), by Application 2025 & 2033
- Figure 42: Indonesia Strontium Industry Revenue (Million), by Country 2025 & 2033
- Figure 43: Indonesia Strontium Industry Revenue Share (%), by Country 2025 & 2033
- Figure 44: Vietnam Strontium Industry Revenue (Million), by Product 2025 & 2033
- Figure 45: Vietnam Strontium Industry Revenue Share (%), by Product 2025 & 2033
- Figure 46: Vietnam Strontium Industry Revenue (Million), by Application 2025 & 2033
- Figure 47: Vietnam Strontium Industry Revenue Share (%), by Application 2025 & 2033
- Figure 48: Vietnam Strontium Industry Revenue (Million), by Country 2025 & 2033
- Figure 49: Vietnam Strontium Industry Revenue Share (%), by Country 2025 & 2033
- Figure 50: Rest of Asia Pacific Strontium Industry Revenue (Million), by Product 2025 & 2033
- Figure 51: Rest of Asia Pacific Strontium Industry Revenue Share (%), by Product 2025 & 2033
- Figure 52: Rest of Asia Pacific Strontium Industry Revenue (Million), by Application 2025 & 2033
- Figure 53: Rest of Asia Pacific Strontium Industry Revenue Share (%), by Application 2025 & 2033
- Figure 54: Rest of Asia Pacific Strontium Industry Revenue (Million), by Country 2025 & 2033
- Figure 55: Rest of Asia Pacific Strontium Industry Revenue Share (%), by Country 2025 & 2033
- Figure 56: United States Strontium Industry Revenue (Million), by Product 2025 & 2033
- Figure 57: United States Strontium Industry Revenue Share (%), by Product 2025 & 2033
- Figure 58: United States Strontium Industry Revenue (Million), by Application 2025 & 2033
- Figure 59: United States Strontium Industry Revenue Share (%), by Application 2025 & 2033
- Figure 60: United States Strontium Industry Revenue (Million), by Country 2025 & 2033
- Figure 61: United States Strontium Industry Revenue Share (%), by Country 2025 & 2033
- Figure 62: Canada Strontium Industry Revenue (Million), by Product 2025 & 2033
- Figure 63: Canada Strontium Industry Revenue Share (%), by Product 2025 & 2033
- Figure 64: Canada Strontium Industry Revenue (Million), by Application 2025 & 2033
- Figure 65: Canada Strontium Industry Revenue Share (%), by Application 2025 & 2033
- Figure 66: Canada Strontium Industry Revenue (Million), by Country 2025 & 2033
- Figure 67: Canada Strontium Industry Revenue Share (%), by Country 2025 & 2033
- Figure 68: Mexico Strontium Industry Revenue (Million), by Product 2025 & 2033
- Figure 69: Mexico Strontium Industry Revenue Share (%), by Product 2025 & 2033
- Figure 70: Mexico Strontium Industry Revenue (Million), by Application 2025 & 2033
- Figure 71: Mexico Strontium Industry Revenue Share (%), by Application 2025 & 2033
- Figure 72: Mexico Strontium Industry Revenue (Million), by Country 2025 & 2033
- Figure 73: Mexico Strontium Industry Revenue Share (%), by Country 2025 & 2033
- Figure 74: Germany Strontium Industry Revenue (Million), by Product 2025 & 2033
- Figure 75: Germany Strontium Industry Revenue Share (%), by Product 2025 & 2033
- Figure 76: Germany Strontium Industry Revenue (Million), by Application 2025 & 2033
- Figure 77: Germany Strontium Industry Revenue Share (%), by Application 2025 & 2033
- Figure 78: Germany Strontium Industry Revenue (Million), by Country 2025 & 2033
- Figure 79: Germany Strontium Industry Revenue Share (%), by Country 2025 & 2033
- Figure 80: United Kingdom Strontium Industry Revenue (Million), by Product 2025 & 2033
- Figure 81: United Kingdom Strontium Industry Revenue Share (%), by Product 2025 & 2033
- Figure 82: United Kingdom Strontium Industry Revenue (Million), by Application 2025 & 2033
- Figure 83: United Kingdom Strontium Industry Revenue Share (%), by Application 2025 & 2033
- Figure 84: United Kingdom Strontium Industry Revenue (Million), by Country 2025 & 2033
- Figure 85: United Kingdom Strontium Industry Revenue Share (%), by Country 2025 & 2033
- Figure 86: Italy Strontium Industry Revenue (Million), by Product 2025 & 2033
- Figure 87: Italy Strontium Industry Revenue Share (%), by Product 2025 & 2033
- Figure 88: Italy Strontium Industry Revenue (Million), by Application 2025 & 2033
- Figure 89: Italy Strontium Industry Revenue Share (%), by Application 2025 & 2033
- Figure 90: Italy Strontium Industry Revenue (Million), by Country 2025 & 2033
- Figure 91: Italy Strontium Industry Revenue Share (%), by Country 2025 & 2033
- Figure 92: France Strontium Industry Revenue (Million), by Product 2025 & 2033
- Figure 93: France Strontium Industry Revenue Share (%), by Product 2025 & 2033
- Figure 94: France Strontium Industry Revenue (Million), by Application 2025 & 2033
- Figure 95: France Strontium Industry Revenue Share (%), by Application 2025 & 2033
- Figure 96: France Strontium Industry Revenue (Million), by Country 2025 & 2033
- Figure 97: France Strontium Industry Revenue Share (%), by Country 2025 & 2033
- Figure 98: Spain Strontium Industry Revenue (Million), by Product 2025 & 2033
- Figure 99: Spain Strontium Industry Revenue Share (%), by Product 2025 & 2033
- Figure 100: Spain Strontium Industry Revenue (Million), by Application 2025 & 2033
- Figure 101: Spain Strontium Industry Revenue Share (%), by Application 2025 & 2033
- Figure 102: Spain Strontium Industry Revenue (Million), by Country 2025 & 2033
- Figure 103: Spain Strontium Industry Revenue Share (%), by Country 2025 & 2033
- Figure 104: Turkey Strontium Industry Revenue (Million), by Product 2025 & 2033
- Figure 105: Turkey Strontium Industry Revenue Share (%), by Product 2025 & 2033
- Figure 106: Turkey Strontium Industry Revenue (Million), by Application 2025 & 2033
- Figure 107: Turkey Strontium Industry Revenue Share (%), by Application 2025 & 2033
- Figure 108: Turkey Strontium Industry Revenue (Million), by Country 2025 & 2033
- Figure 109: Turkey Strontium Industry Revenue Share (%), by Country 2025 & 2033
- Figure 110: Russia Strontium Industry Revenue (Million), by Product 2025 & 2033
- Figure 111: Russia Strontium Industry Revenue Share (%), by Product 2025 & 2033
- Figure 112: Russia Strontium Industry Revenue (Million), by Application 2025 & 2033
- Figure 113: Russia Strontium Industry Revenue Share (%), by Application 2025 & 2033
- Figure 114: Russia Strontium Industry Revenue (Million), by Country 2025 & 2033
- Figure 115: Russia Strontium Industry Revenue Share (%), by Country 2025 & 2033
- Figure 116: NORDIC Strontium Industry Revenue (Million), by Product 2025 & 2033
- Figure 117: NORDIC Strontium Industry Revenue Share (%), by Product 2025 & 2033
- Figure 118: NORDIC Strontium Industry Revenue (Million), by Application 2025 & 2033
- Figure 119: NORDIC Strontium Industry Revenue Share (%), by Application 2025 & 2033
- Figure 120: NORDIC Strontium Industry Revenue (Million), by Country 2025 & 2033
- Figure 121: NORDIC Strontium Industry Revenue Share (%), by Country 2025 & 2033
- Figure 122: Rest of Europe Strontium Industry Revenue (Million), by Product 2025 & 2033
- Figure 123: Rest of Europe Strontium Industry Revenue Share (%), by Product 2025 & 2033
- Figure 124: Rest of Europe Strontium Industry Revenue (Million), by Application 2025 & 2033
- Figure 125: Rest of Europe Strontium Industry Revenue Share (%), by Application 2025 & 2033
- Figure 126: Rest of Europe Strontium Industry Revenue (Million), by Country 2025 & 2033
- Figure 127: Rest of Europe Strontium Industry Revenue Share (%), by Country 2025 & 2033
- Figure 128: Brazil Strontium Industry Revenue (Million), by Product 2025 & 2033
- Figure 129: Brazil Strontium Industry Revenue Share (%), by Product 2025 & 2033
- Figure 130: Brazil Strontium Industry Revenue (Million), by Application 2025 & 2033
- Figure 131: Brazil Strontium Industry Revenue Share (%), by Application 2025 & 2033
- Figure 132: Brazil Strontium Industry Revenue (Million), by Country 2025 & 2033
- Figure 133: Brazil Strontium Industry Revenue Share (%), by Country 2025 & 2033
- Figure 134: Argentina Strontium Industry Revenue (Million), by Product 2025 & 2033
- Figure 135: Argentina Strontium Industry Revenue Share (%), by Product 2025 & 2033
- Figure 136: Argentina Strontium Industry Revenue (Million), by Application 2025 & 2033
- Figure 137: Argentina Strontium Industry Revenue Share (%), by Application 2025 & 2033
- Figure 138: Argentina Strontium Industry Revenue (Million), by Country 2025 & 2033
- Figure 139: Argentina Strontium Industry Revenue Share (%), by Country 2025 & 2033
- Figure 140: Colombia Strontium Industry Revenue (Million), by Product 2025 & 2033
- Figure 141: Colombia Strontium Industry Revenue Share (%), by Product 2025 & 2033
- Figure 142: Colombia Strontium Industry Revenue (Million), by Application 2025 & 2033
- Figure 143: Colombia Strontium Industry Revenue Share (%), by Application 2025 & 2033
- Figure 144: Colombia Strontium Industry Revenue (Million), by Country 2025 & 2033
- Figure 145: Colombia Strontium Industry Revenue Share (%), by Country 2025 & 2033
- Figure 146: Rest of South America Strontium Industry Revenue (Million), by Product 2025 & 2033
- Figure 147: Rest of South America Strontium Industry Revenue Share (%), by Product 2025 & 2033
- Figure 148: Rest of South America Strontium Industry Revenue (Million), by Application 2025 & 2033
- Figure 149: Rest of South America Strontium Industry Revenue Share (%), by Application 2025 & 2033
- Figure 150: Rest of South America Strontium Industry Revenue (Million), by Country 2025 & 2033
- Figure 151: Rest of South America Strontium Industry Revenue Share (%), by Country 2025 & 2033
- Figure 152: Saudi Arabia Strontium Industry Revenue (Million), by Product 2025 & 2033
- Figure 153: Saudi Arabia Strontium Industry Revenue Share (%), by Product 2025 & 2033
- Figure 154: Saudi Arabia Strontium Industry Revenue (Million), by Application 2025 & 2033
- Figure 155: Saudi Arabia Strontium Industry Revenue Share (%), by Application 2025 & 2033
- Figure 156: Saudi Arabia Strontium Industry Revenue (Million), by Country 2025 & 2033
- Figure 157: Saudi Arabia Strontium Industry Revenue Share (%), by Country 2025 & 2033
- Figure 158: South Africa Strontium Industry Revenue (Million), by Product 2025 & 2033
- Figure 159: South Africa Strontium Industry Revenue Share (%), by Product 2025 & 2033
- Figure 160: South Africa Strontium Industry Revenue (Million), by Application 2025 & 2033
- Figure 161: South Africa Strontium Industry Revenue Share (%), by Application 2025 & 2033
- Figure 162: South Africa Strontium Industry Revenue (Million), by Country 2025 & 2033
- Figure 163: South Africa Strontium Industry Revenue Share (%), by Country 2025 & 2033
- Figure 164: Nigeria Strontium Industry Revenue (Million), by Product 2025 & 2033
- Figure 165: Nigeria Strontium Industry Revenue Share (%), by Product 2025 & 2033
- Figure 166: Nigeria Strontium Industry Revenue (Million), by Application 2025 & 2033
- Figure 167: Nigeria Strontium Industry Revenue Share (%), by Application 2025 & 2033
- Figure 168: Nigeria Strontium Industry Revenue (Million), by Country 2025 & 2033
- Figure 169: Nigeria Strontium Industry Revenue Share (%), by Country 2025 & 2033
- Figure 170: Egypt Strontium Industry Revenue (Million), by Product 2025 & 2033
- Figure 171: Egypt Strontium Industry Revenue Share (%), by Product 2025 & 2033
- Figure 172: Egypt Strontium Industry Revenue (Million), by Application 2025 & 2033
- Figure 173: Egypt Strontium Industry Revenue Share (%), by Application 2025 & 2033
- Figure 174: Egypt Strontium Industry Revenue (Million), by Country 2025 & 2033
- Figure 175: Egypt Strontium Industry Revenue Share (%), by Country 2025 & 2033
- Figure 176: Qatar Strontium Industry Revenue (Million), by Product 2025 & 2033
- Figure 177: Qatar Strontium Industry Revenue Share (%), by Product 2025 & 2033
- Figure 178: Qatar Strontium Industry Revenue (Million), by Application 2025 & 2033
- Figure 179: Qatar Strontium Industry Revenue Share (%), by Application 2025 & 2033
- Figure 180: Qatar Strontium Industry Revenue (Million), by Country 2025 & 2033
- Figure 181: Qatar Strontium Industry Revenue Share (%), by Country 2025 & 2033
- Figure 182: United Arab Emirates Strontium Industry Revenue (Million), by Product 2025 & 2033
- Figure 183: United Arab Emirates Strontium Industry Revenue Share (%), by Product 2025 & 2033
- Figure 184: United Arab Emirates Strontium Industry Revenue (Million), by Application 2025 & 2033
- Figure 185: United Arab Emirates Strontium Industry Revenue Share (%), by Application 2025 & 2033
- Figure 186: United Arab Emirates Strontium Industry Revenue (Million), by Country 2025 & 2033
- Figure 187: United Arab Emirates Strontium Industry Revenue Share (%), by Country 2025 & 2033
- Figure 188: Rest of Middle East and Africa Strontium Industry Revenue (Million), by Product 2025 & 2033
- Figure 189: Rest of Middle East and Africa Strontium Industry Revenue Share (%), by Product 2025 & 2033
- Figure 190: Rest of Middle East and Africa Strontium Industry Revenue (Million), by Application 2025 & 2033
- Figure 191: Rest of Middle East and Africa Strontium Industry Revenue Share (%), by Application 2025 & 2033
- Figure 192: Rest of Middle East and Africa Strontium Industry Revenue (Million), by Country 2025 & 2033
- Figure 193: Rest of Middle East and Africa Strontium Industry Revenue Share (%), by Country 2025 & 2033
List of Tables
- Table 1: Global Strontium Industry Revenue Million Forecast, by Product 2020 & 2033
- Table 2: Global Strontium Industry Revenue Million Forecast, by Application 2020 & 2033
- Table 3: Global Strontium Industry Revenue Million Forecast, by Region 2020 & 2033
- Table 4: Global Strontium Industry Revenue Million Forecast, by Product 2020 & 2033
- Table 5: Global Strontium Industry Revenue Million Forecast, by Application 2020 & 2033
- Table 6: Global Strontium Industry Revenue Million Forecast, by Country 2020 & 2033
- Table 7: Global Strontium Industry Revenue Million Forecast, by Product 2020 & 2033
- Table 8: Global Strontium Industry Revenue Million Forecast, by Application 2020 & 2033
- Table 9: Global Strontium Industry Revenue Million Forecast, by Country 2020 & 2033
- Table 10: Global Strontium Industry Revenue Million Forecast, by Product 2020 & 2033
- Table 11: Global Strontium Industry Revenue Million Forecast, by Application 2020 & 2033
- Table 12: Global Strontium Industry Revenue Million Forecast, by Country 2020 & 2033
- Table 13: Global Strontium Industry Revenue Million Forecast, by Product 2020 & 2033
- Table 14: Global Strontium Industry Revenue Million Forecast, by Application 2020 & 2033
- Table 15: Global Strontium Industry Revenue Million Forecast, by Country 2020 & 2033
- Table 16: Global Strontium Industry Revenue Million Forecast, by Product 2020 & 2033
- Table 17: Global Strontium Industry Revenue Million Forecast, by Application 2020 & 2033
- Table 18: Global Strontium Industry Revenue Million Forecast, by Country 2020 & 2033
- Table 19: Global Strontium Industry Revenue Million Forecast, by Product 2020 & 2033
- Table 20: Global Strontium Industry Revenue Million Forecast, by Application 2020 & 2033
- Table 21: Global Strontium Industry Revenue Million Forecast, by Country 2020 & 2033
- Table 22: Global Strontium Industry Revenue Million Forecast, by Product 2020 & 2033
- Table 23: Global Strontium Industry Revenue Million Forecast, by Application 2020 & 2033
- Table 24: Global Strontium Industry Revenue Million Forecast, by Country 2020 & 2033
- Table 25: Global Strontium Industry Revenue Million Forecast, by Product 2020 & 2033
- Table 26: Global Strontium Industry Revenue Million Forecast, by Application 2020 & 2033
- Table 27: Global Strontium Industry Revenue Million Forecast, by Country 2020 & 2033
- Table 28: Global Strontium Industry Revenue Million Forecast, by Product 2020 & 2033
- Table 29: Global Strontium Industry Revenue Million Forecast, by Application 2020 & 2033
- Table 30: Global Strontium Industry Revenue Million Forecast, by Country 2020 & 2033
- Table 31: North America Strontium Industry Revenue (Million) Forecast, by Application 2020 & 2033
- Table 32: Global Strontium Industry Revenue Million Forecast, by Product 2020 & 2033
- Table 33: Global Strontium Industry Revenue Million Forecast, by Application 2020 & 2033
- Table 34: Global Strontium Industry Revenue Million Forecast, by Country 2020 & 2033
- Table 35: Global Strontium Industry Revenue Million Forecast, by Product 2020 & 2033
- Table 36: Global Strontium Industry Revenue Million Forecast, by Application 2020 & 2033
- Table 37: Global Strontium Industry Revenue Million Forecast, by Country 2020 & 2033
- Table 38: Global Strontium Industry Revenue Million Forecast, by Product 2020 & 2033
- Table 39: Global Strontium Industry Revenue Million Forecast, by Application 2020 & 2033
- Table 40: Global Strontium Industry Revenue Million Forecast, by Country 2020 & 2033
- Table 41: Europe Strontium Industry Revenue (Million) Forecast, by Application 2020 & 2033
- Table 42: Global Strontium Industry Revenue Million Forecast, by Product 2020 & 2033
- Table 43: Global Strontium Industry Revenue Million Forecast, by Application 2020 & 2033
- Table 44: Global Strontium Industry Revenue Million Forecast, by Country 2020 & 2033
- Table 45: Global Strontium Industry Revenue Million Forecast, by Product 2020 & 2033
- Table 46: Global Strontium Industry Revenue Million Forecast, by Application 2020 & 2033
- Table 47: Global Strontium Industry Revenue Million Forecast, by Country 2020 & 2033
- Table 48: Global Strontium Industry Revenue Million Forecast, by Product 2020 & 2033
- Table 49: Global Strontium Industry Revenue Million Forecast, by Application 2020 & 2033
- Table 50: Global Strontium Industry Revenue Million Forecast, by Country 2020 & 2033
- Table 51: Global Strontium Industry Revenue Million Forecast, by Product 2020 & 2033
- Table 52: Global Strontium Industry Revenue Million Forecast, by Application 2020 & 2033
- Table 53: Global Strontium Industry Revenue Million Forecast, by Country 2020 & 2033
- Table 54: Global Strontium Industry Revenue Million Forecast, by Product 2020 & 2033
- Table 55: Global Strontium Industry Revenue Million Forecast, by Application 2020 & 2033
- Table 56: Global Strontium Industry Revenue Million Forecast, by Country 2020 & 2033
- Table 57: Global Strontium Industry Revenue Million Forecast, by Product 2020 & 2033
- Table 58: Global Strontium Industry Revenue Million Forecast, by Application 2020 & 2033
- Table 59: Global Strontium Industry Revenue Million Forecast, by Country 2020 & 2033
- Table 60: Global Strontium Industry Revenue Million Forecast, by Product 2020 & 2033
- Table 61: Global Strontium Industry Revenue Million Forecast, by Application 2020 & 2033
- Table 62: Global Strontium Industry Revenue Million Forecast, by Country 2020 & 2033
- Table 63: Global Strontium Industry Revenue Million Forecast, by Product 2020 & 2033
- Table 64: Global Strontium Industry Revenue Million Forecast, by Application 2020 & 2033
- Table 65: Global Strontium Industry Revenue Million Forecast, by Country 2020 & 2033
- Table 66: Global Strontium Industry Revenue Million Forecast, by Product 2020 & 2033
- Table 67: Global Strontium Industry Revenue Million Forecast, by Application 2020 & 2033
- Table 68: Global Strontium Industry Revenue Million Forecast, by Country 2020 & 2033
- Table 69: South America Strontium Industry Revenue (Million) Forecast, by Application 2020 & 2033
- Table 70: Global Strontium Industry Revenue Million Forecast, by Product 2020 & 2033
- Table 71: Global Strontium Industry Revenue Million Forecast, by Application 2020 & 2033
- Table 72: Global Strontium Industry Revenue Million Forecast, by Country 2020 & 2033
- Table 73: Global Strontium Industry Revenue Million Forecast, by Product 2020 & 2033
- Table 74: Global Strontium Industry Revenue Million Forecast, by Application 2020 & 2033
- Table 75: Global Strontium Industry Revenue Million Forecast, by Country 2020 & 2033
- Table 76: Global Strontium Industry Revenue Million Forecast, by Product 2020 & 2033
- Table 77: Global Strontium Industry Revenue Million Forecast, by Application 2020 & 2033
- Table 78: Global Strontium Industry Revenue Million Forecast, by Country 2020 & 2033
- Table 79: Global Strontium Industry Revenue Million Forecast, by Product 2020 & 2033
- Table 80: Global Strontium Industry Revenue Million Forecast, by Application 2020 & 2033
- Table 81: Global Strontium Industry Revenue Million Forecast, by Country 2020 & 2033
- Table 82: Middle East and Africa Strontium Industry Revenue (Million) Forecast, by Application 2020 & 2033
- Table 83: Global Strontium Industry Revenue Million Forecast, by Product 2020 & 2033
- Table 84: Global Strontium Industry Revenue Million Forecast, by Application 2020 & 2033
- Table 85: Global Strontium Industry Revenue Million Forecast, by Country 2020 & 2033
- Table 86: Global Strontium Industry Revenue Million Forecast, by Product 2020 & 2033
- Table 87: Global Strontium Industry Revenue Million Forecast, by Application 2020 & 2033
- Table 88: Global Strontium Industry Revenue Million Forecast, by Country 2020 & 2033
- Table 89: Global Strontium Industry Revenue Million Forecast, by Product 2020 & 2033
- Table 90: Global Strontium Industry Revenue Million Forecast, by Application 2020 & 2033
- Table 91: Global Strontium Industry Revenue Million Forecast, by Country 2020 & 2033
- Table 92: Global Strontium Industry Revenue Million Forecast, by Product 2020 & 2033
- Table 93: Global Strontium Industry Revenue Million Forecast, by Application 2020 & 2033
- Table 94: Global Strontium Industry Revenue Million Forecast, by Country 2020 & 2033
- Table 95: Global Strontium Industry Revenue Million Forecast, by Product 2020 & 2033
- Table 96: Global Strontium Industry Revenue Million Forecast, by Application 2020 & 2033
- Table 97: Global Strontium Industry Revenue Million Forecast, by Country 2020 & 2033
- Table 98: Global Strontium Industry Revenue Million Forecast, by Product 2020 & 2033
- Table 99: Global Strontium Industry Revenue Million Forecast, by Application 2020 & 2033
- Table 100: Global Strontium Industry Revenue Million Forecast, by Country 2020 & 2033
- Table 101: Global Strontium Industry Revenue Million Forecast, by Product 2020 & 2033
- Table 102: Global Strontium Industry Revenue Million Forecast, by Application 2020 & 2033
- Table 103: Global Strontium Industry Revenue Million Forecast, by Country 2020 & 2033
Frequently Asked Questions
1. What is the projected Compound Annual Growth Rate (CAGR) of the Strontium Industry?
The projected CAGR is approximately > 3.00%.
2. Which companies are prominent players in the Strontium Industry?
Key companies in the market include Solvay*List Not Exhaustive, KBM Affilips, Shenzhou Jiaxin Chemical Co Ltd, Fertiberia, Abassco, Shijiazhuang Zhengding JINSHI Chemical Co Ltd, Nanjing Jinyan Strontium Industry Co Ltd, Joyieng Chemical Limited, SAKAI CHEMICAL INDUSTRY CO LTD, Hebei Xinji Chemical Group Co Ltd, ProChem Inc, Barium & Chemicals Inc, Noah Chemicals, Chongqing Yuanhe Fine Chemicals Inc.
3. What are the main segments of the Strontium Industry?
The market segments include Product, Application.
4. Can you provide details about the market size?
The market size is estimated to be USD 100 Million as of 2022.
5. What are some drivers contributing to market growth?
Increased Demand from the Paints and Coatings Segment; Increasing Construction Activities in Emerging Economies of Asia-Pacific.
6. What are the notable trends driving market growth?
Paints and Coatings Segment to Dominate the Market.
7. Are there any restraints impacting market growth?
Risk of Explosion and Fire Hazards Associated with Strontium; Other Restraints.
8. Can you provide examples of recent developments in the market?
October 2023: ProChem joined the Society of Chemical Manufacturers & Affiliates (SOCMA). SOCMA is the only US-based trade association that is completely dedicated to the specialty and fine chemicals industry. SOCMA provides a legislative and regulatory advocate, promotes the highest level of safety, and strengthens business intelligence and production operations to support and stimulate growth in the specialty chemicals sector.
9. What pricing options are available for accessing the report?
Pricing options include single-user, multi-user, and enterprise licenses priced at USD 4750, USD 5250, and USD 8750 respectively.
10. Is the market size provided in terms of value or volume?
The market size is provided in terms of value, measured in Million.
11. Are there any specific market keywords associated with the report?
Yes, the market keyword associated with the report is "Strontium Industry," which aids in identifying and referencing the specific market segment covered.
12. How do I determine which pricing option suits my needs best?
The pricing options vary based on user requirements and access needs. Individual users may opt for single-user licenses, while businesses requiring broader access may choose multi-user or enterprise licenses for cost-effective access to the report.
13. Are there any additional resources or data provided in the Strontium Industry report?
While the report offers comprehensive insights, it's advisable to review the specific contents or supplementary materials provided to ascertain if additional resources or data are available.
14. How can I stay updated on further developments or reports in the Strontium Industry?
To stay informed about further developments, trends, and reports in the Strontium Industry, consider subscribing to industry newsletters, following relevant companies and organizations, or regularly checking reputable industry news sources and publications.
Methodology
Step 1 - Identification of Relevant Samples Size from Population Database


Step 2 - Approaches for Defining Global Market Size (Value, Volume* & Price*)

Note*: In applicable scenarios
Step 3 - Data Sources
Primary Research
- Web Analytics
- Survey Reports
- Research Institute
- Latest Research Reports
- Opinion Leaders
Secondary Research
- Annual Reports
- White Paper
- Latest Press Release
- Industry Association
- Paid Database
- Investor Presentations

Step 4 - Data Triangulation
Involves using different sources of information in order to increase the validity of a study
These sources are likely to be stakeholders in a program - participants, other researchers, program staff, other community members, and so on.
Then we put all data in single framework & apply various statistical tools to find out the dynamic on the market.
During the analysis stage, feedback from the stakeholder groups would be compared to determine areas of agreement as well as areas of divergence