

Key Insights
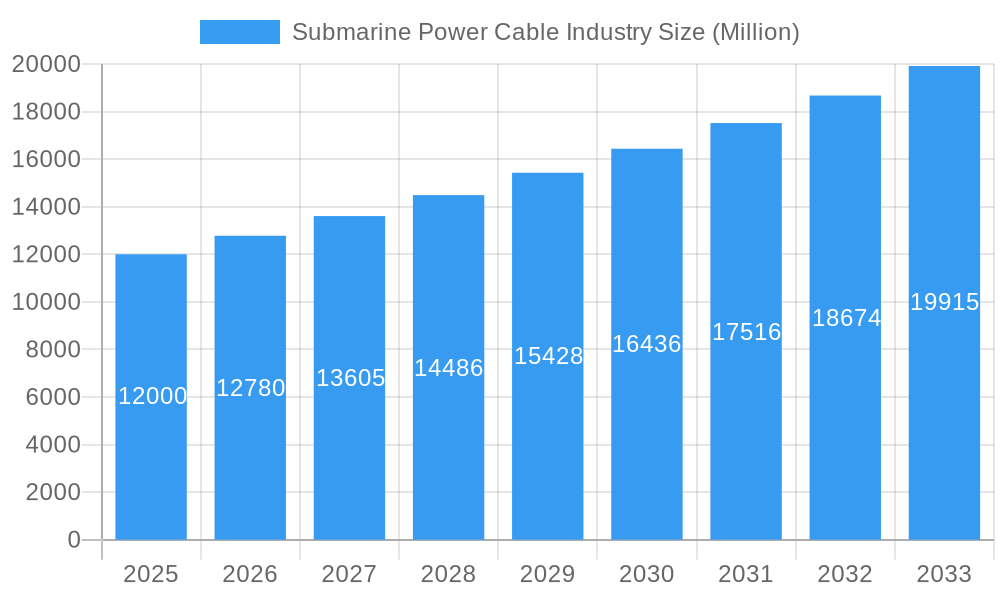
The global submarine power cable market is poised for significant expansion, driven by the escalating demand for renewable energy infrastructure, particularly offshore wind farms, and the critical need for enhanced continental electricity grid connectivity. The market is projected to achieve a Compound Annual Growth Rate (CAGR) of 5%, with an estimated market size of $33,761.6 million by the base year 2025. Key growth catalysts include the global transition to clean energy, necessitating efficient power transmission from remote renewable sources, coupled with the strategic interconnection of national grids for improved energy security and the burgeoning development of underwater data centers. The market is segmented by cable type, with High Voltage Direct Current (HVDC) cables increasingly favored over High Voltage Alternating Current (HVAC) for their superior efficiency in long-distance power transmission. Leading industry players such as ABB, Nexans, Prysmian Group, and Sumitomo Electric Industries are at the forefront, leveraging advanced technology and extensive global networks. Geographically, North America and Europe exhibit robust demand, while the Asia-Pacific region is anticipated to experience substantial growth due to considerable investments in renewable energy infrastructure and grid modernization initiatives.
Submarine Power Cable Industry Market Size (In Billion)
Technological innovations in cable manufacturing, enhancing performance and durability, are further stimulating market growth by reducing maintenance and operational expenditures, thereby improving the economic viability of submarine power cable solutions. The increasing scale and complexity of offshore wind projects, requiring higher voltage and capacity cables, represent a significant opportunity for market penetration. Supportive regulatory frameworks for renewable energy projects and grid modernization efforts are also contributing to a favorable market outlook. Potential challenges, including geopolitical instability impacting project timelines and investment, alongside the inherent complexities of underwater cable installation and maintenance in challenging marine environments, are acknowledged. Nevertheless, the unwavering global commitment to sustainable energy solutions and the continuous expansion of energy infrastructure underscore a sustained and robust growth trajectory for the submarine power cable industry.
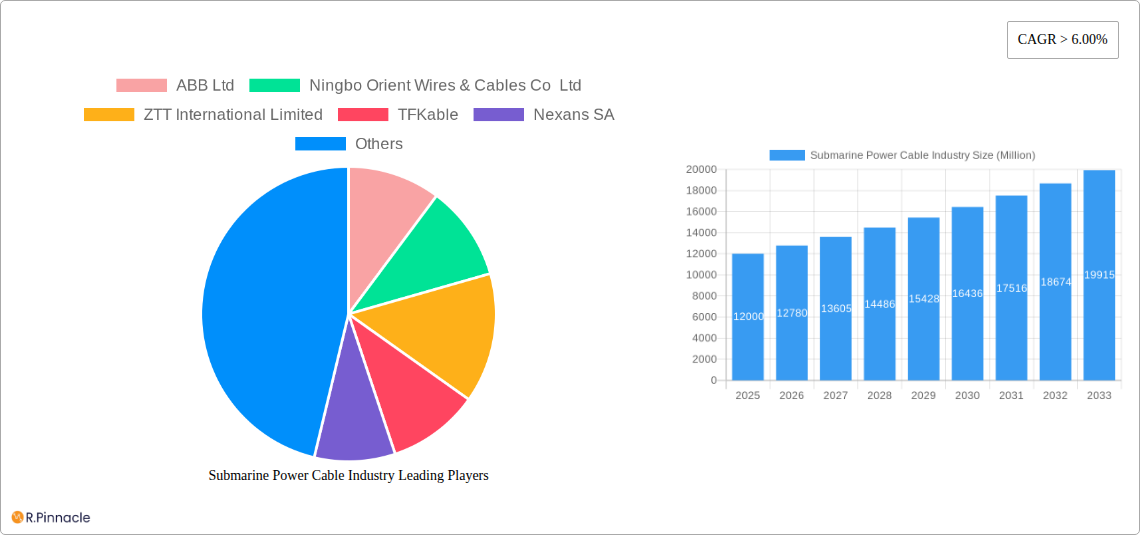
Submarine Power Cable Industry Company Market Share
Submarine Power Cable Industry: A Comprehensive Market Report (2019-2033)
This in-depth report provides a comprehensive analysis of the global submarine power cable industry, offering invaluable insights for industry professionals, investors, and strategic decision-makers. The study period covers 2019-2033, with a base year of 2025 and a forecast period of 2025-2033. The report leverages extensive market research and data analysis to provide a clear understanding of market dynamics, growth drivers, and future trends. The market is valued at xx Million in 2025 and is projected to reach xx Million by 2033, exhibiting a CAGR of xx% during the forecast period.
Submarine Power Cable Industry Market Structure & Innovation Trends
This section analyzes the competitive landscape of the submarine power cable industry, examining market concentration, innovation drivers, regulatory frameworks, and M&A activities. The market is moderately concentrated, with key players like ABB Ltd, Nexans SA, Prysmian Group, and Sumitomo Electric Industries Limited holding significant market share. However, several smaller, specialized players also contribute significantly, particularly in niche segments. Market share data for 2025 is estimated as follows: Prysmian Group (xx%), Nexans SA (xx%), ABB Ltd (xx%), Sumitomo Electric Industries Limited (xx%), with remaining share distributed across other players including NKT A/S, Furukawa Electric Co Ltd, and ZTT International Limited.
- Innovation Drivers: Increasing demand for renewable energy integration, advancements in HVDC technology, and the need for improved grid reliability are major drivers of innovation.
- Regulatory Frameworks: Stringent regulations regarding cable safety and environmental impact influence market dynamics.
- Product Substitutes: While limited, advancements in wireless power transmission technologies pose a potential long-term threat.
- M&A Activities: The acquisition of KT Submarine Co. by LS Cable & System Ltd. in November 2022, valued at xx Million, exemplifies the strategic investments in the industry. Further M&A activity is expected, driven by the need to expand geographic reach and technological capabilities. Total M&A deal value in 2024 was estimated to be xx Million.
- End-user demographics: Primarily large-scale power transmission projects, offshore wind farms, and interconnector projects driving demand.
Submarine Power Cable Industry Market Dynamics & Trends
This section delves into the key factors driving market growth, technological advancements, and competitive dynamics. The increasing global demand for electricity, particularly from renewable sources, is fueling the growth of the submarine power cable market. The need for efficient and reliable long-distance power transmission is a key factor driving the demand. Technological advancements in high-voltage direct current (HVDC) and high-voltage alternating current (HVAC) cables are improving efficiency and transmission capacity.
Market penetration of HVDC cables is expected to rise to xx% by 2033, owing to their capacity for longer distances and lower energy loss. Technological disruptions are anticipated in materials science and manufacturing processes leading to lighter and more efficient cables. Increased competition, primarily driven by manufacturers expanding their production capacities and global reach, contributes to price pressure and innovation.
Dominant Regions & Segments in Submarine Power Cable Industry
The Asia-Pacific region currently dominates the submarine power cable market, followed by Europe and North America. Key drivers include rapid economic growth, extensive infrastructure development, and a significant push towards renewable energy integration.
Asia-Pacific Dominance:
- Key Drivers: Robust economic growth in China, India, and Southeast Asia, leading to increased electricity demand.
- Infrastructure Development: Massive investments in power grid infrastructure, including offshore wind farms and interconnections.
- Government Policies: Supportive government policies promoting renewable energy adoption and grid modernization.
Segment Analysis:
- HVDC: This segment is experiencing faster growth compared to HVAC due to its suitability for long-distance power transmission and its application in offshore wind farms.
- HVAC: While mature, the HVAC segment continues to hold a substantial market share, driven by existing infrastructure and its cost-effectiveness for shorter distances. The HVAC segment is also benefiting from ongoing upgrades and modernization.
Submarine Power Cable Industry Product Innovations
Recent innovations focus on enhanced insulation materials, improved manufacturing processes for higher capacity, and lighter cable designs. These improvements are aimed at enhancing efficiency, reliability, and reducing installation costs. The development of more environmentally friendly materials is also gaining traction, addressing sustainability concerns. Advancements in monitoring and diagnostic technologies allow for improved operational efficiency and preventative maintenance.
Report Scope & Segmentation Analysis
This report segments the submarine power cable market by type of current (HVDC and HVAC). The HVDC segment is projected to witness faster growth driven by the increasing demand for long-distance power transmission. The HVAC segment, although mature, will continue to hold a substantial market share due to its application in existing infrastructure and cost-effectiveness for shorter distances. Both segments are experiencing technological innovations impacting efficiency and capacity. Competitive dynamics within each segment vary, with major players strategically positioning themselves based on technology and geographic focus.
Key Drivers of Submarine Power Cable Industry Growth
Several factors drive the growth of the submarine power cable industry: rising global energy demand, the expanding renewable energy sector (particularly offshore wind), the need for interconnecting national grids, and ongoing investments in infrastructure development. Government regulations promoting renewable energy and grid modernization further stimulate market expansion. Technological advancements in cable design, such as improved insulation materials and increased capacity, also fuel growth.
Challenges in the Submarine Power Cable Industry Sector
The submarine power cable industry faces challenges including high installation costs, complex logistical operations, environmental concerns, and potential damage from external factors such as ship anchors or natural disasters. The industry is also subject to fluctuating raw material prices and geopolitical uncertainties impacting supply chains. Moreover, intense competition among established players and emerging manufacturers creates price pressure.
Emerging Opportunities in Submarine Power Cable Industry
Growing demand for offshore wind energy, increasing interconnections between countries, and the expansion of underwater data centers create significant opportunities. Innovations in cable materials and manufacturing processes, enabling more efficient and sustainable solutions, offer further market expansion potential. Development of advanced monitoring and control systems contributes to improving operational efficiency and grid management.
Leading Players in the Submarine Power Cable Industry Market
- ABB Ltd
- Ningbo Orient Wires & Cables Co Ltd
- ZTT International Limited
- TFKable
- Nexans SA
- Furukawa Electric Co Ltd
- NKT A/S
- Prysmian Group
- Sumitomo Electric Industries Limited
- KEI Industries Limited
- LS Cable & System Ltd
Key Developments in Submarine Power Cable Industry Industry
- November 2022: LS Cable & System Ltd. becomes the largest shareholder of KT Submarine Co., strengthening its position in the submarine cable market.
Future Outlook for Submarine Power Cable Industry Market
The future of the submarine power cable industry looks promising, driven by sustained growth in renewable energy, particularly offshore wind, and the increasing need for efficient long-distance power transmission. Technological advancements will continue to drive efficiency gains and cost reductions. Strategic partnerships and acquisitions will shape the industry landscape, while ongoing investments in infrastructure projects and grid modernization will ensure sustained demand.
Submarine Power Cable Industry Segmentation
-
1. Type of Current
- 1.1. HVDC
- 1.2. HVAC
Submarine Power Cable Industry Segmentation By Geography
- 1. North America
- 2. Europe
- 3. Asia Pacific
- 4. South America
- 5. Middle East and Africa
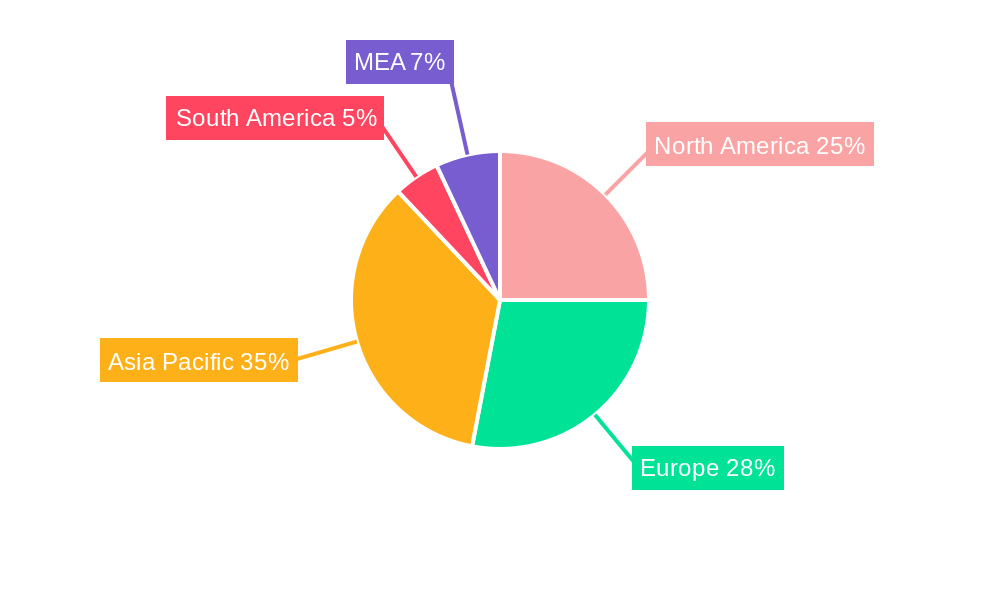
Submarine Power Cable Industry Regional Market Share
Geographic Coverage of Submarine Power Cable Industry
Submarine Power Cable Industry REPORT HIGHLIGHTS
| Aspects | Details |
|---|---|
| Study Period | 2020-2034 |
| Base Year | 2025 |
| Estimated Year | 2026 |
| Forecast Period | 2026-2034 |
| Historical Period | 2020-2025 |
| Growth Rate | CAGR of 5% from 2020-2034 |
| Segmentation |
|
Table of Contents
- 1. Introduction
- 1.1. Research Scope
- 1.2. Market Segmentation
- 1.3. Research Objective
- 1.4. Definitions and Assumptions
- 2. Executive Summary
- 2.1. Market Snapshot
- 3. Market Dynamics
- 3.1. Market Drivers
- 3.2. Market Restrains
- 3.3. Market Trends
- 3.4. Market Opportunities
- 4. Market Factor Analysis
- 4.1. Porters Five Forces
- 4.1.1. Bargaining Power of Suppliers
- 4.1.2. Bargaining Power of Buyers
- 4.1.3. Threat of New Entrants
- 4.1.4. Threat of Substitutes
- 4.1.5. Competitive Rivalry
- 4.2. PESTEL analysis
- 4.3. BCG Analysis
- 4.3.1. Stars (High Growth, High Market Share)
- 4.3.2. Cash Cows (Low Growth, High Market Share)
- 4.3.3. Question Mark (High Growth, Low Market Share)
- 4.3.4. Dogs (Low Growth, Low Market Share)
- 4.4. Ansoff Matrix Analysis
- 4.5. Supply Chain Analysis
- 4.6. Regulatory Landscape
- 4.7. Current Market Potential and Opportunity Assessment (TAM–SAM–SOM Framework)
- 4.8. PRI Analyst Note
- 4.1. Porters Five Forces
- 5. Market Analysis, Insights and Forecast 2021-2033
- 5.1. Market Analysis, Insights and Forecast - by Type of Current
- 5.1.1. HVDC
- 5.1.2. HVAC
- 5.2. Market Analysis, Insights and Forecast - by Region
- 5.2.1. North America
- 5.2.2. Europe
- 5.2.3. Asia Pacific
- 5.2.4. South America
- 5.2.5. Middle East and Africa
- 5.1. Market Analysis, Insights and Forecast - by Type of Current
- 6. Global Submarine Power Cable Industry Analysis, Insights and Forecast, 2021-2033
- 6.1. Market Analysis, Insights and Forecast - by Type of Current
- 6.1.1. HVDC
- 6.1.2. HVAC
- 6.1. Market Analysis, Insights and Forecast - by Type of Current
- 7. North America Submarine Power Cable Industry Analysis, Insights and Forecast, 2020-2032
- 7.1. Market Analysis, Insights and Forecast - by Type of Current
- 7.1.1. HVDC
- 7.1.2. HVAC
- 7.1. Market Analysis, Insights and Forecast - by Type of Current
- 8. Europe Submarine Power Cable Industry Analysis, Insights and Forecast, 2020-2032
- 8.1. Market Analysis, Insights and Forecast - by Type of Current
- 8.1.1. HVDC
- 8.1.2. HVAC
- 8.1. Market Analysis, Insights and Forecast - by Type of Current
- 9. Asia Pacific Submarine Power Cable Industry Analysis, Insights and Forecast, 2020-2032
- 9.1. Market Analysis, Insights and Forecast - by Type of Current
- 9.1.1. HVDC
- 9.1.2. HVAC
- 9.1. Market Analysis, Insights and Forecast - by Type of Current
- 10. South America Submarine Power Cable Industry Analysis, Insights and Forecast, 2020-2032
- 10.1. Market Analysis, Insights and Forecast - by Type of Current
- 10.1.1. HVDC
- 10.1.2. HVAC
- 10.1. Market Analysis, Insights and Forecast - by Type of Current
- 11. Middle East and Africa Submarine Power Cable Industry Analysis, Insights and Forecast, 2020-2032
- 11.1. Market Analysis, Insights and Forecast - by Type of Current
- 11.1.1. HVDC
- 11.1.2. HVAC
- 11.1. Market Analysis, Insights and Forecast - by Type of Current
- 12. Competitive Analysis
- 12.1. Company Profiles
- 12.1.1 ABB Ltd
- 12.1.1.1. Company Overview
- 12.1.1.2. Products
- 12.1.1.3. Company Financials
- 12.1.1.4. SWOT Analysis
- 12.1.2 Ningbo Orient Wires & Cables Co Ltd
- 12.1.2.1. Company Overview
- 12.1.2.2. Products
- 12.1.2.3. Company Financials
- 12.1.2.4. SWOT Analysis
- 12.1.3 ZTT International Limited
- 12.1.3.1. Company Overview
- 12.1.3.2. Products
- 12.1.3.3. Company Financials
- 12.1.3.4. SWOT Analysis
- 12.1.4 TFKable
- 12.1.4.1. Company Overview
- 12.1.4.2. Products
- 12.1.4.3. Company Financials
- 12.1.4.4. SWOT Analysis
- 12.1.5 Nexans SA
- 12.1.5.1. Company Overview
- 12.1.5.2. Products
- 12.1.5.3. Company Financials
- 12.1.5.4. SWOT Analysis
- 12.1.6 Furukawa Electric Co Ltd
- 12.1.6.1. Company Overview
- 12.1.6.2. Products
- 12.1.6.3. Company Financials
- 12.1.6.4. SWOT Analysis
- 12.1.7 NKT A/S
- 12.1.7.1. Company Overview
- 12.1.7.2. Products
- 12.1.7.3. Company Financials
- 12.1.7.4. SWOT Analysis
- 12.1.8 Prysmian Group
- 12.1.8.1. Company Overview
- 12.1.8.2. Products
- 12.1.8.3. Company Financials
- 12.1.8.4. SWOT Analysis
- 12.1.9 Sumitomo Electric Industries Limited
- 12.1.9.1. Company Overview
- 12.1.9.2. Products
- 12.1.9.3. Company Financials
- 12.1.9.4. SWOT Analysis
- 12.1.10 KEI Industries Limited
- 12.1.10.1. Company Overview
- 12.1.10.2. Products
- 12.1.10.3. Company Financials
- 12.1.10.4. SWOT Analysis
- 12.1.11 LS Cable & System Ltd
- 12.1.11.1. Company Overview
- 12.1.11.2. Products
- 12.1.11.3. Company Financials
- 12.1.11.4. SWOT Analysis
- 12.1.1 ABB Ltd
- 12.2. Market Entropy
- 12.2.1 Company's Key Areas Served
- 12.2.2 Recent Developments
- 12.3. Company Market Share Analysis 2025
- 12.3.1 Top 5 Companies Market Share Analysis
- 12.3.2 Top 3 Companies Market Share Analysis
- 12.4. List of Potential Customers
- 13. Research Methodology
List of Figures
- Figure 1: Global Submarine Power Cable Industry Revenue Breakdown (million, %) by Region 2025 & 2033
- Figure 2: North America Submarine Power Cable Industry Revenue (million), by Type of Current 2025 & 2033
- Figure 3: North America Submarine Power Cable Industry Revenue Share (%), by Type of Current 2025 & 2033
- Figure 4: North America Submarine Power Cable Industry Revenue (million), by Country 2025 & 2033
- Figure 5: North America Submarine Power Cable Industry Revenue Share (%), by Country 2025 & 2033
- Figure 6: Europe Submarine Power Cable Industry Revenue (million), by Type of Current 2025 & 2033
- Figure 7: Europe Submarine Power Cable Industry Revenue Share (%), by Type of Current 2025 & 2033
- Figure 8: Europe Submarine Power Cable Industry Revenue (million), by Country 2025 & 2033
- Figure 9: Europe Submarine Power Cable Industry Revenue Share (%), by Country 2025 & 2033
- Figure 10: Asia Pacific Submarine Power Cable Industry Revenue (million), by Type of Current 2025 & 2033
- Figure 11: Asia Pacific Submarine Power Cable Industry Revenue Share (%), by Type of Current 2025 & 2033
- Figure 12: Asia Pacific Submarine Power Cable Industry Revenue (million), by Country 2025 & 2033
- Figure 13: Asia Pacific Submarine Power Cable Industry Revenue Share (%), by Country 2025 & 2033
- Figure 14: South America Submarine Power Cable Industry Revenue (million), by Type of Current 2025 & 2033
- Figure 15: South America Submarine Power Cable Industry Revenue Share (%), by Type of Current 2025 & 2033
- Figure 16: South America Submarine Power Cable Industry Revenue (million), by Country 2025 & 2033
- Figure 17: South America Submarine Power Cable Industry Revenue Share (%), by Country 2025 & 2033
- Figure 18: Middle East and Africa Submarine Power Cable Industry Revenue (million), by Type of Current 2025 & 2033
- Figure 19: Middle East and Africa Submarine Power Cable Industry Revenue Share (%), by Type of Current 2025 & 2033
- Figure 20: Middle East and Africa Submarine Power Cable Industry Revenue (million), by Country 2025 & 2033
- Figure 21: Middle East and Africa Submarine Power Cable Industry Revenue Share (%), by Country 2025 & 2033
List of Tables
- Table 1: Global Submarine Power Cable Industry Revenue million Forecast, by Type of Current 2020 & 2033
- Table 2: Global Submarine Power Cable Industry Revenue million Forecast, by Region 2020 & 2033
- Table 3: Global Submarine Power Cable Industry Revenue million Forecast, by Type of Current 2020 & 2033
- Table 4: Global Submarine Power Cable Industry Revenue million Forecast, by Country 2020 & 2033
- Table 5: Global Submarine Power Cable Industry Revenue million Forecast, by Type of Current 2020 & 2033
- Table 6: Global Submarine Power Cable Industry Revenue million Forecast, by Country 2020 & 2033
- Table 7: Global Submarine Power Cable Industry Revenue million Forecast, by Type of Current 2020 & 2033
- Table 8: Global Submarine Power Cable Industry Revenue million Forecast, by Country 2020 & 2033
- Table 9: Global Submarine Power Cable Industry Revenue million Forecast, by Type of Current 2020 & 2033
- Table 10: Global Submarine Power Cable Industry Revenue million Forecast, by Country 2020 & 2033
- Table 11: Global Submarine Power Cable Industry Revenue million Forecast, by Type of Current 2020 & 2033
- Table 12: Global Submarine Power Cable Industry Revenue million Forecast, by Country 2020 & 2033
Frequently Asked Questions
1. What is the projected Compound Annual Growth Rate (CAGR) of the Submarine Power Cable Industry?
The projected CAGR is approximately 5%.
2. Which companies are prominent players in the Submarine Power Cable Industry?
Key companies in the market include ABB Ltd, Ningbo Orient Wires & Cables Co Ltd, ZTT International Limited, TFKable, Nexans SA, Furukawa Electric Co Ltd, NKT A/S, Prysmian Group, Sumitomo Electric Industries Limited, KEI Industries Limited, LS Cable & System Ltd.
3. What are the main segments of the Submarine Power Cable Industry?
The market segments include Type of Current.
4. Can you provide details about the market size?
The market size is estimated to be USD 33761.6 million as of 2022.
5. What are some drivers contributing to market growth?
HVDC submarine cables are increasingly preferred for long-distance power transmission due to their efficiency and lower energy losses compared to alternating current (AC) systems. The adoption of HVDC technology is a significant driver in the submarine power cable market..
6. What are the notable trends driving market growth?
There is a notable trend towards integrating renewable energy sources. such as offshore wind and solar power. into existing power grids. Submarine power cables play a crucial role in this integration by connecting remote renewable energy sites to onshore grids.
7. Are there any restraints impacting market growth?
The deployment and maintenance of submarine power cables involve substantial financial investments. The complex installation procedures. specialized equipment requirements. and the need for expert personnel contribute to these high costs..
8. Can you provide examples of recent developments in the market?
In November 2022, South Korea's leading cable manufacturer, LS Cable & System Ltd., became the largest shareholder of KT Submarine Co., a company specializing in undersea cable construction. This strategic investment aimed to strengthen LS Cable's position in the submarine cable market and expand its capabilities in undersea cable projects.
9. What pricing options are available for accessing the report?
Pricing options include single-user, multi-user, and enterprise licenses priced at USD 4750, USD 5250, and USD 8750 respectively.
10. Is the market size provided in terms of value or volume?
The market size is provided in terms of value, measured in million.
11. Are there any specific market keywords associated with the report?
Yes, the market keyword associated with the report is "Submarine Power Cable Industry," which aids in identifying and referencing the specific market segment covered.
12. How do I determine which pricing option suits my needs best?
The pricing options vary based on user requirements and access needs. Individual users may opt for single-user licenses, while businesses requiring broader access may choose multi-user or enterprise licenses for cost-effective access to the report.
13. Are there any additional resources or data provided in the Submarine Power Cable Industry report?
While the report offers comprehensive insights, it's advisable to review the specific contents or supplementary materials provided to ascertain if additional resources or data are available.
14. How can I stay updated on further developments or reports in the Submarine Power Cable Industry?
To stay informed about further developments, trends, and reports in the Submarine Power Cable Industry, consider subscribing to industry newsletters, following relevant companies and organizations, or regularly checking reputable industry news sources and publications.
Methodology
Step 1 - Identification of Relevant Samples Size from Population Database


Step 2 - Approaches for Defining Global Market Size (Value, Volume* & Price*)

Note*: In applicable scenarios
Step 3 - Data Sources
Primary Research
- Web Analytics
- Survey Reports
- Research Institute
- Latest Research Reports
- Opinion Leaders
Secondary Research
- Annual Reports
- White Paper
- Latest Press Release
- Industry Association
- Paid Database
- Investor Presentations

Step 4 - Data Triangulation
Involves using different sources of information in order to increase the validity of a study
These sources are likely to be stakeholders in a program - participants, other researchers, program staff, other community members, and so on.
Then we put all data in single framework & apply various statistical tools to find out the dynamic on the market.
During the analysis stage, feedback from the stakeholder groups would be compared to determine areas of agreement as well as areas of divergence