

Key Insights
The global substation market is poised for significant expansion, currently valued at an estimated USD 139.23 billion. This robust growth is driven by an anticipated Compound Annual Growth Rate (CAGR) of 4.50% from 2019 to 2033, underscoring the increasing demand for reliable and efficient electrical infrastructure. Key drivers fueling this upward trajectory include the accelerating global demand for electricity, necessitated by rapid industrialization and urbanization across emerging economies. Furthermore, substantial investments in upgrading aging grid networks to enhance stability, improve power quality, and integrate renewable energy sources are critical catalysts. The proliferation of smart grid technologies, aimed at optimizing energy distribution and reducing transmission losses, also plays a pivotal role in shaping market dynamics. The market is segmented across various voltage levels, with High, Medium, and Low voltage substations catering to diverse energy distribution needs. Applications span across Power Utilities, Commercial & Industrial sectors, and "Other Applications" which likely encompass specialized industrial needs and distributed generation projects.
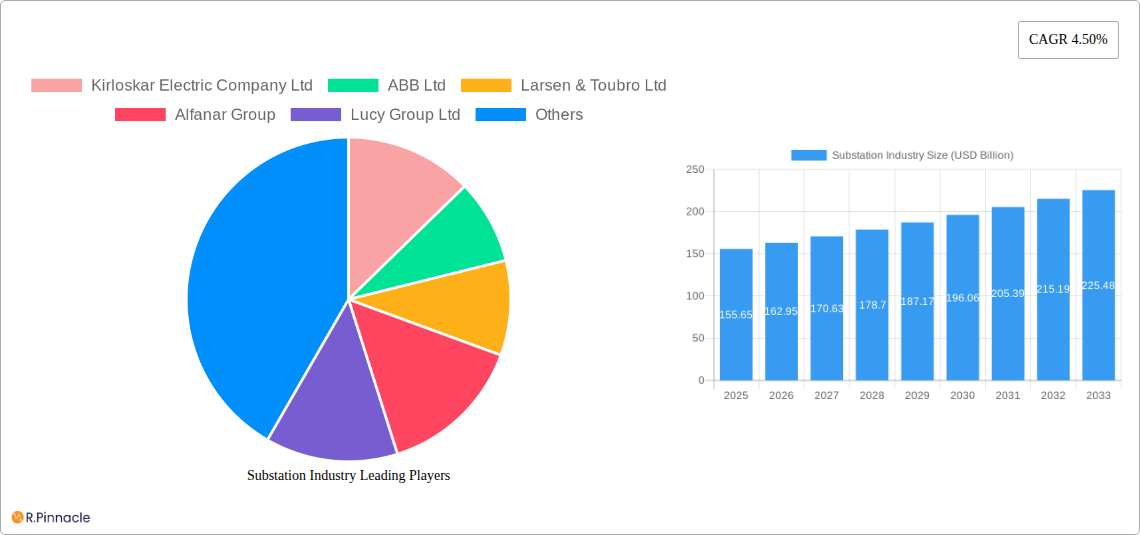
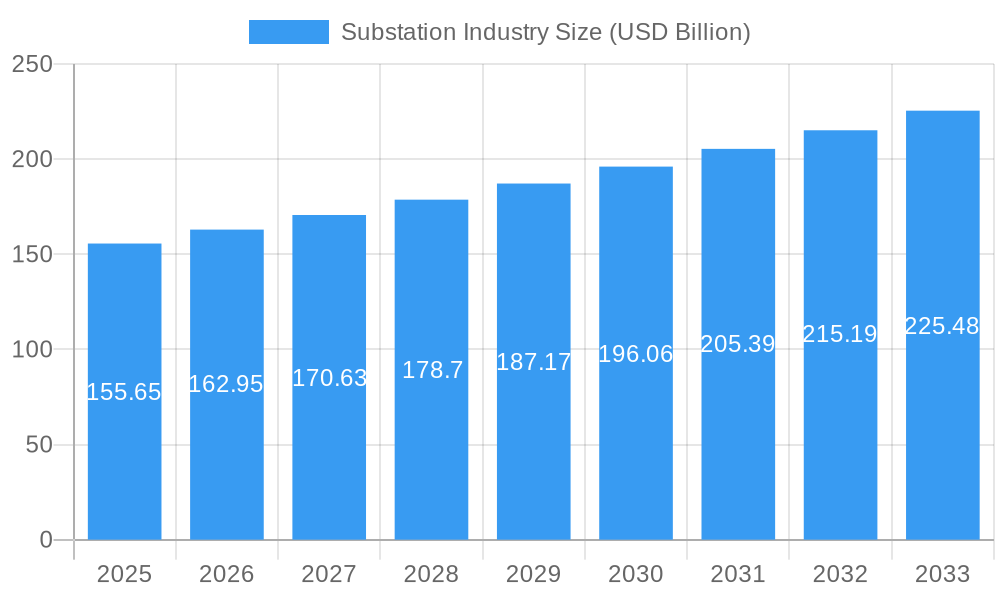
Substation Industry Market Size (In Million)
The substation industry's growth trajectory is further bolstered by ongoing technological advancements and a concerted global effort towards decarbonization. Trends such as the increasing adoption of digital substations, featuring advanced automation, monitoring, and control systems, are enhancing operational efficiency and predictive maintenance capabilities. The integration of renewable energy sources like solar and wind, which often require sophisticated grid management and interconnection, is a major trend. Conversely, restraints such as the high initial capital investment required for substation construction and modernization, coupled with complex regulatory frameworks in certain regions, could pose challenges. Geopolitical factors and supply chain disruptions can also impact project timelines and costs. Leading companies like Siemens AG, ABB Ltd, and General Electric Company are at the forefront of innovation, offering a wide array of solutions across different voltage segments and applications, and are actively shaping the future of the global substation landscape.
Substation Industry Company Market Share
Substation Industry Market Research Report 2019-2033
This comprehensive Substation Industry market research report provides an in-depth analysis of the global substation market, offering critical insights for stakeholders navigating this dynamic sector. Covering a study period from 2019 to 2033, with a base year of 2025, this report leverages historical data and expert forecasting to deliver actionable intelligence.
Substation Industry Market Structure & Innovation Trends
The global substation industry exhibits a moderately concentrated market structure, with key players like Siemens AG, ABB Ltd, and General Electric Company holding significant market shares. Innovation is primarily driven by the increasing demand for grid modernization, enhanced reliability, and the integration of renewable energy sources. Regulatory frameworks, particularly those promoting smart grids and cybersecurity, play a pivotal role in shaping product development and market entry strategies. While product substitutes are limited due to the specialized nature of substations, advancements in modular and prefabricated designs are emerging. End-user demographics are largely dominated by power utilities, followed by commercial and industrial sectors requiring robust power distribution. Mergers and acquisitions (M&A) activity has been observed, with strategic consolidations aimed at expanding geographical reach and technological capabilities, contributing to an estimated M&A deal value of USD 5.8 Billion in 2024.
Substation Industry Market Dynamics & Trends
The global substation market is poised for robust growth, driven by a confluence of factors including escalating electricity demand, the urgent need for grid modernization and expansion, and the imperative to integrate renewable energy sources. Technological disruptions, such as the advent of digital substations, smart grid technologies, and advanced automation solutions, are fundamentally reshaping market dynamics. These innovations are not only enhancing operational efficiency and reliability but also paving the way for new service revenue streams. Consumer preferences are increasingly leaning towards sustainable and resilient energy infrastructure, pushing utilities and industrial players to invest in state-of-the-art substation equipment. Competitive dynamics are intensifying, with established giants and agile innovators vying for market share. The market penetration of advanced substation technologies is on an upward trajectory, supported by government policies and a growing awareness of the economic and environmental benefits of modernized power infrastructure. The Compound Annual Growth Rate (CAGR) for the substation industry is projected to be approximately 6.2% from 2025 to 2033. Investments in digitalization, including AI-powered analytics for predictive maintenance and remote monitoring, are becoming standard. The ongoing transition towards decentralized energy systems and the electrification of transportation further underscore the critical role of substations in the future energy landscape. Strategic partnerships are becoming more prevalent, fostering collaboration between technology providers and utilities to co-develop bespoke solutions that address specific grid challenges. The pursuit of greater energy efficiency and reduced carbon footprints will continue to fuel demand for innovative substation designs and components.
Dominant Regions & Segments in Substation Industry
The North America region is currently the dominant force in the global substation industry, primarily driven by substantial government initiatives aimed at grid modernization and infrastructure upgrades, coupled with significant investments in renewable energy projects. Within this region, the United States leads due to its vast geographical expanse and a mature power utility sector that continuously seeks to enhance grid resilience and efficiency. The High Voltage segment, catering to the transmission of electricity over long distances, is the largest by market value, accounting for approximately 45% of the total market in 2025. Key drivers for its dominance include the need to connect remote renewable energy generation sites to load centers and the continuous expansion of national power grids.
- Key Drivers for North America's Dominance:
- Robust government funding for grid modernization and smart grid deployment.
- High per capita electricity consumption driving demand for robust transmission and distribution infrastructure.
- Significant investments in renewable energy, particularly solar and wind, necessitating new substation capacity.
- Favorable economic policies and a mature industrial base supporting large-scale infrastructure projects.
The Power Utilities application segment is overwhelmingly dominant, representing over 60% of the total market. This is due to the fundamental role substations play in the generation, transmission, and distribution of electricity by utility companies.
- Key Drivers for Power Utilities Dominance:
- The inherent need for substations in every stage of the electricity supply chain.
- Aging infrastructure requiring upgrades and replacements to meet modern standards.
- The integration of smart grid technologies for improved monitoring, control, and outage management.
- Increasing demand for reliable and stable power supply to residential, commercial, and industrial consumers.
The Medium Voltage segment is also a significant contributor, serving as a crucial link between high-voltage transmission networks and low-voltage distribution systems for industrial and commercial consumers.
- Key Drivers for Medium Voltage Dominance:
- Supports the power needs of a wide range of commercial and industrial facilities.
- Essential for distributing power within large campuses, factories, and urban areas.
- Technological advancements in medium-voltage switchgear and transformers are enhancing efficiency and reducing footprint.
Substation Industry Product Innovations
Product innovations in the substation industry are centered on digitalization, automation, and enhanced sustainability. The development of smart grid-enabled substations featuring advanced digital communication, remote monitoring, and predictive maintenance capabilities is transforming operational efficiency. Compact and modular substation designs are gaining traction, offering flexibility and reduced footprint. Furthermore, increased focus on eco-friendly materials and components is driving the adoption of substations with lower environmental impact, providing a competitive advantage in an increasingly green-conscious market.
Report Scope & Segmentation Analysis
This report segments the substation industry by voltage, application, and geographical region. The Voltage segmentation includes High, Medium, and Low voltage substations. High Voltage substations, projected to reach USD 18.5 Billion by 2025, are crucial for long-distance power transmission. Medium Voltage substations, estimated at USD 13.2 Billion in 2025, serve industrial and commercial distribution. Low Voltage substations, at an estimated USD 7.1 Billion in 2025, are vital for final distribution to end-users. The Application segmentation encompasses Power Utilities, Commercial & Industrial, and Other Applications. Power Utilities represent the largest segment with projected revenues of USD 25.9 Billion in 2025, followed by Commercial & Industrial at USD 10.1 Billion in 2025.
Key Drivers of Substation Industry Growth
The substation industry's growth is propelled by several key factors. The relentless global demand for electricity, fueled by population growth and economic development, necessitates continuous expansion and upgrading of power infrastructure. The imperative for grid modernization, driven by the need for increased reliability, resilience, and efficiency, is a significant growth catalyst. Furthermore, the accelerating integration of renewable energy sources, such as solar and wind power, which often require new or upgraded substation facilities to connect to the grid, is a major driver. Government initiatives and supportive policies aimed at promoting grid modernization, smart grid deployment, and the decarbonization of the energy sector are also playing a crucial role in fostering market expansion.
Challenges in the Substation Industry Sector
Despite strong growth prospects, the substation industry faces several challenges. The substantial upfront capital investment required for substation construction and upgrades can be a barrier, particularly for developing economies. Stringent regulatory compliance and lengthy approval processes can lead to project delays and increased costs. Supply chain disruptions and the volatility of raw material prices, such as copper and steel, can impact project timelines and profitability. Additionally, the increasing complexity of integrating new technologies, including cybersecurity threats associated with digital substations, requires specialized expertise and robust mitigation strategies. Competition from established players and emerging manufacturers also presents pricing pressures and demands continuous innovation.
Emerging Opportunities in Substation Industry
Emerging opportunities within the substation industry are primarily linked to the global energy transition and technological advancements. The rapidly expanding renewable energy sector offers significant opportunities for substation development to facilitate the integration of distributed generation. The growing focus on electric vehicle (EV) charging infrastructure necessitates the development of robust and scalable substations to support the increased demand. Digitalization and automation present opportunities for providing advanced services, such as predictive maintenance, remote monitoring, and data analytics, creating new revenue streams. The modernization of aging infrastructure in developed countries and the development of new grids in emerging economies also present substantial growth avenues.
Leading Players in the Substation Industry Market
- Siemens AG
- ABB Ltd
- General Electric Company
- Schneider Electric SE
- Eaton Corporation PLC
- Larsen & Toubro Ltd
- Kirloskar Electric Company Ltd
- Alfanar Group
- Lucy Group Ltd
- C&S Electric Limited
Key Developments in Substation Industry Industry
- 2024: Strategic partnerships between utilities and technology providers are increasing, focusing on co-developing solutions for grid modernization and renewable integration.
- 2023: Significant investments in research and development for advanced substation technologies, including AI-powered analytics and next-generation switchgear, are underway by major players.
- 2023: Government initiatives to promote grid modernization and sustainability are gaining momentum globally, with increased funding allocated for smart grid projects and renewable energy infrastructure.
- 2023: M&A activity and consolidation in the industry are observed, with companies acquiring smaller players to expand technological capabilities and market reach.
- 2022: Increased focus on digitalization and automation is leading to the development and deployment of digital substations, enhancing operational efficiency and data management.
Future Outlook for Substation Industry Market
The future outlook for the substation industry is highly promising, driven by the global imperative for a sustainable, reliable, and efficient energy future. The continued expansion of renewable energy sources, the electrification of transportation, and the increasing demand for electricity will necessitate significant investment in substation infrastructure. The ongoing digital transformation and the adoption of smart grid technologies will lead to more intelligent, resilient, and cost-effective substations. Emerging markets, with their growing energy needs, represent substantial growth potential. Strategic collaborations, continuous innovation in modular and sustainable designs, and a focus on cybersecurity will be crucial for companies to capitalize on these evolving opportunities and secure their position in this vital industry.
Substation Industry Segmentation
-
1. Voltage
- 1.1. High
- 1.2. Medium
- 1.3. Low
-
2. Application
- 2.1. Power Utilities
- 2.2. Commercial & Industrial
- 2.3. Other Applications
Substation Industry Segmentation By Geography
- 1. North America
- 2. Europe
- 3. Asia Pacific
- 4. South America
- 5. Middle East and Africa
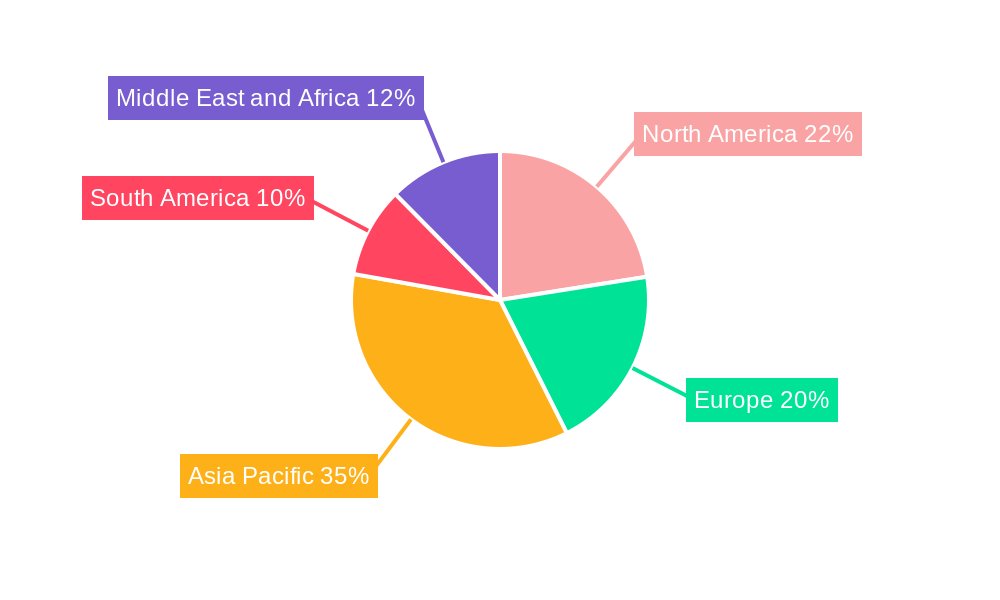
Substation Industry Regional Market Share
Geographic Coverage of Substation Industry
Substation Industry REPORT HIGHLIGHTS
| Aspects | Details |
|---|---|
| Study Period | 2020-2034 |
| Base Year | 2025 |
| Estimated Year | 2026 |
| Forecast Period | 2026-2034 |
| Historical Period | 2020-2025 |
| Growth Rate | CAGR of 4.50% from 2020-2034 |
| Segmentation |
|
Table of Contents
- 1. Introduction
- 1.1. Research Scope
- 1.2. Market Segmentation
- 1.3. Research Objective
- 1.4. Definitions and Assumptions
- 2. Executive Summary
- 2.1. Market Snapshot
- 3. Market Dynamics
- 3.1. Market Drivers
- 3.2. Market Restrains
- 3.3. Market Trends
- 3.4. Market Opportunities
- 4. Market Factor Analysis
- 4.1. Porters Five Forces
- 4.1.1. Bargaining Power of Suppliers
- 4.1.2. Bargaining Power of Buyers
- 4.1.3. Threat of New Entrants
- 4.1.4. Threat of Substitutes
- 4.1.5. Competitive Rivalry
- 4.2. PESTEL analysis
- 4.3. BCG Analysis
- 4.3.1. Stars (High Growth, High Market Share)
- 4.3.2. Cash Cows (Low Growth, High Market Share)
- 4.3.3. Question Mark (High Growth, Low Market Share)
- 4.3.4. Dogs (Low Growth, Low Market Share)
- 4.4. Ansoff Matrix Analysis
- 4.5. Supply Chain Analysis
- 4.6. Regulatory Landscape
- 4.7. Current Market Potential and Opportunity Assessment (TAM–SAM–SOM Framework)
- 4.8. PRI Analyst Note
- 4.1. Porters Five Forces
- 5. Market Analysis, Insights and Forecast 2021-2033
- 5.1. Market Analysis, Insights and Forecast - by Voltage
- 5.1.1. High
- 5.1.2. Medium
- 5.1.3. Low
- 5.2. Market Analysis, Insights and Forecast - by Application
- 5.2.1. Power Utilities
- 5.2.2. Commercial & Industrial
- 5.2.3. Other Applications
- 5.3. Market Analysis, Insights and Forecast - by Region
- 5.3.1. North America
- 5.3.2. Europe
- 5.3.3. Asia Pacific
- 5.3.4. South America
- 5.3.5. Middle East and Africa
- 5.1. Market Analysis, Insights and Forecast - by Voltage
- 6. Global Substation Industry Analysis, Insights and Forecast, 2021-2033
- 6.1. Market Analysis, Insights and Forecast - by Voltage
- 6.1.1. High
- 6.1.2. Medium
- 6.1.3. Low
- 6.2. Market Analysis, Insights and Forecast - by Application
- 6.2.1. Power Utilities
- 6.2.2. Commercial & Industrial
- 6.2.3. Other Applications
- 6.1. Market Analysis, Insights and Forecast - by Voltage
- 7. North America Substation Industry Analysis, Insights and Forecast, 2020-2032
- 7.1. Market Analysis, Insights and Forecast - by Voltage
- 7.1.1. High
- 7.1.2. Medium
- 7.1.3. Low
- 7.2. Market Analysis, Insights and Forecast - by Application
- 7.2.1. Power Utilities
- 7.2.2. Commercial & Industrial
- 7.2.3. Other Applications
- 7.1. Market Analysis, Insights and Forecast - by Voltage
- 8. Europe Substation Industry Analysis, Insights and Forecast, 2020-2032
- 8.1. Market Analysis, Insights and Forecast - by Voltage
- 8.1.1. High
- 8.1.2. Medium
- 8.1.3. Low
- 8.2. Market Analysis, Insights and Forecast - by Application
- 8.2.1. Power Utilities
- 8.2.2. Commercial & Industrial
- 8.2.3. Other Applications
- 8.1. Market Analysis, Insights and Forecast - by Voltage
- 9. Asia Pacific Substation Industry Analysis, Insights and Forecast, 2020-2032
- 9.1. Market Analysis, Insights and Forecast - by Voltage
- 9.1.1. High
- 9.1.2. Medium
- 9.1.3. Low
- 9.2. Market Analysis, Insights and Forecast - by Application
- 9.2.1. Power Utilities
- 9.2.2. Commercial & Industrial
- 9.2.3. Other Applications
- 9.1. Market Analysis, Insights and Forecast - by Voltage
- 10. South America Substation Industry Analysis, Insights and Forecast, 2020-2032
- 10.1. Market Analysis, Insights and Forecast - by Voltage
- 10.1.1. High
- 10.1.2. Medium
- 10.1.3. Low
- 10.2. Market Analysis, Insights and Forecast - by Application
- 10.2.1. Power Utilities
- 10.2.2. Commercial & Industrial
- 10.2.3. Other Applications
- 10.1. Market Analysis, Insights and Forecast - by Voltage
- 11. Middle East and Africa Substation Industry Analysis, Insights and Forecast, 2020-2032
- 11.1. Market Analysis, Insights and Forecast - by Voltage
- 11.1.1. High
- 11.1.2. Medium
- 11.1.3. Low
- 11.2. Market Analysis, Insights and Forecast - by Application
- 11.2.1. Power Utilities
- 11.2.2. Commercial & Industrial
- 11.2.3. Other Applications
- 11.1. Market Analysis, Insights and Forecast - by Voltage
- 12. Competitive Analysis
- 12.1. Company Profiles
- 12.1.1 Kirloskar Electric Company Ltd
- 12.1.1.1. Company Overview
- 12.1.1.2. Products
- 12.1.1.3. Company Financials
- 12.1.1.4. SWOT Analysis
- 12.1.2 ABB Ltd
- 12.1.2.1. Company Overview
- 12.1.2.2. Products
- 12.1.2.3. Company Financials
- 12.1.2.4. SWOT Analysis
- 12.1.3 Larsen & Toubro Ltd
- 12.1.3.1. Company Overview
- 12.1.3.2. Products
- 12.1.3.3. Company Financials
- 12.1.3.4. SWOT Analysis
- 12.1.4 Alfanar Group
- 12.1.4.1. Company Overview
- 12.1.4.2. Products
- 12.1.4.3. Company Financials
- 12.1.4.4. SWOT Analysis
- 12.1.5 Lucy Group Ltd
- 12.1.5.1. Company Overview
- 12.1.5.2. Products
- 12.1.5.3. Company Financials
- 12.1.5.4. SWOT Analysis
- 12.1.6 Schneider Electric SE
- 12.1.6.1. Company Overview
- 12.1.6.2. Products
- 12.1.6.3. Company Financials
- 12.1.6.4. SWOT Analysis
- 12.1.7 Eaton Corporation PLC
- 12.1.7.1. Company Overview
- 12.1.7.2. Products
- 12.1.7.3. Company Financials
- 12.1.7.4. SWOT Analysis
- 12.1.8 General Electric Company
- 12.1.8.1. Company Overview
- 12.1.8.2. Products
- 12.1.8.3. Company Financials
- 12.1.8.4. SWOT Analysis
- 12.1.9 C&S Electric Limited*List Not Exhaustive
- 12.1.9.1. Company Overview
- 12.1.9.2. Products
- 12.1.9.3. Company Financials
- 12.1.9.4. SWOT Analysis
- 12.1.10 Siemens AG
- 12.1.10.1. Company Overview
- 12.1.10.2. Products
- 12.1.10.3. Company Financials
- 12.1.10.4. SWOT Analysis
- 12.1.1 Kirloskar Electric Company Ltd
- 12.2. Market Entropy
- 12.2.1 Company's Key Areas Served
- 12.2.2 Recent Developments
- 12.3. Company Market Share Analysis 2025
- 12.3.1 Top 5 Companies Market Share Analysis
- 12.3.2 Top 3 Companies Market Share Analysis
- 12.4. List of Potential Customers
- 13. Research Methodology
List of Figures
- Figure 1: Global Substation Industry Revenue Breakdown (USD Billion, %) by Region 2025 & 2033
- Figure 2: North America Substation Industry Revenue (USD Billion), by Voltage 2025 & 2033
- Figure 3: North America Substation Industry Revenue Share (%), by Voltage 2025 & 2033
- Figure 4: North America Substation Industry Revenue (USD Billion), by Application 2025 & 2033
- Figure 5: North America Substation Industry Revenue Share (%), by Application 2025 & 2033
- Figure 6: North America Substation Industry Revenue (USD Billion), by Country 2025 & 2033
- Figure 7: North America Substation Industry Revenue Share (%), by Country 2025 & 2033
- Figure 8: Europe Substation Industry Revenue (USD Billion), by Voltage 2025 & 2033
- Figure 9: Europe Substation Industry Revenue Share (%), by Voltage 2025 & 2033
- Figure 10: Europe Substation Industry Revenue (USD Billion), by Application 2025 & 2033
- Figure 11: Europe Substation Industry Revenue Share (%), by Application 2025 & 2033
- Figure 12: Europe Substation Industry Revenue (USD Billion), by Country 2025 & 2033
- Figure 13: Europe Substation Industry Revenue Share (%), by Country 2025 & 2033
- Figure 14: Asia Pacific Substation Industry Revenue (USD Billion), by Voltage 2025 & 2033
- Figure 15: Asia Pacific Substation Industry Revenue Share (%), by Voltage 2025 & 2033
- Figure 16: Asia Pacific Substation Industry Revenue (USD Billion), by Application 2025 & 2033
- Figure 17: Asia Pacific Substation Industry Revenue Share (%), by Application 2025 & 2033
- Figure 18: Asia Pacific Substation Industry Revenue (USD Billion), by Country 2025 & 2033
- Figure 19: Asia Pacific Substation Industry Revenue Share (%), by Country 2025 & 2033
- Figure 20: South America Substation Industry Revenue (USD Billion), by Voltage 2025 & 2033
- Figure 21: South America Substation Industry Revenue Share (%), by Voltage 2025 & 2033
- Figure 22: South America Substation Industry Revenue (USD Billion), by Application 2025 & 2033
- Figure 23: South America Substation Industry Revenue Share (%), by Application 2025 & 2033
- Figure 24: South America Substation Industry Revenue (USD Billion), by Country 2025 & 2033
- Figure 25: South America Substation Industry Revenue Share (%), by Country 2025 & 2033
- Figure 26: Middle East and Africa Substation Industry Revenue (USD Billion), by Voltage 2025 & 2033
- Figure 27: Middle East and Africa Substation Industry Revenue Share (%), by Voltage 2025 & 2033
- Figure 28: Middle East and Africa Substation Industry Revenue (USD Billion), by Application 2025 & 2033
- Figure 29: Middle East and Africa Substation Industry Revenue Share (%), by Application 2025 & 2033
- Figure 30: Middle East and Africa Substation Industry Revenue (USD Billion), by Country 2025 & 2033
- Figure 31: Middle East and Africa Substation Industry Revenue Share (%), by Country 2025 & 2033
List of Tables
- Table 1: Global Substation Industry Revenue USD Billion Forecast, by Voltage 2020 & 2033
- Table 2: Global Substation Industry Revenue USD Billion Forecast, by Application 2020 & 2033
- Table 3: Global Substation Industry Revenue USD Billion Forecast, by Region 2020 & 2033
- Table 4: Global Substation Industry Revenue USD Billion Forecast, by Voltage 2020 & 2033
- Table 5: Global Substation Industry Revenue USD Billion Forecast, by Application 2020 & 2033
- Table 6: Global Substation Industry Revenue USD Billion Forecast, by Country 2020 & 2033
- Table 7: Global Substation Industry Revenue USD Billion Forecast, by Voltage 2020 & 2033
- Table 8: Global Substation Industry Revenue USD Billion Forecast, by Application 2020 & 2033
- Table 9: Global Substation Industry Revenue USD Billion Forecast, by Country 2020 & 2033
- Table 10: Global Substation Industry Revenue USD Billion Forecast, by Voltage 2020 & 2033
- Table 11: Global Substation Industry Revenue USD Billion Forecast, by Application 2020 & 2033
- Table 12: Global Substation Industry Revenue USD Billion Forecast, by Country 2020 & 2033
- Table 13: Global Substation Industry Revenue USD Billion Forecast, by Voltage 2020 & 2033
- Table 14: Global Substation Industry Revenue USD Billion Forecast, by Application 2020 & 2033
- Table 15: Global Substation Industry Revenue USD Billion Forecast, by Country 2020 & 2033
- Table 16: Global Substation Industry Revenue USD Billion Forecast, by Voltage 2020 & 2033
- Table 17: Global Substation Industry Revenue USD Billion Forecast, by Application 2020 & 2033
- Table 18: Global Substation Industry Revenue USD Billion Forecast, by Country 2020 & 2033
Frequently Asked Questions
1. What is the projected Compound Annual Growth Rate (CAGR) of the Substation Industry?
The projected CAGR is approximately 4.50%.
2. Which companies are prominent players in the Substation Industry?
Key companies in the market include Kirloskar Electric Company Ltd, ABB Ltd, Larsen & Toubro Ltd, Alfanar Group, Lucy Group Ltd, Schneider Electric SE, Eaton Corporation PLC, General Electric Company, C&S Electric Limited*List Not Exhaustive, Siemens AG.
3. What are the main segments of the Substation Industry?
The market segments include Voltage, Application.
4. Can you provide details about the market size?
The market size is estimated to be USD 139.23 USD Billion as of 2022.
5. What are some drivers contributing to market growth?
4.; Growing Energy Demand4.; Renewable Energy Transition.
6. What are the notable trends driving market growth?
Power Utilities Segment to Witness Significant Growth.
7. Are there any restraints impacting market growth?
4.; Phasing out of Conventional Sources of Electricity.
8. Can you provide examples of recent developments in the market?
Strategic partnerships between utilities and technology providers
9. What pricing options are available for accessing the report?
Pricing options include single-user, multi-user, and enterprise licenses priced at USD 4750, USD 5250, and USD 8750 respectively.
10. Is the market size provided in terms of value or volume?
The market size is provided in terms of value, measured in USD Billion.
11. Are there any specific market keywords associated with the report?
Yes, the market keyword associated with the report is "Substation Industry," which aids in identifying and referencing the specific market segment covered.
12. How do I determine which pricing option suits my needs best?
The pricing options vary based on user requirements and access needs. Individual users may opt for single-user licenses, while businesses requiring broader access may choose multi-user or enterprise licenses for cost-effective access to the report.
13. Are there any additional resources or data provided in the Substation Industry report?
While the report offers comprehensive insights, it's advisable to review the specific contents or supplementary materials provided to ascertain if additional resources or data are available.
14. How can I stay updated on further developments or reports in the Substation Industry?
To stay informed about further developments, trends, and reports in the Substation Industry, consider subscribing to industry newsletters, following relevant companies and organizations, or regularly checking reputable industry news sources and publications.
Methodology
Step 1 - Identification of Relevant Samples Size from Population Database


Step 2 - Approaches for Defining Global Market Size (Value, Volume* & Price*)

Note*: In applicable scenarios
Step 3 - Data Sources
Primary Research
- Web Analytics
- Survey Reports
- Research Institute
- Latest Research Reports
- Opinion Leaders
Secondary Research
- Annual Reports
- White Paper
- Latest Press Release
- Industry Association
- Paid Database
- Investor Presentations

Step 4 - Data Triangulation
Involves using different sources of information in order to increase the validity of a study
These sources are likely to be stakeholders in a program - participants, other researchers, program staff, other community members, and so on.
Then we put all data in single framework & apply various statistical tools to find out the dynamic on the market.
During the analysis stage, feedback from the stakeholder groups would be compared to determine areas of agreement as well as areas of divergence