
Key Insights
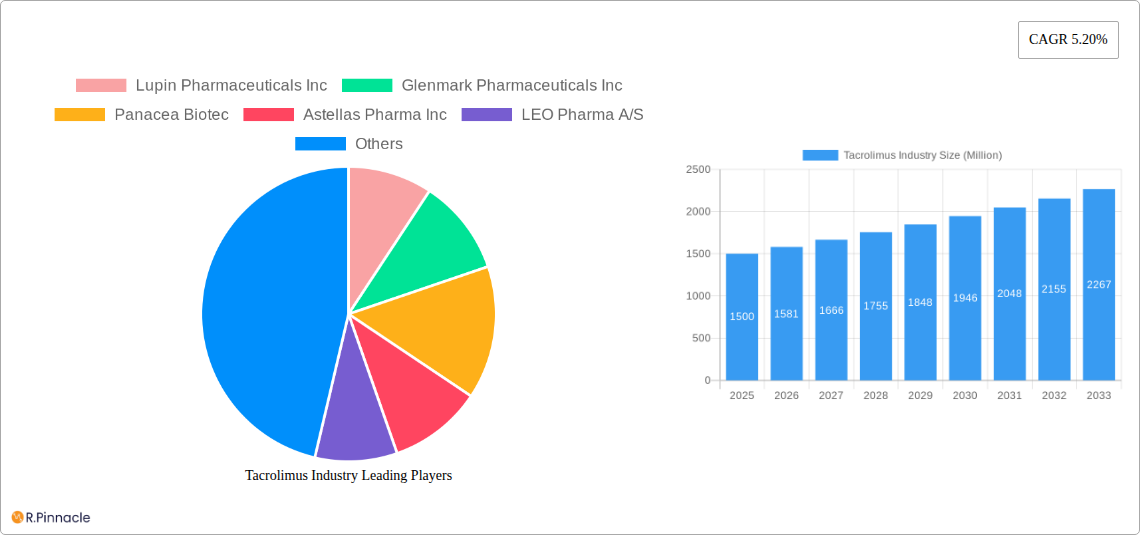
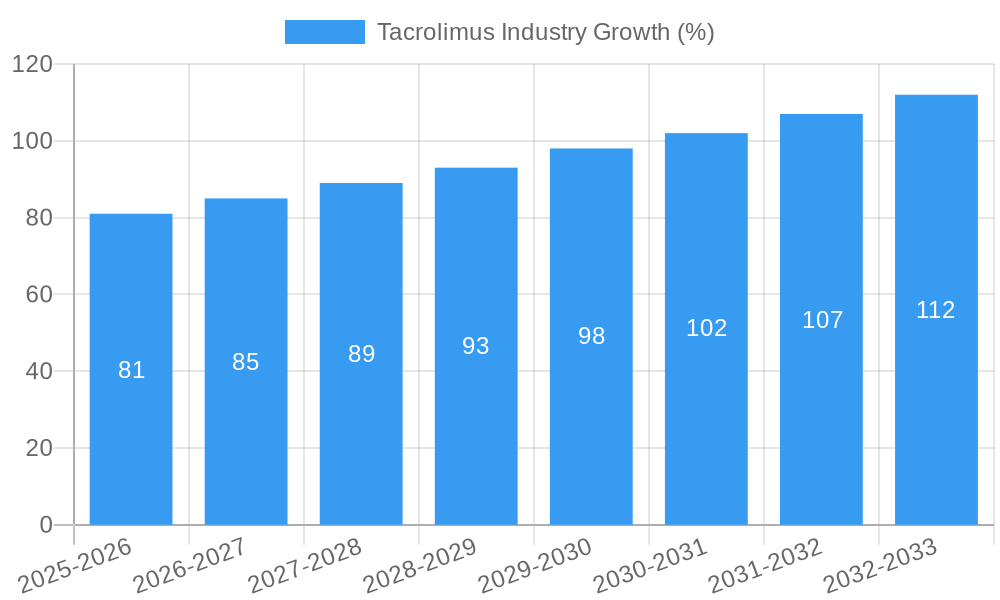
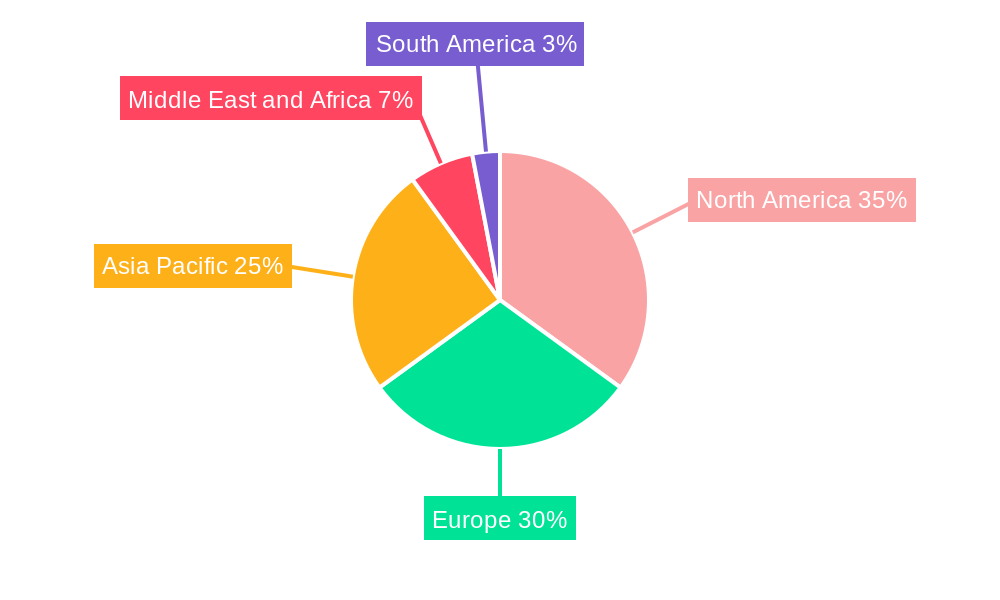
The global tacrolimus market, valued at approximately $1.5 billion in 2025, is projected to experience robust growth, exhibiting a compound annual growth rate (CAGR) of 5.2% from 2025 to 2033. This expansion is fueled by several key drivers. The increasing prevalence of autoimmune diseases like dermatitis and organ transplant procedures requiring immunosuppression significantly boosts demand for tacrolimus. Furthermore, ongoing research and development efforts focusing on novel drug delivery systems (e.g., improved formulations for enhanced efficacy and reduced side effects) are contributing to market growth. The segment comprising tablets and capsules currently holds the largest market share due to ease of administration and established market presence. However, injections are witnessing significant growth due to their targeted delivery and potential for improved therapeutic outcomes. Geographically, North America and Europe currently dominate the market, driven by high healthcare expenditure and advanced healthcare infrastructure. However, the Asia-Pacific region is poised for substantial growth, fueled by rising healthcare awareness, increasing disposable incomes, and growing prevalence of target diseases. Competitive intensity is high, with key players such as Lupin, Glenmark, Astellas, and Novartis actively engaged in expanding their product portfolios and geographical reach. Despite these positive factors, market growth may face some constraints, including potential side effects associated with tacrolimus and the availability of alternative immunosuppressants.
The forecast period (2025-2033) anticipates continued market expansion, driven by factors outlined above. Specific regional growth will vary, with the Asia-Pacific region expected to witness faster growth compared to mature markets like North America and Europe. The market will likely see further segmentation within product types and applications, with a focus on developing specialized formulations tailored to specific patient needs. Companies will likely invest in clinical trials to further establish the efficacy and safety profile of tacrolimus for diverse applications, driving further innovation within the market. The market's future trajectory will heavily depend on successful R&D efforts, regulatory approvals, and the evolving landscape of alternative treatments for autoimmune diseases and organ transplantation.
Tacrolimus Industry Market Report: 2019-2033
This comprehensive report provides an in-depth analysis of the global Tacrolimus market, offering invaluable insights for industry professionals, investors, and strategic decision-makers. The report covers the period 2019-2033, with a focus on the estimated year 2025 and a forecast period of 2025-2033. Key players such as Lupin Pharmaceuticals Inc, Glenmark Pharmaceuticals Inc, Panacea Biotec, Astellas Pharma Inc, LEO Pharma A/S, GlaxoSmithKline plc, Novartis AG, Biocon Ltd, Dr Reddy's Laboratories Ltd, and Pfizer Inc are thoroughly analyzed. The market is segmented by product type (Tablets and Capsules, Injections, Others), application (Immunosuppression, Dermatitis, Others), and end-user (Hospitals, Clinics, Other End Users). The report projects a market value exceeding xx Million by 2033.
Tacrolimus Industry Market Structure & Innovation Trends
The Tacrolimus market exhibits a moderately concentrated structure, with key players holding significant market share. Lupin Pharmaceuticals Inc and Glenmark Pharmaceuticals Inc, for instance, individually hold approximately xx% and xx% market share in 2025, respectively, based on estimated sales. The market is driven by continuous innovation in drug delivery systems and formulations, aiming for improved efficacy and reduced side effects. Stringent regulatory frameworks, particularly concerning drug safety and efficacy, significantly influence market dynamics. Generic competition is also a key factor, affecting pricing and market share. Mergers and acquisitions (M&A) have played a crucial role in shaping the market landscape, with several large pharmaceutical companies acquiring smaller players to expand their product portfolios. The total M&A deal value in the Tacrolimus market during 2019-2024 reached approximately xx Million.
- Market concentration: Moderately concentrated
- Innovation drivers: Improved drug delivery, enhanced efficacy
- Regulatory frameworks: Stringent, impacting market entry
- Product substitutes: Limited, but emerging alternatives exist
- M&A activity: Significant, with a total deal value of approximately xx Million (2019-2024)
Tacrolimus Industry Market Dynamics & Trends
The Tacrolimus market is experiencing robust growth, driven primarily by the increasing prevalence of autoimmune diseases and organ transplantation procedures globally. Technological advancements, including the development of novel formulations and delivery systems, further fuel market expansion. Consumer preference for improved efficacy and reduced side effects is also a major driver. The competitive landscape is characterized by intense rivalry among established players and the emergence of new entrants. This competition is primarily focused on innovation, pricing strategies, and market penetration. The market is estimated to register a CAGR of xx% during the forecast period (2025-2033), with market penetration exceeding xx% by 2033 in key regions. The market is expected to be influenced by factors such as advancements in biotechnology, the rising demand for effective immunosuppressants, and the growing prevalence of skin conditions.
Dominant Regions & Segments in Tacrolimus Industry
The North American region currently dominates the Tacrolimus market, driven by high healthcare expenditure, advanced healthcare infrastructure, and a large patient pool. Within product types, Tablets and Capsules constitute the largest segment, accounting for approximately xx% of the total market in 2025 due to ease of administration and established market presence. Immunosuppression remains the leading application segment, owing to the increasing number of organ transplant procedures. Hospitals are the primary end-users, driven by their capacity to handle complex treatments.
Key Drivers for North American Dominance:
- High healthcare expenditure
- Well-developed healthcare infrastructure
- Large patient pool
- High adoption rates for advanced treatment protocols
Dominant Segments:
- Product Type: Tablets and Capsules
- Application: Immunosuppression
- End User: Hospitals
Tacrolimus Industry Product Innovations
Recent innovations in the Tacrolimus market focus on improving drug delivery systems to enhance patient compliance and reduce side effects. This includes the development of extended-release formulations and topical applications. Companies are also exploring novel drug combinations to improve therapeutic outcomes and address unmet clinical needs. These innovations are strategically aimed at enhancing market fit and competitiveness.
Report Scope & Segmentation Analysis
This report provides a comprehensive analysis of the Tacrolimus market, segmented by product type (Tablets and Capsules, Injections, Others), application (Immunosuppression, Dermatitis, Others), and end-user (Hospitals, Clinics, Other End Users). Each segment is analyzed in detail, providing growth projections, market size estimations, and competitive dynamics for the forecast period (2025-2033). The report considers various factors driving segment-specific growth, such as disease prevalence, treatment patterns, and regulatory approvals.
Key Drivers of Tacrolimus Industry Growth
The Tacrolimus industry's growth is fueled by several factors: the rising prevalence of autoimmune diseases requiring immunosuppression, a growing number of organ transplant procedures, increasing healthcare expenditure globally, advancements in drug delivery systems enhancing efficacy and reducing side effects, and the launch of novel formulations with improved safety profiles. Government initiatives promoting organ donation and transplantation also contribute to market expansion.
Challenges in the Tacrolimus Industry Sector
The Tacrolimus market faces challenges, including stringent regulatory approvals delaying product launches, fluctuating raw material prices impacting production costs, intense competition from generic manufacturers leading to price erosion, and potential side effects limiting wider adoption. These factors can collectively hinder market growth by xx% if not mitigated effectively.
Emerging Opportunities in Tacrolimus Industry
Emerging opportunities exist in developing novel formulations with improved efficacy and safety profiles, expanding into untapped markets in developing countries, exploring new therapeutic applications of Tacrolimus, and leveraging digital technologies to enhance patient monitoring and improve treatment outcomes. These opportunities can potentially boost the market growth by xx% within the next decade.
Leading Players in the Tacrolimus Industry Market
- Lupin Pharmaceuticals Inc
- Glenmark Pharmaceuticals Inc
- Panacea Biotec
- Astellas Pharma Inc
- LEO Pharma A/S
- GlaxoSmithKline plc
- Novartis AG
- Biocon Ltd
- Dr Reddy's Laboratories Ltd
- Pfizer Inc
Key Developments in Tacrolimus Industry
- 2022: Launch of a novel Tacrolimus formulation by Astellas Pharma Inc.
- 2023: Approval of a generic Tacrolimus product by Dr. Reddy's Laboratories Ltd.
- 2024: Acquisition of a smaller Tacrolimus manufacturer by Novartis AG. (Further details not available in supplied information)
Future Outlook for Tacrolimus Industry Market
The Tacrolimus market is poised for continued growth, driven by factors such as increasing disease prevalence and technological advancements. Strategic investments in research and development, focusing on innovative drug delivery systems and combination therapies, will play a pivotal role in shaping the future market landscape. The market's future potential is significant, especially in emerging economies with growing healthcare infrastructure and rising awareness of autoimmune diseases. The market is expected to experience steady growth driven by both organic growth and M&A activities.
Tacrolimus Industry Segmentation
-
1. Product Type
- 1.1. Tablets and Capsules
- 1.2. Injections
- 1.3. Others (Ointments, Granules)
-
2. Application
- 2.1. Immunosuppression
- 2.2. Dermatitis
- 2.3. Others (Vitiligo, Eczema)
-
3. End Users
- 3.1. Hospitals
- 3.2. Clinics
- 3.3. Other End Users
Tacrolimus Industry Segmentation By Geography
-
1. North America
- 1.1. United States
- 1.2. Canada
- 1.3. Mexico
-
2. Europe
- 2.1. Germany
- 2.2. United Kingdom
- 2.3. France
- 2.4. Italy
- 2.5. Spain
- 2.6. Rest of Europe
-
3. Asia Pacific
- 3.1. China
- 3.2. Japan
- 3.3. India
- 3.4. Australia
- 3.5. South Korea
- 3.6. Rest of Asia Pacific
-
4. Middle East and Africa
- 4.1. GCC
- 4.2. South Africa
- 4.3. Rest of Middle East and Africa
-
5. South America
- 5.1. Brazil
- 5.2. Argentina
- 5.3. Rest of South America
Tacrolimus Industry REPORT HIGHLIGHTS
| Aspects | Details |
|---|---|
| Study Period | 2019-2033 |
| Base Year | 2024 |
| Estimated Year | 2025 |
| Forecast Period | 2025-2033 |
| Historical Period | 2019-2024 |
| Growth Rate | CAGR of 5.20% from 2019-2033 |
| Segmentation |
|
Table of Contents
- 1. Introduction
- 1.1. Research Scope
- 1.2. Market Segmentation
- 1.3. Research Methodology
- 1.4. Definitions and Assumptions
- 2. Executive Summary
- 2.1. Introduction
- 3. Market Dynamics
- 3.1. Introduction
- 3.2. Market Drivers
- 3.2.1. Increasing Number of Transplants Worldwide; Surge in Research and Development Activities for Immunosuppression
- 3.3. Market Restrains
- 3.3.1. Side Effects of the Tacrolimus
- 3.4. Market Trends
- 3.4.1. Immunosuppression Segment is Expected to Witness Growth over the Forecast Period
- 4. Market Factor Analysis
- 4.1. Porters Five Forces
- 4.2. Supply/Value Chain
- 4.3. PESTEL analysis
- 4.4. Market Entropy
- 4.5. Patent/Trademark Analysis
- 5. Global Tacrolimus Industry Analysis, Insights and Forecast, 2019-2031
- 5.1. Market Analysis, Insights and Forecast - by Product Type
- 5.1.1. Tablets and Capsules
- 5.1.2. Injections
- 5.1.3. Others (Ointments, Granules)
- 5.2. Market Analysis, Insights and Forecast - by Application
- 5.2.1. Immunosuppression
- 5.2.2. Dermatitis
- 5.2.3. Others (Vitiligo, Eczema)
- 5.3. Market Analysis, Insights and Forecast - by End Users
- 5.3.1. Hospitals
- 5.3.2. Clinics
- 5.3.3. Other End Users
- 5.4. Market Analysis, Insights and Forecast - by Region
- 5.4.1. North America
- 5.4.2. Europe
- 5.4.3. Asia Pacific
- 5.4.4. Middle East and Africa
- 5.4.5. South America
- 5.1. Market Analysis, Insights and Forecast - by Product Type
- 6. North America Tacrolimus Industry Analysis, Insights and Forecast, 2019-2031
- 6.1. Market Analysis, Insights and Forecast - by Product Type
- 6.1.1. Tablets and Capsules
- 6.1.2. Injections
- 6.1.3. Others (Ointments, Granules)
- 6.2. Market Analysis, Insights and Forecast - by Application
- 6.2.1. Immunosuppression
- 6.2.2. Dermatitis
- 6.2.3. Others (Vitiligo, Eczema)
- 6.3. Market Analysis, Insights and Forecast - by End Users
- 6.3.1. Hospitals
- 6.3.2. Clinics
- 6.3.3. Other End Users
- 6.1. Market Analysis, Insights and Forecast - by Product Type
- 7. Europe Tacrolimus Industry Analysis, Insights and Forecast, 2019-2031
- 7.1. Market Analysis, Insights and Forecast - by Product Type
- 7.1.1. Tablets and Capsules
- 7.1.2. Injections
- 7.1.3. Others (Ointments, Granules)
- 7.2. Market Analysis, Insights and Forecast - by Application
- 7.2.1. Immunosuppression
- 7.2.2. Dermatitis
- 7.2.3. Others (Vitiligo, Eczema)
- 7.3. Market Analysis, Insights and Forecast - by End Users
- 7.3.1. Hospitals
- 7.3.2. Clinics
- 7.3.3. Other End Users
- 7.1. Market Analysis, Insights and Forecast - by Product Type
- 8. Asia Pacific Tacrolimus Industry Analysis, Insights and Forecast, 2019-2031
- 8.1. Market Analysis, Insights and Forecast - by Product Type
- 8.1.1. Tablets and Capsules
- 8.1.2. Injections
- 8.1.3. Others (Ointments, Granules)
- 8.2. Market Analysis, Insights and Forecast - by Application
- 8.2.1. Immunosuppression
- 8.2.2. Dermatitis
- 8.2.3. Others (Vitiligo, Eczema)
- 8.3. Market Analysis, Insights and Forecast - by End Users
- 8.3.1. Hospitals
- 8.3.2. Clinics
- 8.3.3. Other End Users
- 8.1. Market Analysis, Insights and Forecast - by Product Type
- 9. Middle East and Africa Tacrolimus Industry Analysis, Insights and Forecast, 2019-2031
- 9.1. Market Analysis, Insights and Forecast - by Product Type
- 9.1.1. Tablets and Capsules
- 9.1.2. Injections
- 9.1.3. Others (Ointments, Granules)
- 9.2. Market Analysis, Insights and Forecast - by Application
- 9.2.1. Immunosuppression
- 9.2.2. Dermatitis
- 9.2.3. Others (Vitiligo, Eczema)
- 9.3. Market Analysis, Insights and Forecast - by End Users
- 9.3.1. Hospitals
- 9.3.2. Clinics
- 9.3.3. Other End Users
- 9.1. Market Analysis, Insights and Forecast - by Product Type
- 10. South America Tacrolimus Industry Analysis, Insights and Forecast, 2019-2031
- 10.1. Market Analysis, Insights and Forecast - by Product Type
- 10.1.1. Tablets and Capsules
- 10.1.2. Injections
- 10.1.3. Others (Ointments, Granules)
- 10.2. Market Analysis, Insights and Forecast - by Application
- 10.2.1. Immunosuppression
- 10.2.2. Dermatitis
- 10.2.3. Others (Vitiligo, Eczema)
- 10.3. Market Analysis, Insights and Forecast - by End Users
- 10.3.1. Hospitals
- 10.3.2. Clinics
- 10.3.3. Other End Users
- 10.1. Market Analysis, Insights and Forecast - by Product Type
- 11. North America Tacrolimus Industry Analysis, Insights and Forecast, 2019-2031
- 11.1. Market Analysis, Insights and Forecast - By Country/Sub-region
- 11.1.1. undefined
- 12. Europe Tacrolimus Industry Analysis, Insights and Forecast, 2019-2031
- 12.1. Market Analysis, Insights and Forecast - By Country/Sub-region
- 12.1.1. undefined
- 13. Asia Pacific Tacrolimus Industry Analysis, Insights and Forecast, 2019-2031
- 13.1. Market Analysis, Insights and Forecast - By Country/Sub-region
- 13.1.1. undefined
- 14. Middle East and Africa Tacrolimus Industry Analysis, Insights and Forecast, 2019-2031
- 14.1. Market Analysis, Insights and Forecast - By Country/Sub-region
- 14.1.1. undefined
- 15. South America Tacrolimus Industry Analysis, Insights and Forecast, 2019-2031
- 15.1. Market Analysis, Insights and Forecast - By Country/Sub-region
- 15.1.1. undefined
- 16. Competitive Analysis
- 16.1. Global Market Share Analysis 2024
- 16.2. Company Profiles
- 16.2.1 Lupin Pharmaceuticals Inc
- 16.2.1.1. Overview
- 16.2.1.2. Products
- 16.2.1.3. SWOT Analysis
- 16.2.1.4. Recent Developments
- 16.2.1.5. Financials (Based on Availability)
- 16.2.2 Glenmark Pharmaceuticals Inc
- 16.2.2.1. Overview
- 16.2.2.2. Products
- 16.2.2.3. SWOT Analysis
- 16.2.2.4. Recent Developments
- 16.2.2.5. Financials (Based on Availability)
- 16.2.3 Panacea Biotec
- 16.2.3.1. Overview
- 16.2.3.2. Products
- 16.2.3.3. SWOT Analysis
- 16.2.3.4. Recent Developments
- 16.2.3.5. Financials (Based on Availability)
- 16.2.4 Astellas Pharma Inc
- 16.2.4.1. Overview
- 16.2.4.2. Products
- 16.2.4.3. SWOT Analysis
- 16.2.4.4. Recent Developments
- 16.2.4.5. Financials (Based on Availability)
- 16.2.5 LEO Pharma A/S
- 16.2.5.1. Overview
- 16.2.5.2. Products
- 16.2.5.3. SWOT Analysis
- 16.2.5.4. Recent Developments
- 16.2.5.5. Financials (Based on Availability)
- 16.2.6 GlaxoSmithKline plc
- 16.2.6.1. Overview
- 16.2.6.2. Products
- 16.2.6.3. SWOT Analysis
- 16.2.6.4. Recent Developments
- 16.2.6.5. Financials (Based on Availability)
- 16.2.7 Novartis AG
- 16.2.7.1. Overview
- 16.2.7.2. Products
- 16.2.7.3. SWOT Analysis
- 16.2.7.4. Recent Developments
- 16.2.7.5. Financials (Based on Availability)
- 16.2.8 Biocon Ltd
- 16.2.8.1. Overview
- 16.2.8.2. Products
- 16.2.8.3. SWOT Analysis
- 16.2.8.4. Recent Developments
- 16.2.8.5. Financials (Based on Availability)
- 16.2.9 Dr Reddy's Laboratories Ltd
- 16.2.9.1. Overview
- 16.2.9.2. Products
- 16.2.9.3. SWOT Analysis
- 16.2.9.4. Recent Developments
- 16.2.9.5. Financials (Based on Availability)
- 16.2.10 Pfizer Inc
- 16.2.10.1. Overview
- 16.2.10.2. Products
- 16.2.10.3. SWOT Analysis
- 16.2.10.4. Recent Developments
- 16.2.10.5. Financials (Based on Availability)
- 16.2.1 Lupin Pharmaceuticals Inc
List of Figures
- Figure 1: Global Tacrolimus Industry Revenue Breakdown (Million, %) by Region 2024 & 2032
- Figure 2: Global Tacrolimus Industry Volume Breakdown (K Unit, %) by Region 2024 & 2032
- Figure 3: North America Tacrolimus Industry Revenue (Million), by Country 2024 & 2032
- Figure 4: North America Tacrolimus Industry Volume (K Unit), by Country 2024 & 2032
- Figure 5: North America Tacrolimus Industry Revenue Share (%), by Country 2024 & 2032
- Figure 6: North America Tacrolimus Industry Volume Share (%), by Country 2024 & 2032
- Figure 7: Europe Tacrolimus Industry Revenue (Million), by Country 2024 & 2032
- Figure 8: Europe Tacrolimus Industry Volume (K Unit), by Country 2024 & 2032
- Figure 9: Europe Tacrolimus Industry Revenue Share (%), by Country 2024 & 2032
- Figure 10: Europe Tacrolimus Industry Volume Share (%), by Country 2024 & 2032
- Figure 11: Asia Pacific Tacrolimus Industry Revenue (Million), by Country 2024 & 2032
- Figure 12: Asia Pacific Tacrolimus Industry Volume (K Unit), by Country 2024 & 2032
- Figure 13: Asia Pacific Tacrolimus Industry Revenue Share (%), by Country 2024 & 2032
- Figure 14: Asia Pacific Tacrolimus Industry Volume Share (%), by Country 2024 & 2032
- Figure 15: Middle East and Africa Tacrolimus Industry Revenue (Million), by Country 2024 & 2032
- Figure 16: Middle East and Africa Tacrolimus Industry Volume (K Unit), by Country 2024 & 2032
- Figure 17: Middle East and Africa Tacrolimus Industry Revenue Share (%), by Country 2024 & 2032
- Figure 18: Middle East and Africa Tacrolimus Industry Volume Share (%), by Country 2024 & 2032
- Figure 19: South America Tacrolimus Industry Revenue (Million), by Country 2024 & 2032
- Figure 20: South America Tacrolimus Industry Volume (K Unit), by Country 2024 & 2032
- Figure 21: South America Tacrolimus Industry Revenue Share (%), by Country 2024 & 2032
- Figure 22: South America Tacrolimus Industry Volume Share (%), by Country 2024 & 2032
- Figure 23: North America Tacrolimus Industry Revenue (Million), by Product Type 2024 & 2032
- Figure 24: North America Tacrolimus Industry Volume (K Unit), by Product Type 2024 & 2032
- Figure 25: North America Tacrolimus Industry Revenue Share (%), by Product Type 2024 & 2032
- Figure 26: North America Tacrolimus Industry Volume Share (%), by Product Type 2024 & 2032
- Figure 27: North America Tacrolimus Industry Revenue (Million), by Application 2024 & 2032
- Figure 28: North America Tacrolimus Industry Volume (K Unit), by Application 2024 & 2032
- Figure 29: North America Tacrolimus Industry Revenue Share (%), by Application 2024 & 2032
- Figure 30: North America Tacrolimus Industry Volume Share (%), by Application 2024 & 2032
- Figure 31: North America Tacrolimus Industry Revenue (Million), by End Users 2024 & 2032
- Figure 32: North America Tacrolimus Industry Volume (K Unit), by End Users 2024 & 2032
- Figure 33: North America Tacrolimus Industry Revenue Share (%), by End Users 2024 & 2032
- Figure 34: North America Tacrolimus Industry Volume Share (%), by End Users 2024 & 2032
- Figure 35: North America Tacrolimus Industry Revenue (Million), by Country 2024 & 2032
- Figure 36: North America Tacrolimus Industry Volume (K Unit), by Country 2024 & 2032
- Figure 37: North America Tacrolimus Industry Revenue Share (%), by Country 2024 & 2032
- Figure 38: North America Tacrolimus Industry Volume Share (%), by Country 2024 & 2032
- Figure 39: Europe Tacrolimus Industry Revenue (Million), by Product Type 2024 & 2032
- Figure 40: Europe Tacrolimus Industry Volume (K Unit), by Product Type 2024 & 2032
- Figure 41: Europe Tacrolimus Industry Revenue Share (%), by Product Type 2024 & 2032
- Figure 42: Europe Tacrolimus Industry Volume Share (%), by Product Type 2024 & 2032
- Figure 43: Europe Tacrolimus Industry Revenue (Million), by Application 2024 & 2032
- Figure 44: Europe Tacrolimus Industry Volume (K Unit), by Application 2024 & 2032
- Figure 45: Europe Tacrolimus Industry Revenue Share (%), by Application 2024 & 2032
- Figure 46: Europe Tacrolimus Industry Volume Share (%), by Application 2024 & 2032
- Figure 47: Europe Tacrolimus Industry Revenue (Million), by End Users 2024 & 2032
- Figure 48: Europe Tacrolimus Industry Volume (K Unit), by End Users 2024 & 2032
- Figure 49: Europe Tacrolimus Industry Revenue Share (%), by End Users 2024 & 2032
- Figure 50: Europe Tacrolimus Industry Volume Share (%), by End Users 2024 & 2032
- Figure 51: Europe Tacrolimus Industry Revenue (Million), by Country 2024 & 2032
- Figure 52: Europe Tacrolimus Industry Volume (K Unit), by Country 2024 & 2032
- Figure 53: Europe Tacrolimus Industry Revenue Share (%), by Country 2024 & 2032
- Figure 54: Europe Tacrolimus Industry Volume Share (%), by Country 2024 & 2032
- Figure 55: Asia Pacific Tacrolimus Industry Revenue (Million), by Product Type 2024 & 2032
- Figure 56: Asia Pacific Tacrolimus Industry Volume (K Unit), by Product Type 2024 & 2032
- Figure 57: Asia Pacific Tacrolimus Industry Revenue Share (%), by Product Type 2024 & 2032
- Figure 58: Asia Pacific Tacrolimus Industry Volume Share (%), by Product Type 2024 & 2032
- Figure 59: Asia Pacific Tacrolimus Industry Revenue (Million), by Application 2024 & 2032
- Figure 60: Asia Pacific Tacrolimus Industry Volume (K Unit), by Application 2024 & 2032
- Figure 61: Asia Pacific Tacrolimus Industry Revenue Share (%), by Application 2024 & 2032
- Figure 62: Asia Pacific Tacrolimus Industry Volume Share (%), by Application 2024 & 2032
- Figure 63: Asia Pacific Tacrolimus Industry Revenue (Million), by End Users 2024 & 2032
- Figure 64: Asia Pacific Tacrolimus Industry Volume (K Unit), by End Users 2024 & 2032
- Figure 65: Asia Pacific Tacrolimus Industry Revenue Share (%), by End Users 2024 & 2032
- Figure 66: Asia Pacific Tacrolimus Industry Volume Share (%), by End Users 2024 & 2032
- Figure 67: Asia Pacific Tacrolimus Industry Revenue (Million), by Country 2024 & 2032
- Figure 68: Asia Pacific Tacrolimus Industry Volume (K Unit), by Country 2024 & 2032
- Figure 69: Asia Pacific Tacrolimus Industry Revenue Share (%), by Country 2024 & 2032
- Figure 70: Asia Pacific Tacrolimus Industry Volume Share (%), by Country 2024 & 2032
- Figure 71: Middle East and Africa Tacrolimus Industry Revenue (Million), by Product Type 2024 & 2032
- Figure 72: Middle East and Africa Tacrolimus Industry Volume (K Unit), by Product Type 2024 & 2032
- Figure 73: Middle East and Africa Tacrolimus Industry Revenue Share (%), by Product Type 2024 & 2032
- Figure 74: Middle East and Africa Tacrolimus Industry Volume Share (%), by Product Type 2024 & 2032
- Figure 75: Middle East and Africa Tacrolimus Industry Revenue (Million), by Application 2024 & 2032
- Figure 76: Middle East and Africa Tacrolimus Industry Volume (K Unit), by Application 2024 & 2032
- Figure 77: Middle East and Africa Tacrolimus Industry Revenue Share (%), by Application 2024 & 2032
- Figure 78: Middle East and Africa Tacrolimus Industry Volume Share (%), by Application 2024 & 2032
- Figure 79: Middle East and Africa Tacrolimus Industry Revenue (Million), by End Users 2024 & 2032
- Figure 80: Middle East and Africa Tacrolimus Industry Volume (K Unit), by End Users 2024 & 2032
- Figure 81: Middle East and Africa Tacrolimus Industry Revenue Share (%), by End Users 2024 & 2032
- Figure 82: Middle East and Africa Tacrolimus Industry Volume Share (%), by End Users 2024 & 2032
- Figure 83: Middle East and Africa Tacrolimus Industry Revenue (Million), by Country 2024 & 2032
- Figure 84: Middle East and Africa Tacrolimus Industry Volume (K Unit), by Country 2024 & 2032
- Figure 85: Middle East and Africa Tacrolimus Industry Revenue Share (%), by Country 2024 & 2032
- Figure 86: Middle East and Africa Tacrolimus Industry Volume Share (%), by Country 2024 & 2032
- Figure 87: South America Tacrolimus Industry Revenue (Million), by Product Type 2024 & 2032
- Figure 88: South America Tacrolimus Industry Volume (K Unit), by Product Type 2024 & 2032
- Figure 89: South America Tacrolimus Industry Revenue Share (%), by Product Type 2024 & 2032
- Figure 90: South America Tacrolimus Industry Volume Share (%), by Product Type 2024 & 2032
- Figure 91: South America Tacrolimus Industry Revenue (Million), by Application 2024 & 2032
- Figure 92: South America Tacrolimus Industry Volume (K Unit), by Application 2024 & 2032
- Figure 93: South America Tacrolimus Industry Revenue Share (%), by Application 2024 & 2032
- Figure 94: South America Tacrolimus Industry Volume Share (%), by Application 2024 & 2032
- Figure 95: South America Tacrolimus Industry Revenue (Million), by End Users 2024 & 2032
- Figure 96: South America Tacrolimus Industry Volume (K Unit), by End Users 2024 & 2032
- Figure 97: South America Tacrolimus Industry Revenue Share (%), by End Users 2024 & 2032
- Figure 98: South America Tacrolimus Industry Volume Share (%), by End Users 2024 & 2032
- Figure 99: South America Tacrolimus Industry Revenue (Million), by Country 2024 & 2032
- Figure 100: South America Tacrolimus Industry Volume (K Unit), by Country 2024 & 2032
- Figure 101: South America Tacrolimus Industry Revenue Share (%), by Country 2024 & 2032
- Figure 102: South America Tacrolimus Industry Volume Share (%), by Country 2024 & 2032
List of Tables
- Table 1: Global Tacrolimus Industry Revenue Million Forecast, by Region 2019 & 2032
- Table 2: Global Tacrolimus Industry Volume K Unit Forecast, by Region 2019 & 2032
- Table 3: Global Tacrolimus Industry Revenue Million Forecast, by Product Type 2019 & 2032
- Table 4: Global Tacrolimus Industry Volume K Unit Forecast, by Product Type 2019 & 2032
- Table 5: Global Tacrolimus Industry Revenue Million Forecast, by Application 2019 & 2032
- Table 6: Global Tacrolimus Industry Volume K Unit Forecast, by Application 2019 & 2032
- Table 7: Global Tacrolimus Industry Revenue Million Forecast, by End Users 2019 & 2032
- Table 8: Global Tacrolimus Industry Volume K Unit Forecast, by End Users 2019 & 2032
- Table 9: Global Tacrolimus Industry Revenue Million Forecast, by Region 2019 & 2032
- Table 10: Global Tacrolimus Industry Volume K Unit Forecast, by Region 2019 & 2032
- Table 11: Global Tacrolimus Industry Revenue Million Forecast, by Country 2019 & 2032
- Table 12: Global Tacrolimus Industry Volume K Unit Forecast, by Country 2019 & 2032
- Table 13: Global Tacrolimus Industry Revenue Million Forecast, by Country 2019 & 2032
- Table 14: Global Tacrolimus Industry Volume K Unit Forecast, by Country 2019 & 2032
- Table 15: Global Tacrolimus Industry Revenue Million Forecast, by Country 2019 & 2032
- Table 16: Global Tacrolimus Industry Volume K Unit Forecast, by Country 2019 & 2032
- Table 17: Global Tacrolimus Industry Revenue Million Forecast, by Country 2019 & 2032
- Table 18: Global Tacrolimus Industry Volume K Unit Forecast, by Country 2019 & 2032
- Table 19: Global Tacrolimus Industry Revenue Million Forecast, by Country 2019 & 2032
- Table 20: Global Tacrolimus Industry Volume K Unit Forecast, by Country 2019 & 2032
- Table 21: Global Tacrolimus Industry Revenue Million Forecast, by Product Type 2019 & 2032
- Table 22: Global Tacrolimus Industry Volume K Unit Forecast, by Product Type 2019 & 2032
- Table 23: Global Tacrolimus Industry Revenue Million Forecast, by Application 2019 & 2032
- Table 24: Global Tacrolimus Industry Volume K Unit Forecast, by Application 2019 & 2032
- Table 25: Global Tacrolimus Industry Revenue Million Forecast, by End Users 2019 & 2032
- Table 26: Global Tacrolimus Industry Volume K Unit Forecast, by End Users 2019 & 2032
- Table 27: Global Tacrolimus Industry Revenue Million Forecast, by Country 2019 & 2032
- Table 28: Global Tacrolimus Industry Volume K Unit Forecast, by Country 2019 & 2032
- Table 29: United States Tacrolimus Industry Revenue (Million) Forecast, by Application 2019 & 2032
- Table 30: United States Tacrolimus Industry Volume (K Unit) Forecast, by Application 2019 & 2032
- Table 31: Canada Tacrolimus Industry Revenue (Million) Forecast, by Application 2019 & 2032
- Table 32: Canada Tacrolimus Industry Volume (K Unit) Forecast, by Application 2019 & 2032
- Table 33: Mexico Tacrolimus Industry Revenue (Million) Forecast, by Application 2019 & 2032
- Table 34: Mexico Tacrolimus Industry Volume (K Unit) Forecast, by Application 2019 & 2032
- Table 35: Global Tacrolimus Industry Revenue Million Forecast, by Product Type 2019 & 2032
- Table 36: Global Tacrolimus Industry Volume K Unit Forecast, by Product Type 2019 & 2032
- Table 37: Global Tacrolimus Industry Revenue Million Forecast, by Application 2019 & 2032
- Table 38: Global Tacrolimus Industry Volume K Unit Forecast, by Application 2019 & 2032
- Table 39: Global Tacrolimus Industry Revenue Million Forecast, by End Users 2019 & 2032
- Table 40: Global Tacrolimus Industry Volume K Unit Forecast, by End Users 2019 & 2032
- Table 41: Global Tacrolimus Industry Revenue Million Forecast, by Country 2019 & 2032
- Table 42: Global Tacrolimus Industry Volume K Unit Forecast, by Country 2019 & 2032
- Table 43: Germany Tacrolimus Industry Revenue (Million) Forecast, by Application 2019 & 2032
- Table 44: Germany Tacrolimus Industry Volume (K Unit) Forecast, by Application 2019 & 2032
- Table 45: United Kingdom Tacrolimus Industry Revenue (Million) Forecast, by Application 2019 & 2032
- Table 46: United Kingdom Tacrolimus Industry Volume (K Unit) Forecast, by Application 2019 & 2032
- Table 47: France Tacrolimus Industry Revenue (Million) Forecast, by Application 2019 & 2032
- Table 48: France Tacrolimus Industry Volume (K Unit) Forecast, by Application 2019 & 2032
- Table 49: Italy Tacrolimus Industry Revenue (Million) Forecast, by Application 2019 & 2032
- Table 50: Italy Tacrolimus Industry Volume (K Unit) Forecast, by Application 2019 & 2032
- Table 51: Spain Tacrolimus Industry Revenue (Million) Forecast, by Application 2019 & 2032
- Table 52: Spain Tacrolimus Industry Volume (K Unit) Forecast, by Application 2019 & 2032
- Table 53: Rest of Europe Tacrolimus Industry Revenue (Million) Forecast, by Application 2019 & 2032
- Table 54: Rest of Europe Tacrolimus Industry Volume (K Unit) Forecast, by Application 2019 & 2032
- Table 55: Global Tacrolimus Industry Revenue Million Forecast, by Product Type 2019 & 2032
- Table 56: Global Tacrolimus Industry Volume K Unit Forecast, by Product Type 2019 & 2032
- Table 57: Global Tacrolimus Industry Revenue Million Forecast, by Application 2019 & 2032
- Table 58: Global Tacrolimus Industry Volume K Unit Forecast, by Application 2019 & 2032
- Table 59: Global Tacrolimus Industry Revenue Million Forecast, by End Users 2019 & 2032
- Table 60: Global Tacrolimus Industry Volume K Unit Forecast, by End Users 2019 & 2032
- Table 61: Global Tacrolimus Industry Revenue Million Forecast, by Country 2019 & 2032
- Table 62: Global Tacrolimus Industry Volume K Unit Forecast, by Country 2019 & 2032
- Table 63: China Tacrolimus Industry Revenue (Million) Forecast, by Application 2019 & 2032
- Table 64: China Tacrolimus Industry Volume (K Unit) Forecast, by Application 2019 & 2032
- Table 65: Japan Tacrolimus Industry Revenue (Million) Forecast, by Application 2019 & 2032
- Table 66: Japan Tacrolimus Industry Volume (K Unit) Forecast, by Application 2019 & 2032
- Table 67: India Tacrolimus Industry Revenue (Million) Forecast, by Application 2019 & 2032
- Table 68: India Tacrolimus Industry Volume (K Unit) Forecast, by Application 2019 & 2032
- Table 69: Australia Tacrolimus Industry Revenue (Million) Forecast, by Application 2019 & 2032
- Table 70: Australia Tacrolimus Industry Volume (K Unit) Forecast, by Application 2019 & 2032
- Table 71: South Korea Tacrolimus Industry Revenue (Million) Forecast, by Application 2019 & 2032
- Table 72: South Korea Tacrolimus Industry Volume (K Unit) Forecast, by Application 2019 & 2032
- Table 73: Rest of Asia Pacific Tacrolimus Industry Revenue (Million) Forecast, by Application 2019 & 2032
- Table 74: Rest of Asia Pacific Tacrolimus Industry Volume (K Unit) Forecast, by Application 2019 & 2032
- Table 75: Global Tacrolimus Industry Revenue Million Forecast, by Product Type 2019 & 2032
- Table 76: Global Tacrolimus Industry Volume K Unit Forecast, by Product Type 2019 & 2032
- Table 77: Global Tacrolimus Industry Revenue Million Forecast, by Application 2019 & 2032
- Table 78: Global Tacrolimus Industry Volume K Unit Forecast, by Application 2019 & 2032
- Table 79: Global Tacrolimus Industry Revenue Million Forecast, by End Users 2019 & 2032
- Table 80: Global Tacrolimus Industry Volume K Unit Forecast, by End Users 2019 & 2032
- Table 81: Global Tacrolimus Industry Revenue Million Forecast, by Country 2019 & 2032
- Table 82: Global Tacrolimus Industry Volume K Unit Forecast, by Country 2019 & 2032
- Table 83: GCC Tacrolimus Industry Revenue (Million) Forecast, by Application 2019 & 2032
- Table 84: GCC Tacrolimus Industry Volume (K Unit) Forecast, by Application 2019 & 2032
- Table 85: South Africa Tacrolimus Industry Revenue (Million) Forecast, by Application 2019 & 2032
- Table 86: South Africa Tacrolimus Industry Volume (K Unit) Forecast, by Application 2019 & 2032
- Table 87: Rest of Middle East and Africa Tacrolimus Industry Revenue (Million) Forecast, by Application 2019 & 2032
- Table 88: Rest of Middle East and Africa Tacrolimus Industry Volume (K Unit) Forecast, by Application 2019 & 2032
- Table 89: Global Tacrolimus Industry Revenue Million Forecast, by Product Type 2019 & 2032
- Table 90: Global Tacrolimus Industry Volume K Unit Forecast, by Product Type 2019 & 2032
- Table 91: Global Tacrolimus Industry Revenue Million Forecast, by Application 2019 & 2032
- Table 92: Global Tacrolimus Industry Volume K Unit Forecast, by Application 2019 & 2032
- Table 93: Global Tacrolimus Industry Revenue Million Forecast, by End Users 2019 & 2032
- Table 94: Global Tacrolimus Industry Volume K Unit Forecast, by End Users 2019 & 2032
- Table 95: Global Tacrolimus Industry Revenue Million Forecast, by Country 2019 & 2032
- Table 96: Global Tacrolimus Industry Volume K Unit Forecast, by Country 2019 & 2032
- Table 97: Brazil Tacrolimus Industry Revenue (Million) Forecast, by Application 2019 & 2032
- Table 98: Brazil Tacrolimus Industry Volume (K Unit) Forecast, by Application 2019 & 2032
- Table 99: Argentina Tacrolimus Industry Revenue (Million) Forecast, by Application 2019 & 2032
- Table 100: Argentina Tacrolimus Industry Volume (K Unit) Forecast, by Application 2019 & 2032
- Table 101: Rest of South America Tacrolimus Industry Revenue (Million) Forecast, by Application 2019 & 2032
- Table 102: Rest of South America Tacrolimus Industry Volume (K Unit) Forecast, by Application 2019 & 2032
Frequently Asked Questions
1. What is the projected Compound Annual Growth Rate (CAGR) of the Tacrolimus Industry?
The projected CAGR is approximately 5.20%.
2. Which companies are prominent players in the Tacrolimus Industry?
Key companies in the market include Lupin Pharmaceuticals Inc, Glenmark Pharmaceuticals Inc, Panacea Biotec, Astellas Pharma Inc, LEO Pharma A/S, GlaxoSmithKline plc, Novartis AG, Biocon Ltd, Dr Reddy's Laboratories Ltd, Pfizer Inc.
3. What are the main segments of the Tacrolimus Industry?
The market segments include Product Type, Application, End Users.
4. Can you provide details about the market size?
The market size is estimated to be USD XX Million as of 2022.
5. What are some drivers contributing to market growth?
Increasing Number of Transplants Worldwide; Surge in Research and Development Activities for Immunosuppression.
6. What are the notable trends driving market growth?
Immunosuppression Segment is Expected to Witness Growth over the Forecast Period.
7. Are there any restraints impacting market growth?
Side Effects of the Tacrolimus.
8. Can you provide examples of recent developments in the market?
N/A
9. What pricing options are available for accessing the report?
Pricing options include single-user, multi-user, and enterprise licenses priced at USD 4750, USD 5250, and USD 8750 respectively.
10. Is the market size provided in terms of value or volume?
The market size is provided in terms of value, measured in Million and volume, measured in K Unit.
11. Are there any specific market keywords associated with the report?
Yes, the market keyword associated with the report is "Tacrolimus Industry," which aids in identifying and referencing the specific market segment covered.
12. How do I determine which pricing option suits my needs best?
The pricing options vary based on user requirements and access needs. Individual users may opt for single-user licenses, while businesses requiring broader access may choose multi-user or enterprise licenses for cost-effective access to the report.
13. Are there any additional resources or data provided in the Tacrolimus Industry report?
While the report offers comprehensive insights, it's advisable to review the specific contents or supplementary materials provided to ascertain if additional resources or data are available.
14. How can I stay updated on further developments or reports in the Tacrolimus Industry?
To stay informed about further developments, trends, and reports in the Tacrolimus Industry, consider subscribing to industry newsletters, following relevant companies and organizations, or regularly checking reputable industry news sources and publications.
Methodology
Step 1 - Identification of Relevant Samples Size from Population Database


Step 2 - Approaches for Defining Global Market Size (Value, Volume* & Price*)

Note*: In applicable scenarios
Step 3 - Data Sources
Primary Research
- Web Analytics
- Survey Reports
- Research Institute
- Latest Research Reports
- Opinion Leaders
Secondary Research
- Annual Reports
- White Paper
- Latest Press Release
- Industry Association
- Paid Database
- Investor Presentations

Step 4 - Data Triangulation
Involves using different sources of information in order to increase the validity of a study
These sources are likely to be stakeholders in a program - participants, other researchers, program staff, other community members, and so on.
Then we put all data in single framework & apply various statistical tools to find out the dynamic on the market.
During the analysis stage, feedback from the stakeholder groups would be compared to determine areas of agreement as well as areas of divergence


