

Key Insights
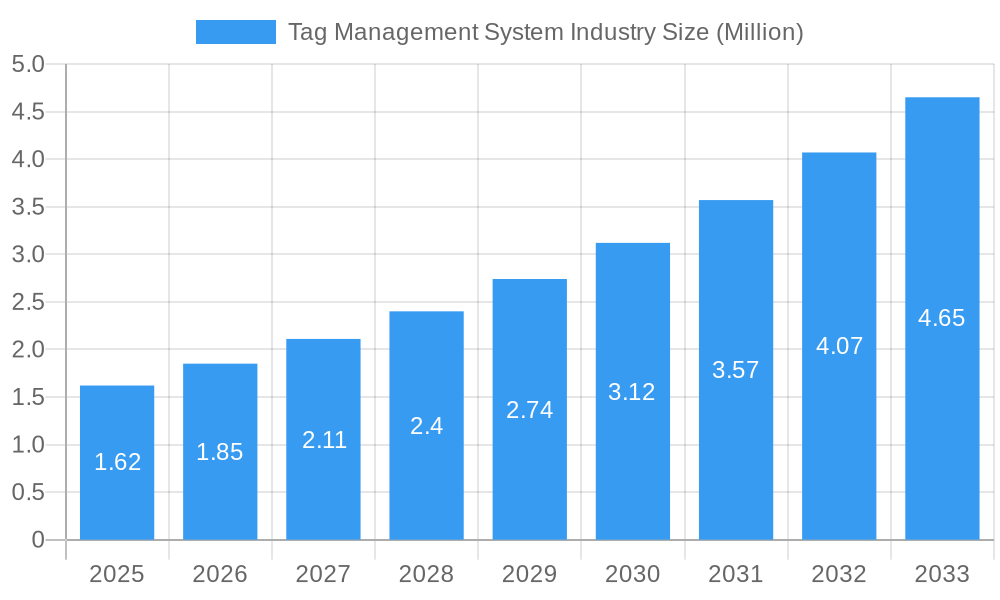
The Tag Management System (TMS) industry is poised for substantial growth, driven by the increasing need for efficient digital data management and the complexities of online advertising, analytics, and customer experience personalization. The market, valued at 1.62 Million in the base year of 2025, is projected to expand at a robust Compound Annual Growth Rate (CAGR) of 14.05% during the forecast period of 2025-2033. This accelerated growth is primarily fueled by the escalating volume of digital data generated across various platforms and the critical requirement for businesses to centralize, manage, and deploy marketing and analytics tags effectively. Key drivers include the growing adoption of data-driven marketing strategies, the imperative for enhanced website performance and speed, and the need for seamless integration of third-party tools for analytics, advertising, and personalization. The burgeoning e-commerce sector and the increasing reliance on digital channels for customer engagement are further accelerating demand for advanced TMS solutions.
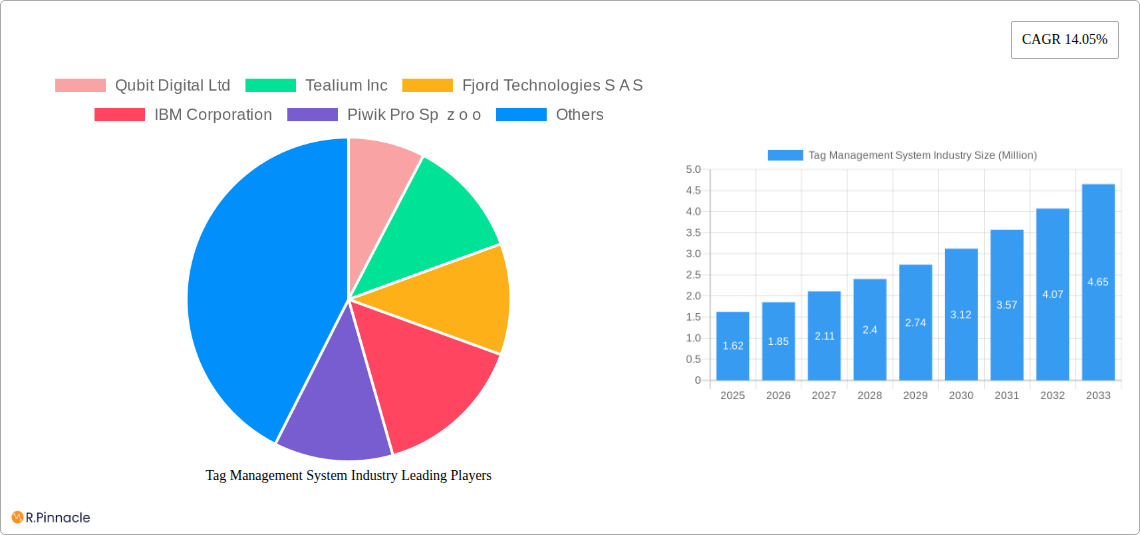
Tag Management System Industry Market Size (In Million)
The industry's expansion is also shaped by evolving trends such as the rise of server-side tagging, which enhances data accuracy and privacy, and the increasing sophistication of consent management platforms integrated within TMS. These advancements address growing privacy regulations and user concerns. However, certain restraints, such as the initial implementation costs and the technical expertise required for optimal utilization, could pose challenges. The market is segmented across Cloud and On-premises deployment types, with Campaign Management, Content Management, and Compliance Management being key applications. The BFSI, Retail & E-commerce, and Healthcare sectors are leading the adoption, reflecting their significant digital footprints. Leading companies like Adobe Inc., Google Inc., and Oracle Corporation are actively shaping the competitive landscape through innovation and strategic acquisitions, pushing the boundaries of what TMS solutions can achieve.
Tag Management System Industry Company Market Share
Dive deep into the rapidly evolving Tag Management System (TMS) industry with this comprehensive market analysis. Covering the historical period of 2019–2024 and projecting growth through 2033, this report provides actionable insights for industry professionals, marketers, and strategists. With a base year of 2025 and an estimated year also of 2025, the forecast period of 2025–2033 offers a clear roadmap for understanding market dynamics, key players, and future opportunities. Discover how leading companies like Adobe Inc., Google Inc., Oracle Corporation, and IBM Corporation are shaping the landscape of digital data governance and customer experience.
Tag Management System Industry Market Structure & Innovation Trends
The Tag Management System (TMS) industry exhibits a moderate to high level of market concentration, driven by the dominance of a few key players who hold significant market share, estimated to be over 70% combined. Innovation is a critical driver, fueled by the escalating need for data privacy compliance, personalized customer experiences, and efficient marketing campaign management. Regulatory frameworks such as GDPR and CCPA are compelling organizations to adopt robust TMS solutions for data consent management and PII protection, fostering innovation in compliance-focused features. Product substitutes, while existing in manual tagging methods or fragmented analytics platforms, are increasingly being outpaced by the efficiency and scalability offered by dedicated TMS solutions. End-user demographics are broadening, with BFSI, Retail & E-commerce, and Healthcare sectors leading adoption, showcasing a growing reliance on TMS for critical data operations. Merger and acquisition (M&A) activities remain dynamic, with deal values in the range of XX Million to XX Million, as larger players aim to consolidate market share and acquire innovative technologies.
- Key Innovation Drivers:
- Data Privacy Regulations (GDPR, CCPA)
- Personalization and Customer Experience Enhancement
- Real-time Data Analytics and Activation
- Automation of Tag Deployment and Management
- Market Concentration: Dominated by a few key players, with significant market share held by established technology giants.
- M&A Activity: Consistent, driven by strategic consolidation and technology acquisition.
Tag Management System Industry Market Dynamics & Trends
The Tag Management System (TMS) industry is poised for robust growth, propelled by a confluence of powerful market dynamics and evolving technological trends. The Compound Annual Growth Rate (CAGR) is projected to be XX%, reflecting a healthy expansion driven by increasing digital transformation initiatives across all sectors. Market penetration is rapidly advancing, moving from early adopters to mainstream adoption as businesses recognize the indispensable role of TMS in managing their digital footprints. The core growth drivers include the escalating volume of online data, the imperative for real-time analytics to inform business decisions, and the growing demand for personalized customer journeys. Technological disruptions, such as the advancement of AI and machine learning for automated tag optimization and predictive analytics, are further accelerating market adoption. Consumer preferences are increasingly geared towards privacy-conscious brands, pushing companies to implement transparent data handling practices, which TMS solutions facilitate. The competitive landscape is characterized by intense innovation, with players constantly differentiating themselves through enhanced feature sets, superior integrations, and specialized solutions for niche industries. The shift from on-premises to cloud-based TMS deployments continues to gain momentum, offering scalability, flexibility, and cost-effectiveness. Furthermore, the increasing complexity of the digital marketing technology stack necessitates a centralized platform like TMS for efficient management and coordination. The need for unified data governance and a single source of truth for customer data is also a significant catalyst for TMS adoption. As businesses grapple with evolving cookie policies and the rise of first-party data strategies, TMS platforms are becoming instrumental in enabling these transitions. The focus on data quality and integrity further amplifies the demand for TMS solutions that can ensure accurate data collection and consistent implementation across various digital touchpoints.
Dominant Regions & Segments in Tag Management System Industry
North America currently leads the Tag Management System (TMS) industry, with the United States spearheading adoption due to its mature digital ecosystem, high concentration of global technology companies, and proactive stance on data privacy regulations. The region benefits from robust economic policies that encourage technological investment and a well-established digital infrastructure that supports seamless TMS deployment. Europe follows closely, driven by the stringent GDPR regulations that mandate comprehensive data governance and consent management, compelling businesses to invest heavily in TMS solutions.
Deployment Type Dominance:
- Cloud: The cloud deployment model dominates the TMS market, offering unparalleled scalability, flexibility, and cost-efficiency. Organizations increasingly prefer cloud solutions for their ability to adapt to fluctuating data needs and facilitate remote access for global teams. The ease of integration with other cloud-based marketing and analytics tools further solidifies its position.
- On-premises: While still relevant for highly regulated industries with specific data residency requirements, the on-premises segment is experiencing a slower growth trajectory compared to cloud deployments.
Application Dominance:
- Campaign Management: This segment holds a significant share due to the critical role of TMS in accurately tracking campaign performance, optimizing ad spend, and personalizing marketing messages. The ability to deploy and manage tags for A/B testing and conversion tracking is paramount for campaign success.
- Content Management: TMS plays a vital role in optimizing website content through tag-based analytics, enabling personalization and performance tracking of various content elements.
- Compliance Management: With increasing regulatory scrutiny, this segment is witnessing substantial growth. TMS solutions are instrumental in managing user consent, tracking data usage, and ensuring adherence to privacy policies, making them indispensable for data governance.
- Other Applications: Encompasses a broad range of uses, including analytics, personalization, and A/B testing, further highlighting the versatility of TMS.
End-User Dominance:
- Retail & E-commerce: This sector leads in TMS adoption due to its direct reliance on customer data for driving sales, personalizing shopping experiences, and optimizing conversion funnels. The ability to track customer behavior across the entire purchase journey is crucial.
- BFSI (Banking, Financial Services, and Insurance): Driven by the need for robust data security, compliance with financial regulations, and personalized customer offerings, the BFSI sector is a significant adopter.
- Healthcare: Increasing adoption in healthcare is fueled by the need for secure patient data management, compliance with HIPAA, and personalized patient engagement strategies.
- Manufacturing: Emerging as a growing segment as manufacturers leverage IoT data and digital transformation to optimize operations and customer interactions.
Tag Management System Industry Product Innovations
Product innovation in the Tag Management System (TMS) industry is centered on enhancing data accuracy, improving user experience, and bolstering privacy compliance. Leading companies are integrating AI and machine learning to automate tag deployment, optimize tag performance, and provide predictive analytics. Advanced features include real-time data governance, server-side tagging for enhanced speed and accuracy, and seamless integration with a growing ecosystem of marketing and analytics platforms. Competitive advantages are being gained through robust consent management capabilities, advanced data layer management, and specialized solutions catering to the unique needs of industries like healthcare and BFSI, ensuring market fit and customer retention.
Report Scope & Segmentation Analysis
This report provides an in-depth analysis of the Tag Management System (TMS) industry, segmented across key dimensions to offer a granular understanding of market dynamics. The segmentation covers Deployment Type (Cloud and On-premises), Application (Campaign Management, Content Management, Compliance Management, and Other Applications), and End-User (BFSI, Retail & E-commerce, Healthcare, Manufacturing, and Other End-Users). Each segment is analyzed for its market size, growth projections, and competitive dynamics, providing a holistic view of the industry's landscape and future potential.
- Deployment Type: Cloud segment is projected to dominate with XX% market share, driven by scalability and flexibility, while On-premises will hold XX%.
- Application: Campaign Management is expected to lead with XX% market share, followed by Compliance Management at XX%, owing to increasing regulatory demands.
- End-User: Retail & E-commerce will continue to be the largest segment with XX% market share, followed by BFSI at XX%.
Key Drivers of Tag Management System Industry Growth
The Tag Management System (TMS) industry's growth is propelled by several key factors. The escalating demand for personalized customer experiences necessitates granular data collection and analysis, which TMS platforms facilitate. The increasing stringency of global data privacy regulations, such as GDPR and CCPA, mandates robust consent management and data governance, making TMS solutions indispensable. Furthermore, the burgeoning adoption of digital marketing strategies and the need for real-time performance analytics are driving the adoption of TMS for efficient campaign management and optimization. The rise of the MarTech landscape, with its complex array of tools, also highlights the need for a unified platform like TMS to streamline operations.
Challenges in the Tag Management System Industry Sector
Despite its growth, the Tag Management System (TMS) industry faces several challenges. The evolving landscape of third-party cookie deprecation presents a significant hurdle, pushing organizations to find new strategies for data collection and personalization, often requiring more sophisticated TMS capabilities. Ensuring seamless integration with diverse and often legacy systems can be complex and time-consuming. The growing concern around data privacy and security, while a driver for adoption, also demands continuous investment in robust security features and compliance protocols. Intense competition and pricing pressures within the market can also impact profitability for vendors. Moreover, the need for skilled personnel to effectively manage and leverage TMS platforms can be a bottleneck for some organizations.
Emerging Opportunities in Tag Management System Industry
The Tag Management System (TMS) industry is ripe with emerging opportunities. The increasing focus on first-party data strategies, driven by cookie deprecation, presents a significant avenue for TMS vendors to offer solutions that help businesses collect, manage, and activate their own customer data. The growing adoption of server-side tagging offers opportunities for enhanced performance, security, and data accuracy. Furthermore, the expansion of TMS into new verticals, such as IoT data management and the metaverse, opens up novel revenue streams. The demand for AI-powered analytics and predictive capabilities within TMS platforms is also a significant growth area, allowing businesses to derive deeper insights from their data.
Leading Players in the Tag Management System Industry Market
- Qubit Digital Ltd
- Tealium Inc
- Fjord Technologies S A S
- IBM Corporation
- Piwik Pro Sp z o o
- Yottaa Inc
- Hub'Scan Inc
- Datalicious Pty Ltd
- Adobe Inc
- Oracle Corporation
- OpenX Software Ltd
- Ensighten Inc
- Google Inc
- Signal Group Inc
Key Developments in Tag Management System Industry Industry
- September 2023: Atlan launched Tag Management, a new way for data teams to manage data access across the modern data stack. Tags are essential metadata that can be assigned to data assets to monitor sensitive data for discovery, compliance, and protection use cases. With the launch of Tag Management, Atlan enables bi-directional tag movement in and out of Atlan. This means data teams can start using Atlan as the control plane for tags, ensuring that data assets in Atlan are tagged and protected everywhere in the data ecosystem.
- March 2022: Mouse Flow and Google Tag jointly developed Tag Management Software for E-commerce companies, where users can integrate the shopping cart value into a Mouseflow recording variable to monitor further the value of conversions and the possible loss of sales. This will enable the retailer to fix the problems that are costing money.
Future Outlook for Tag Management System Industry Market
The future outlook for the Tag Management System (TMS) industry is exceptionally bright, characterized by continuous innovation and expanding market penetration. The ongoing shift towards privacy-centric data management and the increasing reliance on first-party data will solidify the indispensable role of TMS. Expect to see advanced AI and machine learning capabilities driving hyper-personalization and predictive analytics. Server-side tagging will become the norm, offering enhanced performance and data control. The integration of TMS with emerging technologies like the metaverse and IoT will unlock new avenues for data collection and analysis. Strategic partnerships and acquisitions will continue to shape the competitive landscape, with a focus on comprehensive data governance and customer experience solutions. The market is projected to witness sustained double-digit growth, driven by digital transformation initiatives across all sectors.
Tag Management System Industry Segmentation
-
1. Deployment Type
- 1.1. Cloud
- 1.2. On-premises
-
2. Application
- 2.1. Campaign Management
- 2.2. Content Management
- 2.3. Compliance Management
- 2.4. Other Applications
-
3. End-User
- 3.1. BFSI
- 3.2. Retail & E-commerce
- 3.3. Healthcare
- 3.4. Manufacturing
- 3.5. Other End-Users
Tag Management System Industry Segmentation By Geography
-
1. North America
- 1.1. United States
- 1.2. Canada
-
2. Europe
- 2.1. United Kingdom
- 2.2. Germany
- 2.3. France
- 2.4. Rest of Europe
-
3. Asia Pacific
- 3.1. Japan
- 3.2. India
- 3.3. Rest of Asia Pacific
-
4. Latin America
- 4.1. Mexico
- 4.2. Brazil
- 4.3. Rest of Latin America
- 5. Middle East
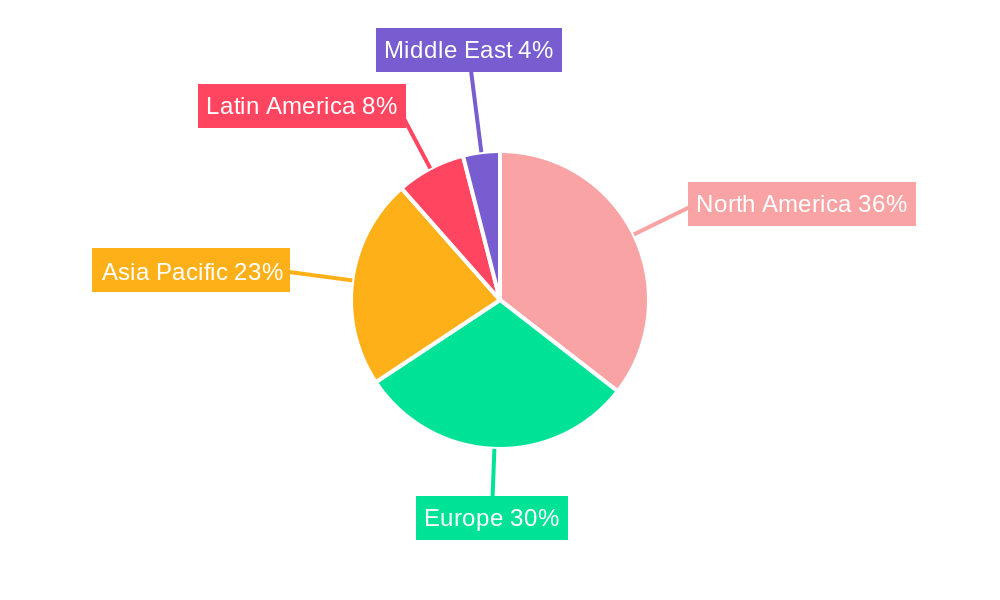
Tag Management System Industry Regional Market Share
Geographic Coverage of Tag Management System Industry
Tag Management System Industry REPORT HIGHLIGHTS
| Aspects | Details |
|---|---|
| Study Period | 2020-2034 |
| Base Year | 2025 |
| Estimated Year | 2026 |
| Forecast Period | 2026-2034 |
| Historical Period | 2020-2025 |
| Growth Rate | CAGR of 14.05% from 2020-2034 |
| Segmentation |
|
Table of Contents
- 1. Introduction
- 1.1. Research Scope
- 1.2. Market Segmentation
- 1.3. Research Objective
- 1.4. Definitions and Assumptions
- 2. Executive Summary
- 2.1. Market Snapshot
- 3. Market Dynamics
- 3.1. Market Drivers
- 3.2. Market Restrains
- 3.3. Market Trends
- 3.4. Market Opportunities
- 4. Market Factor Analysis
- 4.1. Porters Five Forces
- 4.1.1. Bargaining Power of Suppliers
- 4.1.2. Bargaining Power of Buyers
- 4.1.3. Threat of New Entrants
- 4.1.4. Threat of Substitutes
- 4.1.5. Competitive Rivalry
- 4.2. PESTEL analysis
- 4.3. BCG Analysis
- 4.3.1. Stars (High Growth, High Market Share)
- 4.3.2. Cash Cows (Low Growth, High Market Share)
- 4.3.3. Question Mark (High Growth, Low Market Share)
- 4.3.4. Dogs (Low Growth, Low Market Share)
- 4.4. Ansoff Matrix Analysis
- 4.5. Supply Chain Analysis
- 4.6. Regulatory Landscape
- 4.7. Current Market Potential and Opportunity Assessment (TAM–SAM–SOM Framework)
- 4.8. PRI Analyst Note
- 4.1. Porters Five Forces
- 5. Market Analysis, Insights and Forecast 2021-2033
- 5.1. Market Analysis, Insights and Forecast - by Deployment Type
- 5.1.1. Cloud
- 5.1.2. On-premises
- 5.2. Market Analysis, Insights and Forecast - by Application
- 5.2.1. Campaign Management
- 5.2.2. Content Management
- 5.2.3. Compliance Management
- 5.2.4. Other Applications
- 5.3. Market Analysis, Insights and Forecast - by End-User
- 5.3.1. BFSI
- 5.3.2. Retail & E-commerce
- 5.3.3. Healthcare
- 5.3.4. Manufacturing
- 5.3.5. Other End-Users
- 5.4. Market Analysis, Insights and Forecast - by Region
- 5.4.1. North America
- 5.4.2. Europe
- 5.4.3. Asia Pacific
- 5.4.4. Latin America
- 5.4.5. Middle East
- 5.1. Market Analysis, Insights and Forecast - by Deployment Type
- 6. Global Tag Management System Industry Analysis, Insights and Forecast, 2021-2033
- 6.1. Market Analysis, Insights and Forecast - by Deployment Type
- 6.1.1. Cloud
- 6.1.2. On-premises
- 6.2. Market Analysis, Insights and Forecast - by Application
- 6.2.1. Campaign Management
- 6.2.2. Content Management
- 6.2.3. Compliance Management
- 6.2.4. Other Applications
- 6.3. Market Analysis, Insights and Forecast - by End-User
- 6.3.1. BFSI
- 6.3.2. Retail & E-commerce
- 6.3.3. Healthcare
- 6.3.4. Manufacturing
- 6.3.5. Other End-Users
- 6.1. Market Analysis, Insights and Forecast - by Deployment Type
- 7. North America Tag Management System Industry Analysis, Insights and Forecast, 2020-2032
- 7.1. Market Analysis, Insights and Forecast - by Deployment Type
- 7.1.1. Cloud
- 7.1.2. On-premises
- 7.2. Market Analysis, Insights and Forecast - by Application
- 7.2.1. Campaign Management
- 7.2.2. Content Management
- 7.2.3. Compliance Management
- 7.2.4. Other Applications
- 7.3. Market Analysis, Insights and Forecast - by End-User
- 7.3.1. BFSI
- 7.3.2. Retail & E-commerce
- 7.3.3. Healthcare
- 7.3.4. Manufacturing
- 7.3.5. Other End-Users
- 7.1. Market Analysis, Insights and Forecast - by Deployment Type
- 8. Europe Tag Management System Industry Analysis, Insights and Forecast, 2020-2032
- 8.1. Market Analysis, Insights and Forecast - by Deployment Type
- 8.1.1. Cloud
- 8.1.2. On-premises
- 8.2. Market Analysis, Insights and Forecast - by Application
- 8.2.1. Campaign Management
- 8.2.2. Content Management
- 8.2.3. Compliance Management
- 8.2.4. Other Applications
- 8.3. Market Analysis, Insights and Forecast - by End-User
- 8.3.1. BFSI
- 8.3.2. Retail & E-commerce
- 8.3.3. Healthcare
- 8.3.4. Manufacturing
- 8.3.5. Other End-Users
- 8.1. Market Analysis, Insights and Forecast - by Deployment Type
- 9. Asia Pacific Tag Management System Industry Analysis, Insights and Forecast, 2020-2032
- 9.1. Market Analysis, Insights and Forecast - by Deployment Type
- 9.1.1. Cloud
- 9.1.2. On-premises
- 9.2. Market Analysis, Insights and Forecast - by Application
- 9.2.1. Campaign Management
- 9.2.2. Content Management
- 9.2.3. Compliance Management
- 9.2.4. Other Applications
- 9.3. Market Analysis, Insights and Forecast - by End-User
- 9.3.1. BFSI
- 9.3.2. Retail & E-commerce
- 9.3.3. Healthcare
- 9.3.4. Manufacturing
- 9.3.5. Other End-Users
- 9.1. Market Analysis, Insights and Forecast - by Deployment Type
- 10. Latin America Tag Management System Industry Analysis, Insights and Forecast, 2020-2032
- 10.1. Market Analysis, Insights and Forecast - by Deployment Type
- 10.1.1. Cloud
- 10.1.2. On-premises
- 10.2. Market Analysis, Insights and Forecast - by Application
- 10.2.1. Campaign Management
- 10.2.2. Content Management
- 10.2.3. Compliance Management
- 10.2.4. Other Applications
- 10.3. Market Analysis, Insights and Forecast - by End-User
- 10.3.1. BFSI
- 10.3.2. Retail & E-commerce
- 10.3.3. Healthcare
- 10.3.4. Manufacturing
- 10.3.5. Other End-Users
- 10.1. Market Analysis, Insights and Forecast - by Deployment Type
- 11. Middle East Tag Management System Industry Analysis, Insights and Forecast, 2020-2032
- 11.1. Market Analysis, Insights and Forecast - by Deployment Type
- 11.1.1. Cloud
- 11.1.2. On-premises
- 11.2. Market Analysis, Insights and Forecast - by Application
- 11.2.1. Campaign Management
- 11.2.2. Content Management
- 11.2.3. Compliance Management
- 11.2.4. Other Applications
- 11.3. Market Analysis, Insights and Forecast - by End-User
- 11.3.1. BFSI
- 11.3.2. Retail & E-commerce
- 11.3.3. Healthcare
- 11.3.4. Manufacturing
- 11.3.5. Other End-Users
- 11.1. Market Analysis, Insights and Forecast - by Deployment Type
- 12. Competitive Analysis
- 12.1. Company Profiles
- 12.1.1 Qubit Digital Ltd
- 12.1.1.1. Company Overview
- 12.1.1.2. Products
- 12.1.1.3. Company Financials
- 12.1.1.4. SWOT Analysis
- 12.1.2 Tealium Inc
- 12.1.2.1. Company Overview
- 12.1.2.2. Products
- 12.1.2.3. Company Financials
- 12.1.2.4. SWOT Analysis
- 12.1.3 Fjord Technologies S A S
- 12.1.3.1. Company Overview
- 12.1.3.2. Products
- 12.1.3.3. Company Financials
- 12.1.3.4. SWOT Analysis
- 12.1.4 IBM Corporation
- 12.1.4.1. Company Overview
- 12.1.4.2. Products
- 12.1.4.3. Company Financials
- 12.1.4.4. SWOT Analysis
- 12.1.5 Piwik Pro Sp z o o
- 12.1.5.1. Company Overview
- 12.1.5.2. Products
- 12.1.5.3. Company Financials
- 12.1.5.4. SWOT Analysis
- 12.1.6 Yottaa Inc
- 12.1.6.1. Company Overview
- 12.1.6.2. Products
- 12.1.6.3. Company Financials
- 12.1.6.4. SWOT Analysis
- 12.1.7 Hub'Scan Inc
- 12.1.7.1. Company Overview
- 12.1.7.2. Products
- 12.1.7.3. Company Financials
- 12.1.7.4. SWOT Analysis
- 12.1.8 Datalicious Pty Ltd
- 12.1.8.1. Company Overview
- 12.1.8.2. Products
- 12.1.8.3. Company Financials
- 12.1.8.4. SWOT Analysis
- 12.1.9 Adobe Inc
- 12.1.9.1. Company Overview
- 12.1.9.2. Products
- 12.1.9.3. Company Financials
- 12.1.9.4. SWOT Analysis
- 12.1.10 Oracle Corporation
- 12.1.10.1. Company Overview
- 12.1.10.2. Products
- 12.1.10.3. Company Financials
- 12.1.10.4. SWOT Analysis
- 12.1.11 OpenX Software Ltd
- 12.1.11.1. Company Overview
- 12.1.11.2. Products
- 12.1.11.3. Company Financials
- 12.1.11.4. SWOT Analysis
- 12.1.12 Ensighten Inc
- 12.1.12.1. Company Overview
- 12.1.12.2. Products
- 12.1.12.3. Company Financials
- 12.1.12.4. SWOT Analysis
- 12.1.13 Google Inc
- 12.1.13.1. Company Overview
- 12.1.13.2. Products
- 12.1.13.3. Company Financials
- 12.1.13.4. SWOT Analysis
- 12.1.14 Signal Group Inc
- 12.1.14.1. Company Overview
- 12.1.14.2. Products
- 12.1.14.3. Company Financials
- 12.1.14.4. SWOT Analysis
- 12.1.1 Qubit Digital Ltd
- 12.2. Market Entropy
- 12.2.1 Company's Key Areas Served
- 12.2.2 Recent Developments
- 12.3. Company Market Share Analysis 2025
- 12.3.1 Top 5 Companies Market Share Analysis
- 12.3.2 Top 3 Companies Market Share Analysis
- 12.4. List of Potential Customers
- 13. Research Methodology
List of Figures
- Figure 1: Global Tag Management System Industry Revenue Breakdown (Million, %) by Region 2025 & 2033
- Figure 2: Global Tag Management System Industry Volume Breakdown (K Unit, %) by Region 2025 & 2033
- Figure 3: North America Tag Management System Industry Revenue (Million), by Deployment Type 2025 & 2033
- Figure 4: North America Tag Management System Industry Volume (K Unit), by Deployment Type 2025 & 2033
- Figure 5: North America Tag Management System Industry Revenue Share (%), by Deployment Type 2025 & 2033
- Figure 6: North America Tag Management System Industry Volume Share (%), by Deployment Type 2025 & 2033
- Figure 7: North America Tag Management System Industry Revenue (Million), by Application 2025 & 2033
- Figure 8: North America Tag Management System Industry Volume (K Unit), by Application 2025 & 2033
- Figure 9: North America Tag Management System Industry Revenue Share (%), by Application 2025 & 2033
- Figure 10: North America Tag Management System Industry Volume Share (%), by Application 2025 & 2033
- Figure 11: North America Tag Management System Industry Revenue (Million), by End-User 2025 & 2033
- Figure 12: North America Tag Management System Industry Volume (K Unit), by End-User 2025 & 2033
- Figure 13: North America Tag Management System Industry Revenue Share (%), by End-User 2025 & 2033
- Figure 14: North America Tag Management System Industry Volume Share (%), by End-User 2025 & 2033
- Figure 15: North America Tag Management System Industry Revenue (Million), by Country 2025 & 2033
- Figure 16: North America Tag Management System Industry Volume (K Unit), by Country 2025 & 2033
- Figure 17: North America Tag Management System Industry Revenue Share (%), by Country 2025 & 2033
- Figure 18: North America Tag Management System Industry Volume Share (%), by Country 2025 & 2033
- Figure 19: Europe Tag Management System Industry Revenue (Million), by Deployment Type 2025 & 2033
- Figure 20: Europe Tag Management System Industry Volume (K Unit), by Deployment Type 2025 & 2033
- Figure 21: Europe Tag Management System Industry Revenue Share (%), by Deployment Type 2025 & 2033
- Figure 22: Europe Tag Management System Industry Volume Share (%), by Deployment Type 2025 & 2033
- Figure 23: Europe Tag Management System Industry Revenue (Million), by Application 2025 & 2033
- Figure 24: Europe Tag Management System Industry Volume (K Unit), by Application 2025 & 2033
- Figure 25: Europe Tag Management System Industry Revenue Share (%), by Application 2025 & 2033
- Figure 26: Europe Tag Management System Industry Volume Share (%), by Application 2025 & 2033
- Figure 27: Europe Tag Management System Industry Revenue (Million), by End-User 2025 & 2033
- Figure 28: Europe Tag Management System Industry Volume (K Unit), by End-User 2025 & 2033
- Figure 29: Europe Tag Management System Industry Revenue Share (%), by End-User 2025 & 2033
- Figure 30: Europe Tag Management System Industry Volume Share (%), by End-User 2025 & 2033
- Figure 31: Europe Tag Management System Industry Revenue (Million), by Country 2025 & 2033
- Figure 32: Europe Tag Management System Industry Volume (K Unit), by Country 2025 & 2033
- Figure 33: Europe Tag Management System Industry Revenue Share (%), by Country 2025 & 2033
- Figure 34: Europe Tag Management System Industry Volume Share (%), by Country 2025 & 2033
- Figure 35: Asia Pacific Tag Management System Industry Revenue (Million), by Deployment Type 2025 & 2033
- Figure 36: Asia Pacific Tag Management System Industry Volume (K Unit), by Deployment Type 2025 & 2033
- Figure 37: Asia Pacific Tag Management System Industry Revenue Share (%), by Deployment Type 2025 & 2033
- Figure 38: Asia Pacific Tag Management System Industry Volume Share (%), by Deployment Type 2025 & 2033
- Figure 39: Asia Pacific Tag Management System Industry Revenue (Million), by Application 2025 & 2033
- Figure 40: Asia Pacific Tag Management System Industry Volume (K Unit), by Application 2025 & 2033
- Figure 41: Asia Pacific Tag Management System Industry Revenue Share (%), by Application 2025 & 2033
- Figure 42: Asia Pacific Tag Management System Industry Volume Share (%), by Application 2025 & 2033
- Figure 43: Asia Pacific Tag Management System Industry Revenue (Million), by End-User 2025 & 2033
- Figure 44: Asia Pacific Tag Management System Industry Volume (K Unit), by End-User 2025 & 2033
- Figure 45: Asia Pacific Tag Management System Industry Revenue Share (%), by End-User 2025 & 2033
- Figure 46: Asia Pacific Tag Management System Industry Volume Share (%), by End-User 2025 & 2033
- Figure 47: Asia Pacific Tag Management System Industry Revenue (Million), by Country 2025 & 2033
- Figure 48: Asia Pacific Tag Management System Industry Volume (K Unit), by Country 2025 & 2033
- Figure 49: Asia Pacific Tag Management System Industry Revenue Share (%), by Country 2025 & 2033
- Figure 50: Asia Pacific Tag Management System Industry Volume Share (%), by Country 2025 & 2033
- Figure 51: Latin America Tag Management System Industry Revenue (Million), by Deployment Type 2025 & 2033
- Figure 52: Latin America Tag Management System Industry Volume (K Unit), by Deployment Type 2025 & 2033
- Figure 53: Latin America Tag Management System Industry Revenue Share (%), by Deployment Type 2025 & 2033
- Figure 54: Latin America Tag Management System Industry Volume Share (%), by Deployment Type 2025 & 2033
- Figure 55: Latin America Tag Management System Industry Revenue (Million), by Application 2025 & 2033
- Figure 56: Latin America Tag Management System Industry Volume (K Unit), by Application 2025 & 2033
- Figure 57: Latin America Tag Management System Industry Revenue Share (%), by Application 2025 & 2033
- Figure 58: Latin America Tag Management System Industry Volume Share (%), by Application 2025 & 2033
- Figure 59: Latin America Tag Management System Industry Revenue (Million), by End-User 2025 & 2033
- Figure 60: Latin America Tag Management System Industry Volume (K Unit), by End-User 2025 & 2033
- Figure 61: Latin America Tag Management System Industry Revenue Share (%), by End-User 2025 & 2033
- Figure 62: Latin America Tag Management System Industry Volume Share (%), by End-User 2025 & 2033
- Figure 63: Latin America Tag Management System Industry Revenue (Million), by Country 2025 & 2033
- Figure 64: Latin America Tag Management System Industry Volume (K Unit), by Country 2025 & 2033
- Figure 65: Latin America Tag Management System Industry Revenue Share (%), by Country 2025 & 2033
- Figure 66: Latin America Tag Management System Industry Volume Share (%), by Country 2025 & 2033
- Figure 67: Middle East Tag Management System Industry Revenue (Million), by Deployment Type 2025 & 2033
- Figure 68: Middle East Tag Management System Industry Volume (K Unit), by Deployment Type 2025 & 2033
- Figure 69: Middle East Tag Management System Industry Revenue Share (%), by Deployment Type 2025 & 2033
- Figure 70: Middle East Tag Management System Industry Volume Share (%), by Deployment Type 2025 & 2033
- Figure 71: Middle East Tag Management System Industry Revenue (Million), by Application 2025 & 2033
- Figure 72: Middle East Tag Management System Industry Volume (K Unit), by Application 2025 & 2033
- Figure 73: Middle East Tag Management System Industry Revenue Share (%), by Application 2025 & 2033
- Figure 74: Middle East Tag Management System Industry Volume Share (%), by Application 2025 & 2033
- Figure 75: Middle East Tag Management System Industry Revenue (Million), by End-User 2025 & 2033
- Figure 76: Middle East Tag Management System Industry Volume (K Unit), by End-User 2025 & 2033
- Figure 77: Middle East Tag Management System Industry Revenue Share (%), by End-User 2025 & 2033
- Figure 78: Middle East Tag Management System Industry Volume Share (%), by End-User 2025 & 2033
- Figure 79: Middle East Tag Management System Industry Revenue (Million), by Country 2025 & 2033
- Figure 80: Middle East Tag Management System Industry Volume (K Unit), by Country 2025 & 2033
- Figure 81: Middle East Tag Management System Industry Revenue Share (%), by Country 2025 & 2033
- Figure 82: Middle East Tag Management System Industry Volume Share (%), by Country 2025 & 2033
List of Tables
- Table 1: Global Tag Management System Industry Revenue Million Forecast, by Deployment Type 2020 & 2033
- Table 2: Global Tag Management System Industry Volume K Unit Forecast, by Deployment Type 2020 & 2033
- Table 3: Global Tag Management System Industry Revenue Million Forecast, by Application 2020 & 2033
- Table 4: Global Tag Management System Industry Volume K Unit Forecast, by Application 2020 & 2033
- Table 5: Global Tag Management System Industry Revenue Million Forecast, by End-User 2020 & 2033
- Table 6: Global Tag Management System Industry Volume K Unit Forecast, by End-User 2020 & 2033
- Table 7: Global Tag Management System Industry Revenue Million Forecast, by Region 2020 & 2033
- Table 8: Global Tag Management System Industry Volume K Unit Forecast, by Region 2020 & 2033
- Table 9: Global Tag Management System Industry Revenue Million Forecast, by Deployment Type 2020 & 2033
- Table 10: Global Tag Management System Industry Volume K Unit Forecast, by Deployment Type 2020 & 2033
- Table 11: Global Tag Management System Industry Revenue Million Forecast, by Application 2020 & 2033
- Table 12: Global Tag Management System Industry Volume K Unit Forecast, by Application 2020 & 2033
- Table 13: Global Tag Management System Industry Revenue Million Forecast, by End-User 2020 & 2033
- Table 14: Global Tag Management System Industry Volume K Unit Forecast, by End-User 2020 & 2033
- Table 15: Global Tag Management System Industry Revenue Million Forecast, by Country 2020 & 2033
- Table 16: Global Tag Management System Industry Volume K Unit Forecast, by Country 2020 & 2033
- Table 17: United States Tag Management System Industry Revenue (Million) Forecast, by Application 2020 & 2033
- Table 18: United States Tag Management System Industry Volume (K Unit) Forecast, by Application 2020 & 2033
- Table 19: Canada Tag Management System Industry Revenue (Million) Forecast, by Application 2020 & 2033
- Table 20: Canada Tag Management System Industry Volume (K Unit) Forecast, by Application 2020 & 2033
- Table 21: Global Tag Management System Industry Revenue Million Forecast, by Deployment Type 2020 & 2033
- Table 22: Global Tag Management System Industry Volume K Unit Forecast, by Deployment Type 2020 & 2033
- Table 23: Global Tag Management System Industry Revenue Million Forecast, by Application 2020 & 2033
- Table 24: Global Tag Management System Industry Volume K Unit Forecast, by Application 2020 & 2033
- Table 25: Global Tag Management System Industry Revenue Million Forecast, by End-User 2020 & 2033
- Table 26: Global Tag Management System Industry Volume K Unit Forecast, by End-User 2020 & 2033
- Table 27: Global Tag Management System Industry Revenue Million Forecast, by Country 2020 & 2033
- Table 28: Global Tag Management System Industry Volume K Unit Forecast, by Country 2020 & 2033
- Table 29: United Kingdom Tag Management System Industry Revenue (Million) Forecast, by Application 2020 & 2033
- Table 30: United Kingdom Tag Management System Industry Volume (K Unit) Forecast, by Application 2020 & 2033
- Table 31: Germany Tag Management System Industry Revenue (Million) Forecast, by Application 2020 & 2033
- Table 32: Germany Tag Management System Industry Volume (K Unit) Forecast, by Application 2020 & 2033
- Table 33: France Tag Management System Industry Revenue (Million) Forecast, by Application 2020 & 2033
- Table 34: France Tag Management System Industry Volume (K Unit) Forecast, by Application 2020 & 2033
- Table 35: Rest of Europe Tag Management System Industry Revenue (Million) Forecast, by Application 2020 & 2033
- Table 36: Rest of Europe Tag Management System Industry Volume (K Unit) Forecast, by Application 2020 & 2033
- Table 37: Global Tag Management System Industry Revenue Million Forecast, by Deployment Type 2020 & 2033
- Table 38: Global Tag Management System Industry Volume K Unit Forecast, by Deployment Type 2020 & 2033
- Table 39: Global Tag Management System Industry Revenue Million Forecast, by Application 2020 & 2033
- Table 40: Global Tag Management System Industry Volume K Unit Forecast, by Application 2020 & 2033
- Table 41: Global Tag Management System Industry Revenue Million Forecast, by End-User 2020 & 2033
- Table 42: Global Tag Management System Industry Volume K Unit Forecast, by End-User 2020 & 2033
- Table 43: Global Tag Management System Industry Revenue Million Forecast, by Country 2020 & 2033
- Table 44: Global Tag Management System Industry Volume K Unit Forecast, by Country 2020 & 2033
- Table 45: Japan Tag Management System Industry Revenue (Million) Forecast, by Application 2020 & 2033
- Table 46: Japan Tag Management System Industry Volume (K Unit) Forecast, by Application 2020 & 2033
- Table 47: India Tag Management System Industry Revenue (Million) Forecast, by Application 2020 & 2033
- Table 48: India Tag Management System Industry Volume (K Unit) Forecast, by Application 2020 & 2033
- Table 49: Rest of Asia Pacific Tag Management System Industry Revenue (Million) Forecast, by Application 2020 & 2033
- Table 50: Rest of Asia Pacific Tag Management System Industry Volume (K Unit) Forecast, by Application 2020 & 2033
- Table 51: Global Tag Management System Industry Revenue Million Forecast, by Deployment Type 2020 & 2033
- Table 52: Global Tag Management System Industry Volume K Unit Forecast, by Deployment Type 2020 & 2033
- Table 53: Global Tag Management System Industry Revenue Million Forecast, by Application 2020 & 2033
- Table 54: Global Tag Management System Industry Volume K Unit Forecast, by Application 2020 & 2033
- Table 55: Global Tag Management System Industry Revenue Million Forecast, by End-User 2020 & 2033
- Table 56: Global Tag Management System Industry Volume K Unit Forecast, by End-User 2020 & 2033
- Table 57: Global Tag Management System Industry Revenue Million Forecast, by Country 2020 & 2033
- Table 58: Global Tag Management System Industry Volume K Unit Forecast, by Country 2020 & 2033
- Table 59: Mexico Tag Management System Industry Revenue (Million) Forecast, by Application 2020 & 2033
- Table 60: Mexico Tag Management System Industry Volume (K Unit) Forecast, by Application 2020 & 2033
- Table 61: Brazil Tag Management System Industry Revenue (Million) Forecast, by Application 2020 & 2033
- Table 62: Brazil Tag Management System Industry Volume (K Unit) Forecast, by Application 2020 & 2033
- Table 63: Rest of Latin America Tag Management System Industry Revenue (Million) Forecast, by Application 2020 & 2033
- Table 64: Rest of Latin America Tag Management System Industry Volume (K Unit) Forecast, by Application 2020 & 2033
- Table 65: Global Tag Management System Industry Revenue Million Forecast, by Deployment Type 2020 & 2033
- Table 66: Global Tag Management System Industry Volume K Unit Forecast, by Deployment Type 2020 & 2033
- Table 67: Global Tag Management System Industry Revenue Million Forecast, by Application 2020 & 2033
- Table 68: Global Tag Management System Industry Volume K Unit Forecast, by Application 2020 & 2033
- Table 69: Global Tag Management System Industry Revenue Million Forecast, by End-User 2020 & 2033
- Table 70: Global Tag Management System Industry Volume K Unit Forecast, by End-User 2020 & 2033
- Table 71: Global Tag Management System Industry Revenue Million Forecast, by Country 2020 & 2033
- Table 72: Global Tag Management System Industry Volume K Unit Forecast, by Country 2020 & 2033
Frequently Asked Questions
1. What is the projected Compound Annual Growth Rate (CAGR) of the Tag Management System Industry?
The projected CAGR is approximately 14.05%.
2. Which companies are prominent players in the Tag Management System Industry?
Key companies in the market include Qubit Digital Ltd, Tealium Inc, Fjord Technologies S A S, IBM Corporation, Piwik Pro Sp z o o, Yottaa Inc, Hub'Scan Inc, Datalicious Pty Ltd, Adobe Inc, Oracle Corporation, OpenX Software Ltd, Ensighten Inc, Google Inc, Signal Group Inc.
3. What are the main segments of the Tag Management System Industry?
The market segments include Deployment Type, Application, End-User.
4. Can you provide details about the market size?
The market size is estimated to be USD 1.62 Million as of 2022.
5. What are some drivers contributing to market growth?
User-friendly and Feature-packed Software; Better Customer Experience Deliverance; Ability to Build a Unified Ecosystem.
6. What are the notable trends driving market growth?
Tag Management Systems to Play a Significant Role in Retail and E-commerce Sector.
7. Are there any restraints impacting market growth?
High Initial Fee for Tag Management Systems.
8. Can you provide examples of recent developments in the market?
September 2023 : Atlan launched Tag Management, a new way for data teams to manage data access across the modern data stack. Tags are essential metadata that can be assigned to data assets to monitor sensitive data for discovery, compliance, and protection use cases. With the launch of Tag Management, Atlan enables bi-directional tag movement in and out of Atlan. This means data teams can start using Atlan as the control plane for tags, ensuring that data assets in Atlan are tagged and protected everywhere in the data ecosystem.
9. What pricing options are available for accessing the report?
Pricing options include single-user, multi-user, and enterprise licenses priced at USD 4750, USD 5250, and USD 8750 respectively.
10. Is the market size provided in terms of value or volume?
The market size is provided in terms of value, measured in Million and volume, measured in K Unit.
11. Are there any specific market keywords associated with the report?
Yes, the market keyword associated with the report is "Tag Management System Industry," which aids in identifying and referencing the specific market segment covered.
12. How do I determine which pricing option suits my needs best?
The pricing options vary based on user requirements and access needs. Individual users may opt for single-user licenses, while businesses requiring broader access may choose multi-user or enterprise licenses for cost-effective access to the report.
13. Are there any additional resources or data provided in the Tag Management System Industry report?
While the report offers comprehensive insights, it's advisable to review the specific contents or supplementary materials provided to ascertain if additional resources or data are available.
14. How can I stay updated on further developments or reports in the Tag Management System Industry?
To stay informed about further developments, trends, and reports in the Tag Management System Industry, consider subscribing to industry newsletters, following relevant companies and organizations, or regularly checking reputable industry news sources and publications.
Methodology
Step 1 - Identification of Relevant Samples Size from Population Database


Step 2 - Approaches for Defining Global Market Size (Value, Volume* & Price*)

Note*: In applicable scenarios
Step 3 - Data Sources
Primary Research
- Web Analytics
- Survey Reports
- Research Institute
- Latest Research Reports
- Opinion Leaders
Secondary Research
- Annual Reports
- White Paper
- Latest Press Release
- Industry Association
- Paid Database
- Investor Presentations

Step 4 - Data Triangulation
Involves using different sources of information in order to increase the validity of a study
These sources are likely to be stakeholders in a program - participants, other researchers, program staff, other community members, and so on.
Then we put all data in single framework & apply various statistical tools to find out the dynamic on the market.
During the analysis stage, feedback from the stakeholder groups would be compared to determine areas of agreement as well as areas of divergence