

Key Insights
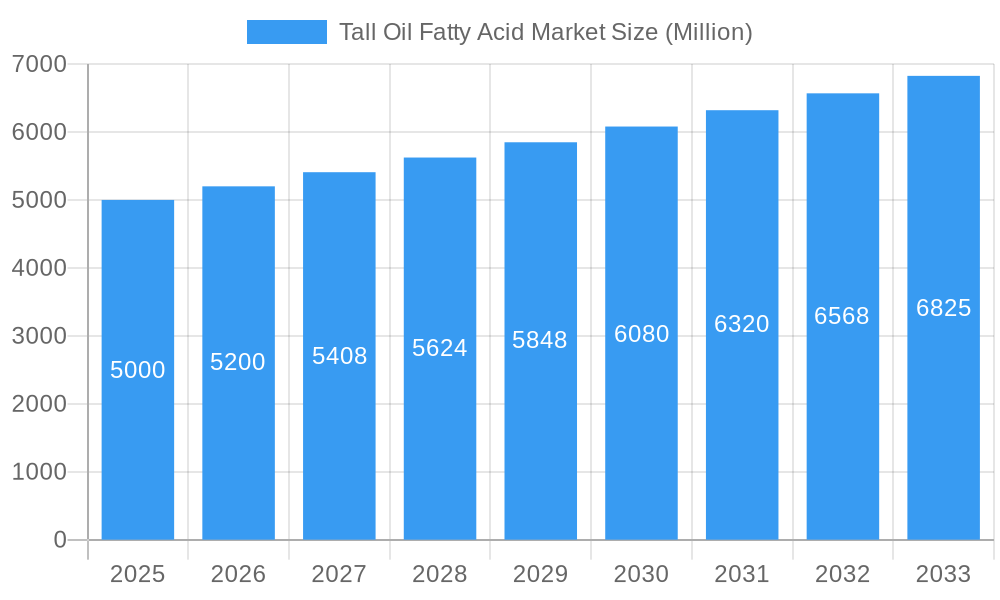
The Tall Oil Fatty Acid (TOFA) market is poised for significant expansion, driven by escalating demand across pivotal sectors including paints and coatings, soaps and detergents, and the dynamic bio-based chemicals industry. With a projected Compound Annual Growth Rate (CAGR) of 4.66%, the market is anticipated to reach a substantial size of 4.82 million by the base year 2025. Key growth catalysts include the increasing adoption of sustainable and renewable resources, substituting conventional petroleum-based alternatives. This trend is reinforced by increasingly stringent environmental regulations and heightened consumer preference for eco-friendly products. TOFA's inherent versatility across numerous applications further fuels its market penetration. The market is segmented by product type (Oleic Acid, Linoleic Acid, Linolenic Acid, Palmitic Acid, and Others), application (Alkyd Resins, Dimer Acids, Fatty Acid Esters, and Others), and end-user industry (Soaps and Detergents, Paints and Coatings, Automotive, Metal Working Fluids, Oil and Gas, and Others). Geographically, North America, Europe, and Asia-Pacific are identified as key markets, each demonstrating distinct growth trajectories influenced by industrial advancement and regulatory frameworks.
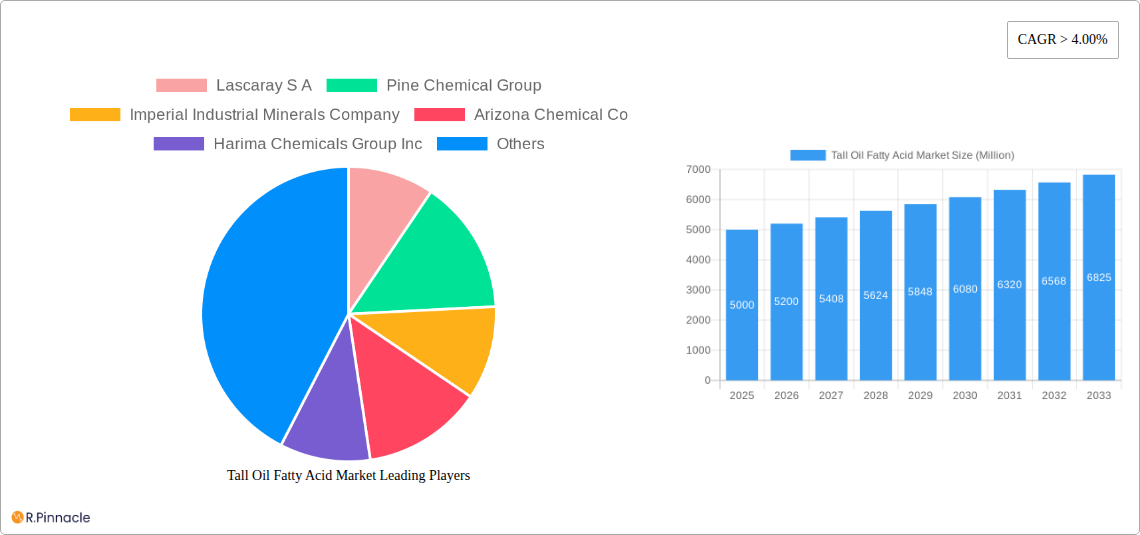
Tall Oil Fatty Acid Market Market Size (In Million)
The competitive environment features a blend of established multinational corporations and agile regional enterprises. Industry leaders such as Eastman Chemical Company, Ingevity, and KRATON CORPORATION are capitalizing on their extensive distribution channels and advanced technological capabilities. Concurrently, smaller regional players are increasing their market share by concentrating on specialized applications and bespoke solutions. Sustained growth hinges on advancements in TOFA production technologies to enhance efficiency and lower costs, alongside the continuous exploration of novel applications to broaden market reach. The industry navigates challenges related to raw material price volatility and strict environmental mandates, necessitating the adoption of sustainable and cost-effective manufacturing processes. Despite these hurdles, the overall market outlook remains robust, reflecting the growing global demand for sustainable and renewable chemical solutions.
Tall Oil Fatty Acid Market Company Market Share
Unlock Growth Opportunities in the Booming Tall Oil Fatty Acid Market: A Comprehensive Report (2019-2033)
This in-depth report provides a comprehensive analysis of the Tall Oil Fatty Acid market, offering actionable insights for industry professionals seeking to navigate this dynamic landscape. With a detailed study period spanning 2019-2033 (Base Year: 2025, Estimated Year: 2025, Forecast Period: 2025-2033, Historical Period: 2019-2024), this report unveils key trends, growth drivers, and challenges shaping the future of the Tall Oil Fatty Acid market. The market is projected to reach xx Million by 2033, presenting significant opportunities for investment and growth.
Tall Oil Fatty Acid Market Market Structure & Innovation Trends
This section delves into the competitive landscape of the Tall Oil Fatty Acid market, analyzing market concentration, innovation drivers, regulatory frameworks, and M&A activities. We examine the market share held by key players such as Lascaray S A, Pine Chemical Group, Imperial Industrial Minerals Company, Arizona Chemical Co, Harima Chemicals Group Inc, Eastman Chemical Company, Ingevity, Segezha-Group, Forchem Oyj, Ilim Group, KRATON CORPORATION, UNIVAR SOLUTIONS, Shaxian Lixin Resin Co Ltd, Foreverest Resources Ltd, Pasand Speciality Chemicals, Ataman Kimya, and G C Rutteman & Co B V. The report quantifies market concentration using metrics like the Herfindahl-Hirschman Index (HHI) and analyzes the impact of recent mergers and acquisitions, including deal values and their influence on market share distribution. Furthermore, it assesses the role of regulatory frameworks, the presence of substitute products, and the demographic trends influencing end-user demand. The analysis includes a detailed examination of innovation drivers, such as advancements in production technologies and the development of new applications for Tall Oil Fatty Acids.
Tall Oil Fatty Acid Market Market Dynamics & Trends
This section provides a comprehensive overview of the market's dynamic forces, including market growth drivers, technological disruptions, consumer preferences, and competitive dynamics. We analyze the Compound Annual Growth Rate (CAGR) and market penetration rates for key segments. The report explores the impact of technological advancements on production efficiency, cost reduction, and the development of new product applications. It examines shifting consumer preferences, highlighting the growing demand for sustainable and environmentally friendly products. The competitive dynamics are analyzed, considering factors such as pricing strategies, product differentiation, and marketing initiatives employed by key players.
Dominant Regions & Segments in Tall Oil Fatty Acid Market
This section identifies the leading regions and segments within the Tall Oil Fatty Acid market, providing a detailed analysis of their dominance.
Product Type: The report analyzes the market share and growth potential of Oleic Acid, Linoleic Acid, Linolenic Acid, Palmitic Acid, and Other Product Types. The dominance of a particular product type is examined, considering factors such as production costs, application versatility, and market demand.
Application: A detailed analysis of Alkyd Resins, Dimer Acids, Fatty Acid Ester, and Other Applications segments is presented, highlighting their growth drivers and market share.
End-user Industry: The report examines the market share and growth drivers for Soaps and Detergents, Paints and Coatings, Automotive, Metal Working Fluids, Oil and Gas, and Other End-user Industries. The analysis includes an assessment of factors influencing growth within each end-user industry, including economic policies, infrastructure development, and technological advancements. The key factors driving the dominance of specific segments are meticulously explained.
Tall Oil Fatty Acid Market Product Innovations
This section summarizes recent product developments and innovations within the Tall Oil Fatty Acid market. It highlights the technological advancements driving these innovations, their competitive advantages, and their market fit. The focus is on the introduction of new products or modifications to existing products that offer enhanced performance, improved sustainability, or cost-effectiveness.
Report Scope & Segmentation Analysis
This report provides a comprehensive segmentation of the Tall Oil Fatty Acid market based on product type (Oleic Acid, Linoleic Acid, Linolenic Acid, Palmitic Acid, Other Product Types), application (Alkyd Resins, Dimer Acids, Fatty Acid Ester, Other Applications), and end-user industry (Soaps and Detergents, Paints and Coatings, Automotive, Metal Working Fluids, Oil and Gas, Other End-user Industries). Each segment's market size, growth projections, and competitive dynamics are analyzed in detail.
Key Drivers of Tall Oil Fatty Acid Market Growth
The growth of the Tall Oil Fatty Acid market is driven by a confluence of factors including increasing demand from key end-use industries (e.g., paints and coatings, soaps and detergents), advancements in production technologies leading to cost reductions, and the growing adoption of sustainable and bio-based alternatives. Government regulations promoting the use of renewable resources also contribute significantly to market growth.
Challenges in the Tall Oil Fatty Acid Market Sector
The Tall Oil Fatty Acid market faces challenges such as fluctuations in raw material prices, stringent environmental regulations, and intense competition among existing players. Supply chain disruptions and the rising costs associated with compliance can also significantly impact profitability.
Emerging Opportunities in Tall Oil Fatty Acid Market
Emerging opportunities lie in the development of novel applications for Tall Oil Fatty Acids, expanding into new geographic markets, and focusing on sustainable production practices. The growing demand for bio-based products presents a significant opportunity for market expansion.
Leading Players in the Tall Oil Fatty Acid Market Market
- Lascaray S A
- Pine Chemical Group
- Imperial Industrial Minerals Company
- Arizona Chemical Co
- Harima Chemicals Group Inc
- Eastman Chemical Company
- Ingevity
- Segezha-Group
- Forchem Oyj
- Ilim Group
- KRATON CORPORATION
- UNIVAR SOLUTIONS
- Shaxian Lixin Resin Co Ltd
- Foreverest Resources Ltd
- Pasand Speciality Chemicals
- Ataman Kimya
- G C Rutteman & Co B V
Key Developments in Tall Oil Fatty Acid Market Industry
- [Month, Year]: Company X launched a new bio-based Tall Oil Fatty Acid product.
- [Month, Year]: Company Y acquired Company Z, expanding its market share.
- [Month, Year]: New environmental regulations were implemented, impacting production processes. (Further details on specific developments and their impact will be included in the full report)
Future Outlook for Tall Oil Fatty Acid Market Market
The Tall Oil Fatty Acid market is poised for continued growth, driven by increasing demand from various end-use sectors and ongoing technological advancements. Strategic partnerships, investments in research and development, and expansion into new markets will be key to capturing future growth opportunities. The market is expected to witness a positive outlook, fueled by the growing preference for sustainable and bio-based products and innovations in applications.
Tall Oil Fatty Acid Market Segmentation
-
1. Product Type
- 1.1. Oleic Acid
- 1.2. Linoleic Acid
- 1.3. Linolenic Acid
- 1.4. Palmitic Acid
- 1.5. Other Product Types
-
2. Application
- 2.1. Alkyd Resins
- 2.2. Dimer Acids
- 2.3. Fatty Acid Ester
- 2.4. Other Applications
-
3. End-user Industry
- 3.1. Soaps and Detergents
- 3.2. Paints and Coatings
- 3.3. Automotive
- 3.4. Metal Working Fluids
- 3.5. Oil and Gas
- 3.6. Other End-user Industries
Tall Oil Fatty Acid Market Segmentation By Geography
-
1. Asia Pacific
- 1.1. China
- 1.2. India
- 1.3. Japan
- 1.4. South Korea
- 1.5. Rest of Asia Pacific
-
2. North America
- 2.1. United States
- 2.2. Canada
- 2.3. Mexico
-
3. Europe
- 3.1. Germany
- 3.2. United Kingdom
- 3.3. Italy
- 3.4. France
- 3.5. Rest of Europe
-
4. South America
- 4.1. Brazil
- 4.2. Argentina
- 4.3. Rest of South America
-
5. Middle East and Africa
- 5.1. Saudi Arabia
- 5.2. South Africa
- 5.3. Rest of Middle East and Africa
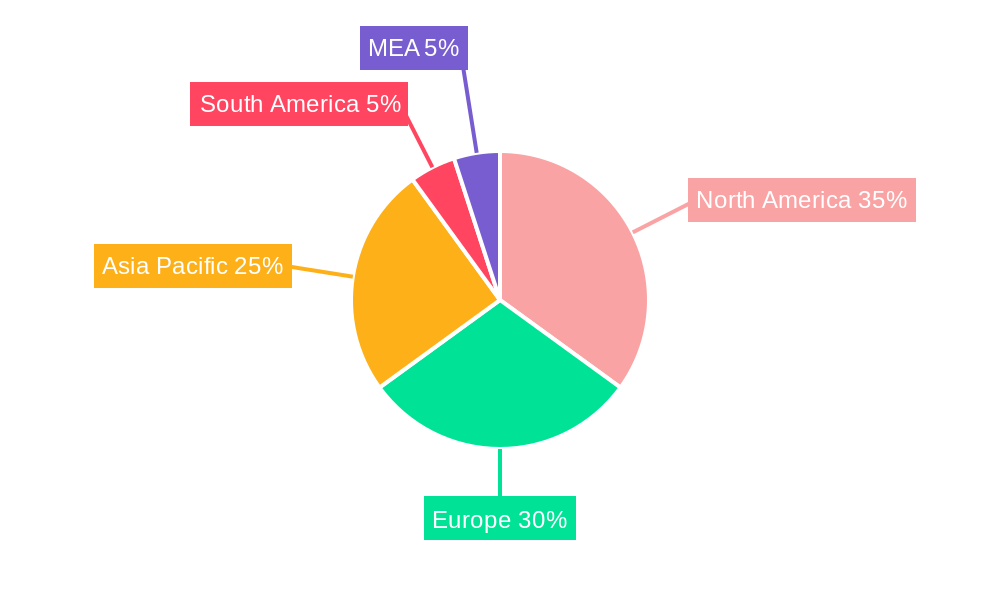
Tall Oil Fatty Acid Market Regional Market Share
Geographic Coverage of Tall Oil Fatty Acid Market
Tall Oil Fatty Acid Market REPORT HIGHLIGHTS
| Aspects | Details |
|---|---|
| Study Period | 2020-2034 |
| Base Year | 2025 |
| Estimated Year | 2026 |
| Forecast Period | 2026-2034 |
| Historical Period | 2020-2025 |
| Growth Rate | CAGR of 4.66% from 2020-2034 |
| Segmentation |
|
Table of Contents
- 1. Introduction
- 1.1. Research Scope
- 1.2. Market Segmentation
- 1.3. Research Objective
- 1.4. Definitions and Assumptions
- 2. Executive Summary
- 2.1. Market Snapshot
- 3. Market Dynamics
- 3.1. Market Drivers
- 3.2. Market Restrains
- 3.3. Market Trends
- 3.4. Market Opportunities
- 4. Market Factor Analysis
- 4.1. Porters Five Forces
- 4.1.1. Bargaining Power of Suppliers
- 4.1.2. Bargaining Power of Buyers
- 4.1.3. Threat of New Entrants
- 4.1.4. Threat of Substitutes
- 4.1.5. Competitive Rivalry
- 4.2. PESTEL analysis
- 4.3. BCG Analysis
- 4.3.1. Stars (High Growth, High Market Share)
- 4.3.2. Cash Cows (Low Growth, High Market Share)
- 4.3.3. Question Mark (High Growth, Low Market Share)
- 4.3.4. Dogs (Low Growth, Low Market Share)
- 4.4. Ansoff Matrix Analysis
- 4.5. Supply Chain Analysis
- 4.6. Regulatory Landscape
- 4.7. Current Market Potential and Opportunity Assessment (TAM–SAM–SOM Framework)
- 4.8. PRI Analyst Note
- 4.1. Porters Five Forces
- 5. Market Analysis, Insights and Forecast 2021-2033
- 5.1. Market Analysis, Insights and Forecast - by Product Type
- 5.1.1. Oleic Acid
- 5.1.2. Linoleic Acid
- 5.1.3. Linolenic Acid
- 5.1.4. Palmitic Acid
- 5.1.5. Other Product Types
- 5.2. Market Analysis, Insights and Forecast - by Application
- 5.2.1. Alkyd Resins
- 5.2.2. Dimer Acids
- 5.2.3. Fatty Acid Ester
- 5.2.4. Other Applications
- 5.3. Market Analysis, Insights and Forecast - by End-user Industry
- 5.3.1. Soaps and Detergents
- 5.3.2. Paints and Coatings
- 5.3.3. Automotive
- 5.3.4. Metal Working Fluids
- 5.3.5. Oil and Gas
- 5.3.6. Other End-user Industries
- 5.4. Market Analysis, Insights and Forecast - by Region
- 5.4.1. Asia Pacific
- 5.4.2. North America
- 5.4.3. Europe
- 5.4.4. South America
- 5.4.5. Middle East and Africa
- 5.1. Market Analysis, Insights and Forecast - by Product Type
- 6. Global Tall Oil Fatty Acid Market Analysis, Insights and Forecast, 2021-2033
- 6.1. Market Analysis, Insights and Forecast - by Product Type
- 6.1.1. Oleic Acid
- 6.1.2. Linoleic Acid
- 6.1.3. Linolenic Acid
- 6.1.4. Palmitic Acid
- 6.1.5. Other Product Types
- 6.2. Market Analysis, Insights and Forecast - by Application
- 6.2.1. Alkyd Resins
- 6.2.2. Dimer Acids
- 6.2.3. Fatty Acid Ester
- 6.2.4. Other Applications
- 6.3. Market Analysis, Insights and Forecast - by End-user Industry
- 6.3.1. Soaps and Detergents
- 6.3.2. Paints and Coatings
- 6.3.3. Automotive
- 6.3.4. Metal Working Fluids
- 6.3.5. Oil and Gas
- 6.3.6. Other End-user Industries
- 6.1. Market Analysis, Insights and Forecast - by Product Type
- 7. Asia Pacific Tall Oil Fatty Acid Market Analysis, Insights and Forecast, 2020-2032
- 7.1. Market Analysis, Insights and Forecast - by Product Type
- 7.1.1. Oleic Acid
- 7.1.2. Linoleic Acid
- 7.1.3. Linolenic Acid
- 7.1.4. Palmitic Acid
- 7.1.5. Other Product Types
- 7.2. Market Analysis, Insights and Forecast - by Application
- 7.2.1. Alkyd Resins
- 7.2.2. Dimer Acids
- 7.2.3. Fatty Acid Ester
- 7.2.4. Other Applications
- 7.3. Market Analysis, Insights and Forecast - by End-user Industry
- 7.3.1. Soaps and Detergents
- 7.3.2. Paints and Coatings
- 7.3.3. Automotive
- 7.3.4. Metal Working Fluids
- 7.3.5. Oil and Gas
- 7.3.6. Other End-user Industries
- 7.1. Market Analysis, Insights and Forecast - by Product Type
- 8. North America Tall Oil Fatty Acid Market Analysis, Insights and Forecast, 2020-2032
- 8.1. Market Analysis, Insights and Forecast - by Product Type
- 8.1.1. Oleic Acid
- 8.1.2. Linoleic Acid
- 8.1.3. Linolenic Acid
- 8.1.4. Palmitic Acid
- 8.1.5. Other Product Types
- 8.2. Market Analysis, Insights and Forecast - by Application
- 8.2.1. Alkyd Resins
- 8.2.2. Dimer Acids
- 8.2.3. Fatty Acid Ester
- 8.2.4. Other Applications
- 8.3. Market Analysis, Insights and Forecast - by End-user Industry
- 8.3.1. Soaps and Detergents
- 8.3.2. Paints and Coatings
- 8.3.3. Automotive
- 8.3.4. Metal Working Fluids
- 8.3.5. Oil and Gas
- 8.3.6. Other End-user Industries
- 8.1. Market Analysis, Insights and Forecast - by Product Type
- 9. Europe Tall Oil Fatty Acid Market Analysis, Insights and Forecast, 2020-2032
- 9.1. Market Analysis, Insights and Forecast - by Product Type
- 9.1.1. Oleic Acid
- 9.1.2. Linoleic Acid
- 9.1.3. Linolenic Acid
- 9.1.4. Palmitic Acid
- 9.1.5. Other Product Types
- 9.2. Market Analysis, Insights and Forecast - by Application
- 9.2.1. Alkyd Resins
- 9.2.2. Dimer Acids
- 9.2.3. Fatty Acid Ester
- 9.2.4. Other Applications
- 9.3. Market Analysis, Insights and Forecast - by End-user Industry
- 9.3.1. Soaps and Detergents
- 9.3.2. Paints and Coatings
- 9.3.3. Automotive
- 9.3.4. Metal Working Fluids
- 9.3.5. Oil and Gas
- 9.3.6. Other End-user Industries
- 9.1. Market Analysis, Insights and Forecast - by Product Type
- 10. South America Tall Oil Fatty Acid Market Analysis, Insights and Forecast, 2020-2032
- 10.1. Market Analysis, Insights and Forecast - by Product Type
- 10.1.1. Oleic Acid
- 10.1.2. Linoleic Acid
- 10.1.3. Linolenic Acid
- 10.1.4. Palmitic Acid
- 10.1.5. Other Product Types
- 10.2. Market Analysis, Insights and Forecast - by Application
- 10.2.1. Alkyd Resins
- 10.2.2. Dimer Acids
- 10.2.3. Fatty Acid Ester
- 10.2.4. Other Applications
- 10.3. Market Analysis, Insights and Forecast - by End-user Industry
- 10.3.1. Soaps and Detergents
- 10.3.2. Paints and Coatings
- 10.3.3. Automotive
- 10.3.4. Metal Working Fluids
- 10.3.5. Oil and Gas
- 10.3.6. Other End-user Industries
- 10.1. Market Analysis, Insights and Forecast - by Product Type
- 11. Middle East and Africa Tall Oil Fatty Acid Market Analysis, Insights and Forecast, 2020-2032
- 11.1. Market Analysis, Insights and Forecast - by Product Type
- 11.1.1. Oleic Acid
- 11.1.2. Linoleic Acid
- 11.1.3. Linolenic Acid
- 11.1.4. Palmitic Acid
- 11.1.5. Other Product Types
- 11.2. Market Analysis, Insights and Forecast - by Application
- 11.2.1. Alkyd Resins
- 11.2.2. Dimer Acids
- 11.2.3. Fatty Acid Ester
- 11.2.4. Other Applications
- 11.3. Market Analysis, Insights and Forecast - by End-user Industry
- 11.3.1. Soaps and Detergents
- 11.3.2. Paints and Coatings
- 11.3.3. Automotive
- 11.3.4. Metal Working Fluids
- 11.3.5. Oil and Gas
- 11.3.6. Other End-user Industries
- 11.1. Market Analysis, Insights and Forecast - by Product Type
- 12. Competitive Analysis
- 12.1. Company Profiles
- 12.1.1 Lascaray S A
- 12.1.1.1. Company Overview
- 12.1.1.2. Products
- 12.1.1.3. Company Financials
- 12.1.1.4. SWOT Analysis
- 12.1.2 Pine Chemical Group
- 12.1.2.1. Company Overview
- 12.1.2.2. Products
- 12.1.2.3. Company Financials
- 12.1.2.4. SWOT Analysis
- 12.1.3 Imperial Industrial Minerals Company
- 12.1.3.1. Company Overview
- 12.1.3.2. Products
- 12.1.3.3. Company Financials
- 12.1.3.4. SWOT Analysis
- 12.1.4 Arizona Chemical Co
- 12.1.4.1. Company Overview
- 12.1.4.2. Products
- 12.1.4.3. Company Financials
- 12.1.4.4. SWOT Analysis
- 12.1.5 Harima Chemicals Group Inc
- 12.1.5.1. Company Overview
- 12.1.5.2. Products
- 12.1.5.3. Company Financials
- 12.1.5.4. SWOT Analysis
- 12.1.6 Eastman Chemical Company
- 12.1.6.1. Company Overview
- 12.1.6.2. Products
- 12.1.6.3. Company Financials
- 12.1.6.4. SWOT Analysis
- 12.1.7 Ingevity
- 12.1.7.1. Company Overview
- 12.1.7.2. Products
- 12.1.7.3. Company Financials
- 12.1.7.4. SWOT Analysis
- 12.1.8 Segezha-Group
- 12.1.8.1. Company Overview
- 12.1.8.2. Products
- 12.1.8.3. Company Financials
- 12.1.8.4. SWOT Analysis
- 12.1.9 Forchem Oyj
- 12.1.9.1. Company Overview
- 12.1.9.2. Products
- 12.1.9.3. Company Financials
- 12.1.9.4. SWOT Analysis
- 12.1.10 Ilim Group
- 12.1.10.1. Company Overview
- 12.1.10.2. Products
- 12.1.10.3. Company Financials
- 12.1.10.4. SWOT Analysis
- 12.1.11 KRATON CORPORATION
- 12.1.11.1. Company Overview
- 12.1.11.2. Products
- 12.1.11.3. Company Financials
- 12.1.11.4. SWOT Analysis
- 12.1.12 UNIVAR SOLUTIONS
- 12.1.12.1. Company Overview
- 12.1.12.2. Products
- 12.1.12.3. Company Financials
- 12.1.12.4. SWOT Analysis
- 12.1.13 Shaxian Lixin Resin Co Ltd
- 12.1.13.1. Company Overview
- 12.1.13.2. Products
- 12.1.13.3. Company Financials
- 12.1.13.4. SWOT Analysis
- 12.1.14 Foreverest Resources Ltd
- 12.1.14.1. Company Overview
- 12.1.14.2. Products
- 12.1.14.3. Company Financials
- 12.1.14.4. SWOT Analysis
- 12.1.15 Pasand Speciality Chemicals
- 12.1.15.1. Company Overview
- 12.1.15.2. Products
- 12.1.15.3. Company Financials
- 12.1.15.4. SWOT Analysis
- 12.1.16 Ataman Kimya
- 12.1.16.1. Company Overview
- 12.1.16.2. Products
- 12.1.16.3. Company Financials
- 12.1.16.4. SWOT Analysis
- 12.1.17 G C Rutteman & Co B V
- 12.1.17.1. Company Overview
- 12.1.17.2. Products
- 12.1.17.3. Company Financials
- 12.1.17.4. SWOT Analysis
- 12.1.1 Lascaray S A
- 12.2. Market Entropy
- 12.2.1 Company's Key Areas Served
- 12.2.2 Recent Developments
- 12.3. Company Market Share Analysis 2025
- 12.3.1 Top 5 Companies Market Share Analysis
- 12.3.2 Top 3 Companies Market Share Analysis
- 12.4. List of Potential Customers
- 13. Research Methodology
List of Figures
- Figure 1: Global Tall Oil Fatty Acid Market Revenue Breakdown (million, %) by Region 2025 & 2033
- Figure 2: Global Tall Oil Fatty Acid Market Volume Breakdown (K Tons, %) by Region 2025 & 2033
- Figure 3: Asia Pacific Tall Oil Fatty Acid Market Revenue (million), by Product Type 2025 & 2033
- Figure 4: Asia Pacific Tall Oil Fatty Acid Market Volume (K Tons), by Product Type 2025 & 2033
- Figure 5: Asia Pacific Tall Oil Fatty Acid Market Revenue Share (%), by Product Type 2025 & 2033
- Figure 6: Asia Pacific Tall Oil Fatty Acid Market Volume Share (%), by Product Type 2025 & 2033
- Figure 7: Asia Pacific Tall Oil Fatty Acid Market Revenue (million), by Application 2025 & 2033
- Figure 8: Asia Pacific Tall Oil Fatty Acid Market Volume (K Tons), by Application 2025 & 2033
- Figure 9: Asia Pacific Tall Oil Fatty Acid Market Revenue Share (%), by Application 2025 & 2033
- Figure 10: Asia Pacific Tall Oil Fatty Acid Market Volume Share (%), by Application 2025 & 2033
- Figure 11: Asia Pacific Tall Oil Fatty Acid Market Revenue (million), by End-user Industry 2025 & 2033
- Figure 12: Asia Pacific Tall Oil Fatty Acid Market Volume (K Tons), by End-user Industry 2025 & 2033
- Figure 13: Asia Pacific Tall Oil Fatty Acid Market Revenue Share (%), by End-user Industry 2025 & 2033
- Figure 14: Asia Pacific Tall Oil Fatty Acid Market Volume Share (%), by End-user Industry 2025 & 2033
- Figure 15: Asia Pacific Tall Oil Fatty Acid Market Revenue (million), by Country 2025 & 2033
- Figure 16: Asia Pacific Tall Oil Fatty Acid Market Volume (K Tons), by Country 2025 & 2033
- Figure 17: Asia Pacific Tall Oil Fatty Acid Market Revenue Share (%), by Country 2025 & 2033
- Figure 18: Asia Pacific Tall Oil Fatty Acid Market Volume Share (%), by Country 2025 & 2033
- Figure 19: North America Tall Oil Fatty Acid Market Revenue (million), by Product Type 2025 & 2033
- Figure 20: North America Tall Oil Fatty Acid Market Volume (K Tons), by Product Type 2025 & 2033
- Figure 21: North America Tall Oil Fatty Acid Market Revenue Share (%), by Product Type 2025 & 2033
- Figure 22: North America Tall Oil Fatty Acid Market Volume Share (%), by Product Type 2025 & 2033
- Figure 23: North America Tall Oil Fatty Acid Market Revenue (million), by Application 2025 & 2033
- Figure 24: North America Tall Oil Fatty Acid Market Volume (K Tons), by Application 2025 & 2033
- Figure 25: North America Tall Oil Fatty Acid Market Revenue Share (%), by Application 2025 & 2033
- Figure 26: North America Tall Oil Fatty Acid Market Volume Share (%), by Application 2025 & 2033
- Figure 27: North America Tall Oil Fatty Acid Market Revenue (million), by End-user Industry 2025 & 2033
- Figure 28: North America Tall Oil Fatty Acid Market Volume (K Tons), by End-user Industry 2025 & 2033
- Figure 29: North America Tall Oil Fatty Acid Market Revenue Share (%), by End-user Industry 2025 & 2033
- Figure 30: North America Tall Oil Fatty Acid Market Volume Share (%), by End-user Industry 2025 & 2033
- Figure 31: North America Tall Oil Fatty Acid Market Revenue (million), by Country 2025 & 2033
- Figure 32: North America Tall Oil Fatty Acid Market Volume (K Tons), by Country 2025 & 2033
- Figure 33: North America Tall Oil Fatty Acid Market Revenue Share (%), by Country 2025 & 2033
- Figure 34: North America Tall Oil Fatty Acid Market Volume Share (%), by Country 2025 & 2033
- Figure 35: Europe Tall Oil Fatty Acid Market Revenue (million), by Product Type 2025 & 2033
- Figure 36: Europe Tall Oil Fatty Acid Market Volume (K Tons), by Product Type 2025 & 2033
- Figure 37: Europe Tall Oil Fatty Acid Market Revenue Share (%), by Product Type 2025 & 2033
- Figure 38: Europe Tall Oil Fatty Acid Market Volume Share (%), by Product Type 2025 & 2033
- Figure 39: Europe Tall Oil Fatty Acid Market Revenue (million), by Application 2025 & 2033
- Figure 40: Europe Tall Oil Fatty Acid Market Volume (K Tons), by Application 2025 & 2033
- Figure 41: Europe Tall Oil Fatty Acid Market Revenue Share (%), by Application 2025 & 2033
- Figure 42: Europe Tall Oil Fatty Acid Market Volume Share (%), by Application 2025 & 2033
- Figure 43: Europe Tall Oil Fatty Acid Market Revenue (million), by End-user Industry 2025 & 2033
- Figure 44: Europe Tall Oil Fatty Acid Market Volume (K Tons), by End-user Industry 2025 & 2033
- Figure 45: Europe Tall Oil Fatty Acid Market Revenue Share (%), by End-user Industry 2025 & 2033
- Figure 46: Europe Tall Oil Fatty Acid Market Volume Share (%), by End-user Industry 2025 & 2033
- Figure 47: Europe Tall Oil Fatty Acid Market Revenue (million), by Country 2025 & 2033
- Figure 48: Europe Tall Oil Fatty Acid Market Volume (K Tons), by Country 2025 & 2033
- Figure 49: Europe Tall Oil Fatty Acid Market Revenue Share (%), by Country 2025 & 2033
- Figure 50: Europe Tall Oil Fatty Acid Market Volume Share (%), by Country 2025 & 2033
- Figure 51: South America Tall Oil Fatty Acid Market Revenue (million), by Product Type 2025 & 2033
- Figure 52: South America Tall Oil Fatty Acid Market Volume (K Tons), by Product Type 2025 & 2033
- Figure 53: South America Tall Oil Fatty Acid Market Revenue Share (%), by Product Type 2025 & 2033
- Figure 54: South America Tall Oil Fatty Acid Market Volume Share (%), by Product Type 2025 & 2033
- Figure 55: South America Tall Oil Fatty Acid Market Revenue (million), by Application 2025 & 2033
- Figure 56: South America Tall Oil Fatty Acid Market Volume (K Tons), by Application 2025 & 2033
- Figure 57: South America Tall Oil Fatty Acid Market Revenue Share (%), by Application 2025 & 2033
- Figure 58: South America Tall Oil Fatty Acid Market Volume Share (%), by Application 2025 & 2033
- Figure 59: South America Tall Oil Fatty Acid Market Revenue (million), by End-user Industry 2025 & 2033
- Figure 60: South America Tall Oil Fatty Acid Market Volume (K Tons), by End-user Industry 2025 & 2033
- Figure 61: South America Tall Oil Fatty Acid Market Revenue Share (%), by End-user Industry 2025 & 2033
- Figure 62: South America Tall Oil Fatty Acid Market Volume Share (%), by End-user Industry 2025 & 2033
- Figure 63: South America Tall Oil Fatty Acid Market Revenue (million), by Country 2025 & 2033
- Figure 64: South America Tall Oil Fatty Acid Market Volume (K Tons), by Country 2025 & 2033
- Figure 65: South America Tall Oil Fatty Acid Market Revenue Share (%), by Country 2025 & 2033
- Figure 66: South America Tall Oil Fatty Acid Market Volume Share (%), by Country 2025 & 2033
- Figure 67: Middle East and Africa Tall Oil Fatty Acid Market Revenue (million), by Product Type 2025 & 2033
- Figure 68: Middle East and Africa Tall Oil Fatty Acid Market Volume (K Tons), by Product Type 2025 & 2033
- Figure 69: Middle East and Africa Tall Oil Fatty Acid Market Revenue Share (%), by Product Type 2025 & 2033
- Figure 70: Middle East and Africa Tall Oil Fatty Acid Market Volume Share (%), by Product Type 2025 & 2033
- Figure 71: Middle East and Africa Tall Oil Fatty Acid Market Revenue (million), by Application 2025 & 2033
- Figure 72: Middle East and Africa Tall Oil Fatty Acid Market Volume (K Tons), by Application 2025 & 2033
- Figure 73: Middle East and Africa Tall Oil Fatty Acid Market Revenue Share (%), by Application 2025 & 2033
- Figure 74: Middle East and Africa Tall Oil Fatty Acid Market Volume Share (%), by Application 2025 & 2033
- Figure 75: Middle East and Africa Tall Oil Fatty Acid Market Revenue (million), by End-user Industry 2025 & 2033
- Figure 76: Middle East and Africa Tall Oil Fatty Acid Market Volume (K Tons), by End-user Industry 2025 & 2033
- Figure 77: Middle East and Africa Tall Oil Fatty Acid Market Revenue Share (%), by End-user Industry 2025 & 2033
- Figure 78: Middle East and Africa Tall Oil Fatty Acid Market Volume Share (%), by End-user Industry 2025 & 2033
- Figure 79: Middle East and Africa Tall Oil Fatty Acid Market Revenue (million), by Country 2025 & 2033
- Figure 80: Middle East and Africa Tall Oil Fatty Acid Market Volume (K Tons), by Country 2025 & 2033
- Figure 81: Middle East and Africa Tall Oil Fatty Acid Market Revenue Share (%), by Country 2025 & 2033
- Figure 82: Middle East and Africa Tall Oil Fatty Acid Market Volume Share (%), by Country 2025 & 2033
List of Tables
- Table 1: Global Tall Oil Fatty Acid Market Revenue million Forecast, by Product Type 2020 & 2033
- Table 2: Global Tall Oil Fatty Acid Market Volume K Tons Forecast, by Product Type 2020 & 2033
- Table 3: Global Tall Oil Fatty Acid Market Revenue million Forecast, by Application 2020 & 2033
- Table 4: Global Tall Oil Fatty Acid Market Volume K Tons Forecast, by Application 2020 & 2033
- Table 5: Global Tall Oil Fatty Acid Market Revenue million Forecast, by End-user Industry 2020 & 2033
- Table 6: Global Tall Oil Fatty Acid Market Volume K Tons Forecast, by End-user Industry 2020 & 2033
- Table 7: Global Tall Oil Fatty Acid Market Revenue million Forecast, by Region 2020 & 2033
- Table 8: Global Tall Oil Fatty Acid Market Volume K Tons Forecast, by Region 2020 & 2033
- Table 9: Global Tall Oil Fatty Acid Market Revenue million Forecast, by Product Type 2020 & 2033
- Table 10: Global Tall Oil Fatty Acid Market Volume K Tons Forecast, by Product Type 2020 & 2033
- Table 11: Global Tall Oil Fatty Acid Market Revenue million Forecast, by Application 2020 & 2033
- Table 12: Global Tall Oil Fatty Acid Market Volume K Tons Forecast, by Application 2020 & 2033
- Table 13: Global Tall Oil Fatty Acid Market Revenue million Forecast, by End-user Industry 2020 & 2033
- Table 14: Global Tall Oil Fatty Acid Market Volume K Tons Forecast, by End-user Industry 2020 & 2033
- Table 15: Global Tall Oil Fatty Acid Market Revenue million Forecast, by Country 2020 & 2033
- Table 16: Global Tall Oil Fatty Acid Market Volume K Tons Forecast, by Country 2020 & 2033
- Table 17: China Tall Oil Fatty Acid Market Revenue (million) Forecast, by Application 2020 & 2033
- Table 18: China Tall Oil Fatty Acid Market Volume (K Tons) Forecast, by Application 2020 & 2033
- Table 19: India Tall Oil Fatty Acid Market Revenue (million) Forecast, by Application 2020 & 2033
- Table 20: India Tall Oil Fatty Acid Market Volume (K Tons) Forecast, by Application 2020 & 2033
- Table 21: Japan Tall Oil Fatty Acid Market Revenue (million) Forecast, by Application 2020 & 2033
- Table 22: Japan Tall Oil Fatty Acid Market Volume (K Tons) Forecast, by Application 2020 & 2033
- Table 23: South Korea Tall Oil Fatty Acid Market Revenue (million) Forecast, by Application 2020 & 2033
- Table 24: South Korea Tall Oil Fatty Acid Market Volume (K Tons) Forecast, by Application 2020 & 2033
- Table 25: Rest of Asia Pacific Tall Oil Fatty Acid Market Revenue (million) Forecast, by Application 2020 & 2033
- Table 26: Rest of Asia Pacific Tall Oil Fatty Acid Market Volume (K Tons) Forecast, by Application 2020 & 2033
- Table 27: Global Tall Oil Fatty Acid Market Revenue million Forecast, by Product Type 2020 & 2033
- Table 28: Global Tall Oil Fatty Acid Market Volume K Tons Forecast, by Product Type 2020 & 2033
- Table 29: Global Tall Oil Fatty Acid Market Revenue million Forecast, by Application 2020 & 2033
- Table 30: Global Tall Oil Fatty Acid Market Volume K Tons Forecast, by Application 2020 & 2033
- Table 31: Global Tall Oil Fatty Acid Market Revenue million Forecast, by End-user Industry 2020 & 2033
- Table 32: Global Tall Oil Fatty Acid Market Volume K Tons Forecast, by End-user Industry 2020 & 2033
- Table 33: Global Tall Oil Fatty Acid Market Revenue million Forecast, by Country 2020 & 2033
- Table 34: Global Tall Oil Fatty Acid Market Volume K Tons Forecast, by Country 2020 & 2033
- Table 35: United States Tall Oil Fatty Acid Market Revenue (million) Forecast, by Application 2020 & 2033
- Table 36: United States Tall Oil Fatty Acid Market Volume (K Tons) Forecast, by Application 2020 & 2033
- Table 37: Canada Tall Oil Fatty Acid Market Revenue (million) Forecast, by Application 2020 & 2033
- Table 38: Canada Tall Oil Fatty Acid Market Volume (K Tons) Forecast, by Application 2020 & 2033
- Table 39: Mexico Tall Oil Fatty Acid Market Revenue (million) Forecast, by Application 2020 & 2033
- Table 40: Mexico Tall Oil Fatty Acid Market Volume (K Tons) Forecast, by Application 2020 & 2033
- Table 41: Global Tall Oil Fatty Acid Market Revenue million Forecast, by Product Type 2020 & 2033
- Table 42: Global Tall Oil Fatty Acid Market Volume K Tons Forecast, by Product Type 2020 & 2033
- Table 43: Global Tall Oil Fatty Acid Market Revenue million Forecast, by Application 2020 & 2033
- Table 44: Global Tall Oil Fatty Acid Market Volume K Tons Forecast, by Application 2020 & 2033
- Table 45: Global Tall Oil Fatty Acid Market Revenue million Forecast, by End-user Industry 2020 & 2033
- Table 46: Global Tall Oil Fatty Acid Market Volume K Tons Forecast, by End-user Industry 2020 & 2033
- Table 47: Global Tall Oil Fatty Acid Market Revenue million Forecast, by Country 2020 & 2033
- Table 48: Global Tall Oil Fatty Acid Market Volume K Tons Forecast, by Country 2020 & 2033
- Table 49: Germany Tall Oil Fatty Acid Market Revenue (million) Forecast, by Application 2020 & 2033
- Table 50: Germany Tall Oil Fatty Acid Market Volume (K Tons) Forecast, by Application 2020 & 2033
- Table 51: United Kingdom Tall Oil Fatty Acid Market Revenue (million) Forecast, by Application 2020 & 2033
- Table 52: United Kingdom Tall Oil Fatty Acid Market Volume (K Tons) Forecast, by Application 2020 & 2033
- Table 53: Italy Tall Oil Fatty Acid Market Revenue (million) Forecast, by Application 2020 & 2033
- Table 54: Italy Tall Oil Fatty Acid Market Volume (K Tons) Forecast, by Application 2020 & 2033
- Table 55: France Tall Oil Fatty Acid Market Revenue (million) Forecast, by Application 2020 & 2033
- Table 56: France Tall Oil Fatty Acid Market Volume (K Tons) Forecast, by Application 2020 & 2033
- Table 57: Rest of Europe Tall Oil Fatty Acid Market Revenue (million) Forecast, by Application 2020 & 2033
- Table 58: Rest of Europe Tall Oil Fatty Acid Market Volume (K Tons) Forecast, by Application 2020 & 2033
- Table 59: Global Tall Oil Fatty Acid Market Revenue million Forecast, by Product Type 2020 & 2033
- Table 60: Global Tall Oil Fatty Acid Market Volume K Tons Forecast, by Product Type 2020 & 2033
- Table 61: Global Tall Oil Fatty Acid Market Revenue million Forecast, by Application 2020 & 2033
- Table 62: Global Tall Oil Fatty Acid Market Volume K Tons Forecast, by Application 2020 & 2033
- Table 63: Global Tall Oil Fatty Acid Market Revenue million Forecast, by End-user Industry 2020 & 2033
- Table 64: Global Tall Oil Fatty Acid Market Volume K Tons Forecast, by End-user Industry 2020 & 2033
- Table 65: Global Tall Oil Fatty Acid Market Revenue million Forecast, by Country 2020 & 2033
- Table 66: Global Tall Oil Fatty Acid Market Volume K Tons Forecast, by Country 2020 & 2033
- Table 67: Brazil Tall Oil Fatty Acid Market Revenue (million) Forecast, by Application 2020 & 2033
- Table 68: Brazil Tall Oil Fatty Acid Market Volume (K Tons) Forecast, by Application 2020 & 2033
- Table 69: Argentina Tall Oil Fatty Acid Market Revenue (million) Forecast, by Application 2020 & 2033
- Table 70: Argentina Tall Oil Fatty Acid Market Volume (K Tons) Forecast, by Application 2020 & 2033
- Table 71: Rest of South America Tall Oil Fatty Acid Market Revenue (million) Forecast, by Application 2020 & 2033
- Table 72: Rest of South America Tall Oil Fatty Acid Market Volume (K Tons) Forecast, by Application 2020 & 2033
- Table 73: Global Tall Oil Fatty Acid Market Revenue million Forecast, by Product Type 2020 & 2033
- Table 74: Global Tall Oil Fatty Acid Market Volume K Tons Forecast, by Product Type 2020 & 2033
- Table 75: Global Tall Oil Fatty Acid Market Revenue million Forecast, by Application 2020 & 2033
- Table 76: Global Tall Oil Fatty Acid Market Volume K Tons Forecast, by Application 2020 & 2033
- Table 77: Global Tall Oil Fatty Acid Market Revenue million Forecast, by End-user Industry 2020 & 2033
- Table 78: Global Tall Oil Fatty Acid Market Volume K Tons Forecast, by End-user Industry 2020 & 2033
- Table 79: Global Tall Oil Fatty Acid Market Revenue million Forecast, by Country 2020 & 2033
- Table 80: Global Tall Oil Fatty Acid Market Volume K Tons Forecast, by Country 2020 & 2033
- Table 81: Saudi Arabia Tall Oil Fatty Acid Market Revenue (million) Forecast, by Application 2020 & 2033
- Table 82: Saudi Arabia Tall Oil Fatty Acid Market Volume (K Tons) Forecast, by Application 2020 & 2033
- Table 83: South Africa Tall Oil Fatty Acid Market Revenue (million) Forecast, by Application 2020 & 2033
- Table 84: South Africa Tall Oil Fatty Acid Market Volume (K Tons) Forecast, by Application 2020 & 2033
- Table 85: Rest of Middle East and Africa Tall Oil Fatty Acid Market Revenue (million) Forecast, by Application 2020 & 2033
- Table 86: Rest of Middle East and Africa Tall Oil Fatty Acid Market Volume (K Tons) Forecast, by Application 2020 & 2033
Frequently Asked Questions
1. What is the projected Compound Annual Growth Rate (CAGR) of the Tall Oil Fatty Acid Market?
The projected CAGR is approximately 4.66%.
2. Which companies are prominent players in the Tall Oil Fatty Acid Market?
Key companies in the market include Lascaray S A, Pine Chemical Group, Imperial Industrial Minerals Company, Arizona Chemical Co, Harima Chemicals Group Inc, Eastman Chemical Company, Ingevity, Segezha-Group, Forchem Oyj, Ilim Group, KRATON CORPORATION, UNIVAR SOLUTIONS, Shaxian Lixin Resin Co Ltd, Foreverest Resources Ltd, Pasand Speciality Chemicals, Ataman Kimya, G C Rutteman & Co B V.
3. What are the main segments of the Tall Oil Fatty Acid Market?
The market segments include Product Type, Application, End-user Industry.
4. Can you provide details about the market size?
The market size is estimated to be USD 4.82 million as of 2022.
5. What are some drivers contributing to market growth?
Increasing Demand for Bio-based Lubricants in Several Industries; Other Drivers.
6. What are the notable trends driving market growth?
Increasing Usage in the Automotive Industry.
7. Are there any restraints impacting market growth?
Restrictions on Cutting of Trees by Various Governments Across the Globe; Other Restraints.
8. Can you provide examples of recent developments in the market?
N/A
9. What pricing options are available for accessing the report?
Pricing options include single-user, multi-user, and enterprise licenses priced at USD 4750, USD 5250, and USD 8750 respectively.
10. Is the market size provided in terms of value or volume?
The market size is provided in terms of value, measured in million and volume, measured in K Tons.
11. Are there any specific market keywords associated with the report?
Yes, the market keyword associated with the report is "Tall Oil Fatty Acid Market," which aids in identifying and referencing the specific market segment covered.
12. How do I determine which pricing option suits my needs best?
The pricing options vary based on user requirements and access needs. Individual users may opt for single-user licenses, while businesses requiring broader access may choose multi-user or enterprise licenses for cost-effective access to the report.
13. Are there any additional resources or data provided in the Tall Oil Fatty Acid Market report?
While the report offers comprehensive insights, it's advisable to review the specific contents or supplementary materials provided to ascertain if additional resources or data are available.
14. How can I stay updated on further developments or reports in the Tall Oil Fatty Acid Market?
To stay informed about further developments, trends, and reports in the Tall Oil Fatty Acid Market, consider subscribing to industry newsletters, following relevant companies and organizations, or regularly checking reputable industry news sources and publications.
Methodology
Step 1 - Identification of Relevant Samples Size from Population Database


Step 2 - Approaches for Defining Global Market Size (Value, Volume* & Price*)

Note*: In applicable scenarios
Step 3 - Data Sources
Primary Research
- Web Analytics
- Survey Reports
- Research Institute
- Latest Research Reports
- Opinion Leaders
Secondary Research
- Annual Reports
- White Paper
- Latest Press Release
- Industry Association
- Paid Database
- Investor Presentations

Step 4 - Data Triangulation
Involves using different sources of information in order to increase the validity of a study
These sources are likely to be stakeholders in a program - participants, other researchers, program staff, other community members, and so on.
Then we put all data in single framework & apply various statistical tools to find out the dynamic on the market.
During the analysis stage, feedback from the stakeholder groups would be compared to determine areas of agreement as well as areas of divergence