

Key Insights
The global Tissue Microarray (TMA) market is experiencing significant expansion, driven by the rising incidence of chronic diseases, particularly cancer, and the growing demand for personalized medicine. Advancements in molecular diagnostics and high-throughput screening technologies further propel market growth. The market is projected to exhibit a Compound Annual Growth Rate (CAGR) of 10.36%. TMAs are integral to drug discovery, biomarker identification, and disease diagnostics, with the pharmaceutical and biotechnology sectors being primary end-users. Innovations in Next-Generation Sequencing (NGS) and polymerase chain reaction (PCR) techniques integrated with TMAs are accelerating market development. Immunohistochemistry (IHC) remains a dominant procedural technique, supported by FISH and In Situ Hybridization. North America currently leads the market due to robust research infrastructure and R&D funding, while the Asia-Pacific region is anticipated to witness rapid growth driven by increasing healthcare investments and awareness of advanced diagnostics. Despite potential restraints from regulatory challenges and initial investment costs, the TMA market presents a highly positive outlook for substantial growth throughout the forecast period.
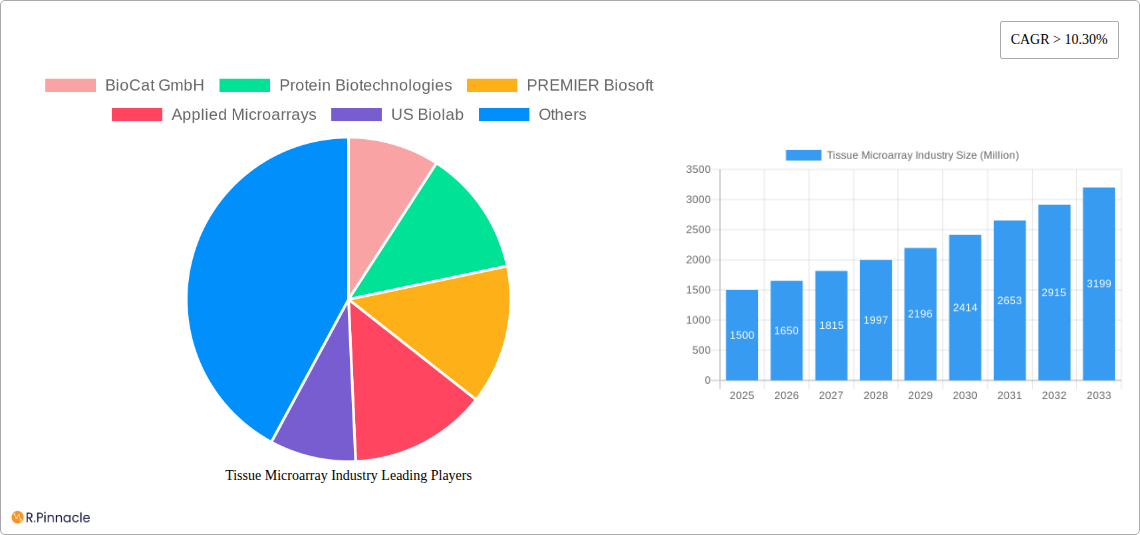
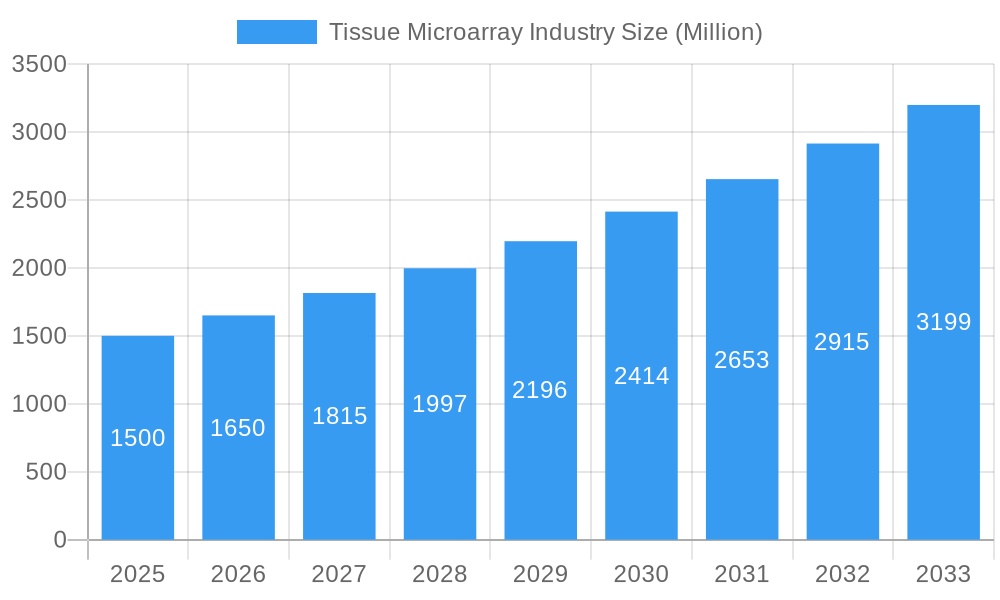
Tissue Microarray Industry Market Size (In Billion)
The competitive environment features established and emerging companies. Key players are actively developing innovative TMA technologies and expanding product offerings. Strategic collaborations and mergers & acquisitions are expected to influence market dynamics. Future growth hinges on continuous technological innovation, expanded applications across therapeutic areas, and regulatory approvals for new diagnostic assays. Automation in TMA production and analysis will enhance efficiency and reduce costs, further stimulating market growth. Penetration into emerging markets and ongoing R&D will solidify the promising future of the TMA market.
Tissue Microarray Industry Company Market Share
Tissue Microarray Market Analysis & Forecast: 2019-2033
This report offers a comprehensive analysis of the Tissue Microarray market, providing critical insights for stakeholders. Covering the period 2019-2033, with a base year of 2025, the report utilizes extensive market data to forecast future trends and opportunities. The global market size is projected to reach 14.07 billion by 2033.
Tissue Microarray Industry Market Structure & Innovation Trends
The Tissue Microarray (TMA) market exhibits a moderately fragmented structure, with several key players competing for market share. While precise market share data for individual companies remains proprietary, BioCat GmbH, Protein Biotechnologies, PREMIER Biosoft, Applied Microarrays, and Arrayit Corporation are among the notable players. The market's competitive landscape is shaped by ongoing innovation, particularly in areas such as automation and high-throughput technologies. Several factors contribute to the dynamic nature of the market:
- Innovation Drivers: Advancements in molecular diagnostics, genomics, and proteomics drive demand for TMAs. The development of novel microarray platforms and improved data analysis tools fuels market growth.
- Regulatory Frameworks: Regulatory approvals and guidelines for diagnostic TMAs significantly influence market adoption and growth. Stringent regulatory compliance standards shape the market's competitive landscape.
- Product Substitutes: While TMAs offer unique advantages, alternative technologies such as next-generation sequencing and PCR arrays represent some level of substitution, influencing market dynamics.
- End-User Demographics: The market's primary end-users include pharmaceutical and biotechnological companies, research organizations, and hospitals. Growth in these sectors directly influences the market's trajectory.
- M&A Activities: The TMA industry has seen a moderate level of mergers and acquisitions, with deal values ranging from xx Million to xx Million in recent years. These activities reshape market consolidation and competitive dynamics.
Tissue Microarray Industry Market Dynamics & Trends
The Tissue Microarray industry is experiencing robust growth, driven by several key factors. The market is expected to demonstrate a Compound Annual Growth Rate (CAGR) of xx% during the forecast period (2025-2033). This growth is fueled by rising demand for personalized medicine and advanced diagnostics, increasing prevalence of chronic diseases, technological advancements in microarray technology, and expansion of research and development activities.
Technological disruptions, such as the integration of artificial intelligence and machine learning for improved data analysis, are impacting market dynamics. The increasing adoption of automation is improving throughput and efficiency, contributing to market expansion. Consumer preferences are shifting towards faster and more accurate diagnostic tools, leading to a greater demand for advanced TMA technologies. Furthermore, the competitive landscape is marked by ongoing innovation and the development of novel applications, increasing the market’s dynamism. Market penetration of TMAs in specific segments like oncology and drug development is expanding at xx% annually.
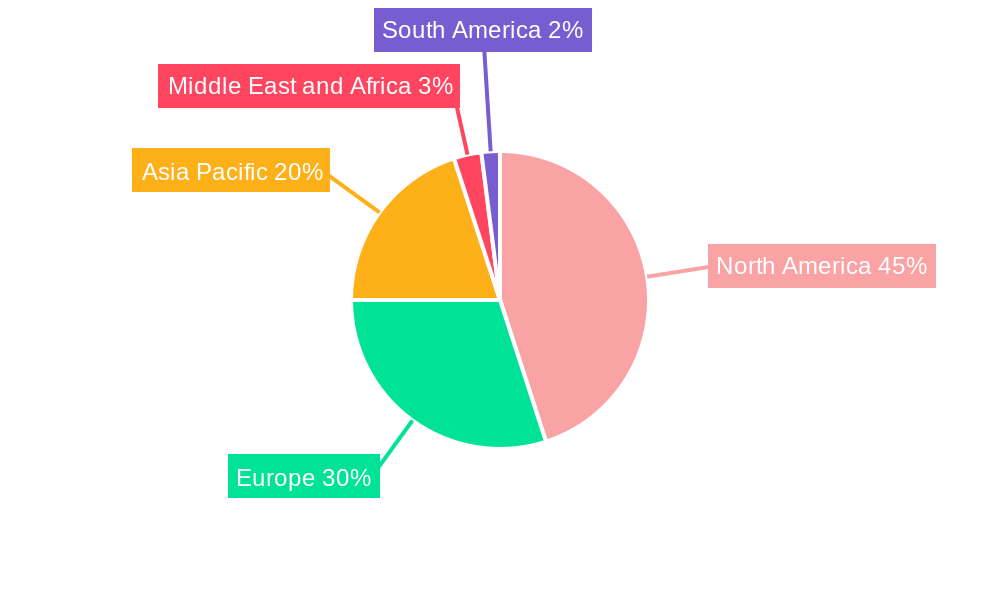
Dominant Regions & Segments in Tissue Microarray Industry
The North American region currently holds the dominant position in the Tissue Microarray market, driven by advanced healthcare infrastructure, high research expenditure, and a strong presence of major market players. However, the Asia-Pacific region is expected to witness significant growth during the forecast period due to rising healthcare expenditure and increasing prevalence of chronic diseases.
By End-User:
- Pharmaceutical and Biotechnological Companies: This segment is the largest end-user due to the significant role of TMAs in drug discovery and development.
- Research Organizations: Research institutions utilize TMAs extensively for genomic and proteomic research.
By Procedure:
- Immunohistochemistry: This procedure remains the most widely used, although other techniques are gaining traction.
- Fluorescence in situ hybridization (FISH): Growth in FISH applications is expected due to advancements in imaging technology and improved sensitivity.
By Technology:
- DNA Microarray: This technology continues to be widely adopted for its high throughput and cost effectiveness.
- Next-Generation Sequencing: NGS is gaining in popularity as it offers greater genomic coverage and resolution.
Key drivers for regional dominance include robust economic policies that support healthcare investment, well-developed healthcare infrastructure, and strong regulatory frameworks.
Tissue Microarray Industry Product Innovations
Recent product innovations are focused on enhancing the efficiency and accuracy of tissue microarray analysis. This includes the development of automated tissue microarray construction systems, advanced imaging techniques, and more sophisticated data analysis software. These improvements aim to reduce turnaround times, improve data quality, and expand the range of applications. The market is seeing an increasing integration of next-generation sequencing and other “omics” technologies with traditional TMA approaches, enhancing the scope and depth of analysis. This drives value propositions by offering increased sensitivity and resolution in biomarker identification and validation.
Report Scope & Segmentation Analysis
This report provides a comprehensive segmentation analysis of the Tissue Microarray industry.
By End-User: The report analyzes the market size and growth projections for pharmaceutical and biotechnological companies and research organizations. Competition is fierce in both segments.
By Procedure: The report details market share and growth prospects for Immunohistochemistry, FISH, In Situ Hybridization, and other procedure types. Immunohistochemistry currently holds the largest market share.
By Technology: The report examines the market dynamics for Polymerase Chain Reaction (PCR), Next-Generation Sequencing, DNA Microarray, and other technology types, highlighting the shift towards NGS for enhanced analytical capabilities.
Key Drivers of Tissue Microarray Industry Growth
The growth of the Tissue Microarray industry is driven by several key factors: the increasing prevalence of chronic diseases requiring advanced diagnostics, the rising demand for personalized medicine and targeted therapies, advancements in microarray technology and data analysis capabilities, and increased funding for research and development in the life sciences sector. Government initiatives supporting healthcare infrastructure further accelerate market growth.
Challenges in the Tissue Microarray Industry Sector
The Tissue Microarray industry faces certain challenges, including high costs associated with equipment and reagents, the complexity of data analysis, and stringent regulatory requirements for diagnostic applications. Competition from alternative technologies and the need for skilled technicians also pose obstacles. Supply chain disruptions, particularly regarding specialized reagents and consumables, can impact market growth, although the impact is currently estimated at under xx Million annually.
Emerging Opportunities in Tissue Microarray Industry
Emerging opportunities lie in developing novel applications of TMAs, integrating artificial intelligence for automated data analysis, and expanding into new therapeutic areas. The development of miniaturized and portable TMA systems for point-of-care diagnostics represents a significant growth area. Furthermore, exploration of novel biomarker discovery and validation holds immense potential.
Leading Players in the Tissue Microarray Industry Market
- BioCat GmbH
- Protein Biotechnologies
- PREMIER Biosoft
- Applied Microarrays
- US Biolab
- Arrayit Corporation
- Bio SB
- OriGene
- ProteoGenex
- Biocompare
- Novus Biologicals
- BioIVT
Key Developments in Tissue Microarray Industry Industry
- May 2023: PathogenDx announced plans to launch a microarray-based test for urinary tract infections, enabling the identification of 26 pathogens and 20 antimicrobial resistance genes.
- March 2023: TriMetis Life Sciences and ISENET collaborated on an automated tissue coring system, revolutionizing genomic profiling.
Future Outlook for Tissue Microarray Industry Market
The Tissue Microarray market is poised for continued growth, fueled by technological advancements, increasing healthcare expenditure, and the growing demand for personalized medicine. Strategic partnerships, acquisitions, and expansion into emerging markets will further shape the industry's future trajectory. New applications in areas such as infectious disease diagnostics and drug development will drive market expansion.
Tissue Microarray Industry Segmentation
-
1. Procedure
- 1.1. Immunohistochemistry
- 1.2. Fluorescence in situ hybridization (FISH)
- 1.3. In Situ Hybridization
- 1.4. Other Procedure Types
-
2. Technology
- 2.1. Polymerase Chain Reaction (PCR)
- 2.2. Next-Generation Sequencing
- 2.3. DNA Microarray
- 2.4. Other Technology Types
-
3. End-User
- 3.1. Pharmaceutical and Biotechnological Companies
- 3.2. Research Organizations
Tissue Microarray Industry Segmentation By Geography
-
1. North America
- 1.1. United States
- 1.2. Canada
- 1.3. Mexico
-
2. Europe
- 2.1. Germany
- 2.2. United Kingdom
- 2.3. France
- 2.4. Italy
- 2.5. Spain
- 2.6. Rest of Europe
-
3. Asia Pacific
- 3.1. China
- 3.2. Japan
- 3.3. India
- 3.4. Australia
- 3.5. South Korea
- 3.6. Rest of Asia Pacific
-
4. Middle East and Africa
- 4.1. GCC
- 4.2. South Africa
- 4.3. Rest of Middle East and Africa
-
5. South America
- 5.1. Brazil
- 5.2. Argentina
- 5.3. Rest of South America
Tissue Microarray Industry Regional Market Share
Geographic Coverage of Tissue Microarray Industry
Tissue Microarray Industry REPORT HIGHLIGHTS
| Aspects | Details |
|---|---|
| Study Period | 2020-2034 |
| Base Year | 2025 |
| Estimated Year | 2026 |
| Forecast Period | 2026-2034 |
| Historical Period | 2020-2025 |
| Growth Rate | CAGR of 10.36% from 2020-2034 |
| Segmentation |
|
Table of Contents
- 1. Introduction
- 1.1. Research Scope
- 1.2. Market Segmentation
- 1.3. Research Objective
- 1.4. Definitions and Assumptions
- 2. Executive Summary
- 2.1. Market Snapshot
- 3. Market Dynamics
- 3.1. Market Drivers
- 3.2. Market Restrains
- 3.3. Market Trends
- 3.4. Market Opportunities
- 4. Market Factor Analysis
- 4.1. Porters Five Forces
- 4.1.1. Bargaining Power of Suppliers
- 4.1.2. Bargaining Power of Buyers
- 4.1.3. Threat of New Entrants
- 4.1.4. Threat of Substitutes
- 4.1.5. Competitive Rivalry
- 4.2. PESTEL analysis
- 4.3. BCG Analysis
- 4.3.1. Stars (High Growth, High Market Share)
- 4.3.2. Cash Cows (Low Growth, High Market Share)
- 4.3.3. Question Mark (High Growth, Low Market Share)
- 4.3.4. Dogs (Low Growth, Low Market Share)
- 4.4. Ansoff Matrix Analysis
- 4.5. Supply Chain Analysis
- 4.6. Regulatory Landscape
- 4.7. Current Market Potential and Opportunity Assessment (TAM–SAM–SOM Framework)
- 4.8. PRI Analyst Note
- 4.1. Porters Five Forces
- 5. Market Analysis, Insights and Forecast 2021-2033
- 5.1. Market Analysis, Insights and Forecast - by Procedure
- 5.1.1. Immunohistochemistry
- 5.1.2. Fluorescence in situ hybridization (FISH)
- 5.1.3. In Situ Hybridization
- 5.1.4. Other Procedure Types
- 5.2. Market Analysis, Insights and Forecast - by Technology
- 5.2.1. Polymerase Chain Reaction (PCR)
- 5.2.2. Next-Generation Sequencing
- 5.2.3. DNA Microarray
- 5.2.4. Other Technology Types
- 5.3. Market Analysis, Insights and Forecast - by End-User
- 5.3.1. Pharmaceutical and Biotechnological Companies
- 5.3.2. Research Organizations
- 5.4. Market Analysis, Insights and Forecast - by Region
- 5.4.1. North America
- 5.4.2. Europe
- 5.4.3. Asia Pacific
- 5.4.4. Middle East and Africa
- 5.4.5. South America
- 5.1. Market Analysis, Insights and Forecast - by Procedure
- 6. Global Tissue Microarray Industry Analysis, Insights and Forecast, 2021-2033
- 6.1. Market Analysis, Insights and Forecast - by Procedure
- 6.1.1. Immunohistochemistry
- 6.1.2. Fluorescence in situ hybridization (FISH)
- 6.1.3. In Situ Hybridization
- 6.1.4. Other Procedure Types
- 6.2. Market Analysis, Insights and Forecast - by Technology
- 6.2.1. Polymerase Chain Reaction (PCR)
- 6.2.2. Next-Generation Sequencing
- 6.2.3. DNA Microarray
- 6.2.4. Other Technology Types
- 6.3. Market Analysis, Insights and Forecast - by End-User
- 6.3.1. Pharmaceutical and Biotechnological Companies
- 6.3.2. Research Organizations
- 6.1. Market Analysis, Insights and Forecast - by Procedure
- 7. North America Tissue Microarray Industry Analysis, Insights and Forecast, 2020-2032
- 7.1. Market Analysis, Insights and Forecast - by Procedure
- 7.1.1. Immunohistochemistry
- 7.1.2. Fluorescence in situ hybridization (FISH)
- 7.1.3. In Situ Hybridization
- 7.1.4. Other Procedure Types
- 7.2. Market Analysis, Insights and Forecast - by Technology
- 7.2.1. Polymerase Chain Reaction (PCR)
- 7.2.2. Next-Generation Sequencing
- 7.2.3. DNA Microarray
- 7.2.4. Other Technology Types
- 7.3. Market Analysis, Insights and Forecast - by End-User
- 7.3.1. Pharmaceutical and Biotechnological Companies
- 7.3.2. Research Organizations
- 7.1. Market Analysis, Insights and Forecast - by Procedure
- 8. Europe Tissue Microarray Industry Analysis, Insights and Forecast, 2020-2032
- 8.1. Market Analysis, Insights and Forecast - by Procedure
- 8.1.1. Immunohistochemistry
- 8.1.2. Fluorescence in situ hybridization (FISH)
- 8.1.3. In Situ Hybridization
- 8.1.4. Other Procedure Types
- 8.2. Market Analysis, Insights and Forecast - by Technology
- 8.2.1. Polymerase Chain Reaction (PCR)
- 8.2.2. Next-Generation Sequencing
- 8.2.3. DNA Microarray
- 8.2.4. Other Technology Types
- 8.3. Market Analysis, Insights and Forecast - by End-User
- 8.3.1. Pharmaceutical and Biotechnological Companies
- 8.3.2. Research Organizations
- 8.1. Market Analysis, Insights and Forecast - by Procedure
- 9. Asia Pacific Tissue Microarray Industry Analysis, Insights and Forecast, 2020-2032
- 9.1. Market Analysis, Insights and Forecast - by Procedure
- 9.1.1. Immunohistochemistry
- 9.1.2. Fluorescence in situ hybridization (FISH)
- 9.1.3. In Situ Hybridization
- 9.1.4. Other Procedure Types
- 9.2. Market Analysis, Insights and Forecast - by Technology
- 9.2.1. Polymerase Chain Reaction (PCR)
- 9.2.2. Next-Generation Sequencing
- 9.2.3. DNA Microarray
- 9.2.4. Other Technology Types
- 9.3. Market Analysis, Insights and Forecast - by End-User
- 9.3.1. Pharmaceutical and Biotechnological Companies
- 9.3.2. Research Organizations
- 9.1. Market Analysis, Insights and Forecast - by Procedure
- 10. Middle East and Africa Tissue Microarray Industry Analysis, Insights and Forecast, 2020-2032
- 10.1. Market Analysis, Insights and Forecast - by Procedure
- 10.1.1. Immunohistochemistry
- 10.1.2. Fluorescence in situ hybridization (FISH)
- 10.1.3. In Situ Hybridization
- 10.1.4. Other Procedure Types
- 10.2. Market Analysis, Insights and Forecast - by Technology
- 10.2.1. Polymerase Chain Reaction (PCR)
- 10.2.2. Next-Generation Sequencing
- 10.2.3. DNA Microarray
- 10.2.4. Other Technology Types
- 10.3. Market Analysis, Insights and Forecast - by End-User
- 10.3.1. Pharmaceutical and Biotechnological Companies
- 10.3.2. Research Organizations
- 10.1. Market Analysis, Insights and Forecast - by Procedure
- 11. South America Tissue Microarray Industry Analysis, Insights and Forecast, 2020-2032
- 11.1. Market Analysis, Insights and Forecast - by Procedure
- 11.1.1. Immunohistochemistry
- 11.1.2. Fluorescence in situ hybridization (FISH)
- 11.1.3. In Situ Hybridization
- 11.1.4. Other Procedure Types
- 11.2. Market Analysis, Insights and Forecast - by Technology
- 11.2.1. Polymerase Chain Reaction (PCR)
- 11.2.2. Next-Generation Sequencing
- 11.2.3. DNA Microarray
- 11.2.4. Other Technology Types
- 11.3. Market Analysis, Insights and Forecast - by End-User
- 11.3.1. Pharmaceutical and Biotechnological Companies
- 11.3.2. Research Organizations
- 11.1. Market Analysis, Insights and Forecast - by Procedure
- 12. Competitive Analysis
- 12.1. Company Profiles
- 12.1.1 BioCat GmbH
- 12.1.1.1. Company Overview
- 12.1.1.2. Products
- 12.1.1.3. Company Financials
- 12.1.1.4. SWOT Analysis
- 12.1.2 Protein Biotechnologies
- 12.1.2.1. Company Overview
- 12.1.2.2. Products
- 12.1.2.3. Company Financials
- 12.1.2.4. SWOT Analysis
- 12.1.3 PREMIER Biosoft
- 12.1.3.1. Company Overview
- 12.1.3.2. Products
- 12.1.3.3. Company Financials
- 12.1.3.4. SWOT Analysis
- 12.1.4 Applied Microarrays
- 12.1.4.1. Company Overview
- 12.1.4.2. Products
- 12.1.4.3. Company Financials
- 12.1.4.4. SWOT Analysis
- 12.1.5 US Biolab
- 12.1.5.1. Company Overview
- 12.1.5.2. Products
- 12.1.5.3. Company Financials
- 12.1.5.4. SWOT Analysis
- 12.1.6 Arrayit Corporation
- 12.1.6.1. Company Overview
- 12.1.6.2. Products
- 12.1.6.3. Company Financials
- 12.1.6.4. SWOT Analysis
- 12.1.7 Bio SB
- 12.1.7.1. Company Overview
- 12.1.7.2. Products
- 12.1.7.3. Company Financials
- 12.1.7.4. SWOT Analysis
- 12.1.8 OriGene
- 12.1.8.1. Company Overview
- 12.1.8.2. Products
- 12.1.8.3. Company Financials
- 12.1.8.4. SWOT Analysis
- 12.1.9 ProteoGenex
- 12.1.9.1. Company Overview
- 12.1.9.2. Products
- 12.1.9.3. Company Financials
- 12.1.9.4. SWOT Analysis
- 12.1.10 Biocompare
- 12.1.10.1. Company Overview
- 12.1.10.2. Products
- 12.1.10.3. Company Financials
- 12.1.10.4. SWOT Analysis
- 12.1.11 Novus Biologicals
- 12.1.11.1. Company Overview
- 12.1.11.2. Products
- 12.1.11.3. Company Financials
- 12.1.11.4. SWOT Analysis
- 12.1.12 BioIVT
- 12.1.12.1. Company Overview
- 12.1.12.2. Products
- 12.1.12.3. Company Financials
- 12.1.12.4. SWOT Analysis
- 12.1.1 BioCat GmbH
- 12.2. Market Entropy
- 12.2.1 Company's Key Areas Served
- 12.2.2 Recent Developments
- 12.3. Company Market Share Analysis 2025
- 12.3.1 Top 5 Companies Market Share Analysis
- 12.3.2 Top 3 Companies Market Share Analysis
- 12.4. List of Potential Customers
- 13. Research Methodology
List of Figures
- Figure 1: Global Tissue Microarray Industry Revenue Breakdown (billion, %) by Region 2025 & 2033
- Figure 2: Global Tissue Microarray Industry Volume Breakdown (K Unit, %) by Region 2025 & 2033
- Figure 3: North America Tissue Microarray Industry Revenue (billion), by Procedure 2025 & 2033
- Figure 4: North America Tissue Microarray Industry Volume (K Unit), by Procedure 2025 & 2033
- Figure 5: North America Tissue Microarray Industry Revenue Share (%), by Procedure 2025 & 2033
- Figure 6: North America Tissue Microarray Industry Volume Share (%), by Procedure 2025 & 2033
- Figure 7: North America Tissue Microarray Industry Revenue (billion), by Technology 2025 & 2033
- Figure 8: North America Tissue Microarray Industry Volume (K Unit), by Technology 2025 & 2033
- Figure 9: North America Tissue Microarray Industry Revenue Share (%), by Technology 2025 & 2033
- Figure 10: North America Tissue Microarray Industry Volume Share (%), by Technology 2025 & 2033
- Figure 11: North America Tissue Microarray Industry Revenue (billion), by End-User 2025 & 2033
- Figure 12: North America Tissue Microarray Industry Volume (K Unit), by End-User 2025 & 2033
- Figure 13: North America Tissue Microarray Industry Revenue Share (%), by End-User 2025 & 2033
- Figure 14: North America Tissue Microarray Industry Volume Share (%), by End-User 2025 & 2033
- Figure 15: North America Tissue Microarray Industry Revenue (billion), by Country 2025 & 2033
- Figure 16: North America Tissue Microarray Industry Volume (K Unit), by Country 2025 & 2033
- Figure 17: North America Tissue Microarray Industry Revenue Share (%), by Country 2025 & 2033
- Figure 18: North America Tissue Microarray Industry Volume Share (%), by Country 2025 & 2033
- Figure 19: Europe Tissue Microarray Industry Revenue (billion), by Procedure 2025 & 2033
- Figure 20: Europe Tissue Microarray Industry Volume (K Unit), by Procedure 2025 & 2033
- Figure 21: Europe Tissue Microarray Industry Revenue Share (%), by Procedure 2025 & 2033
- Figure 22: Europe Tissue Microarray Industry Volume Share (%), by Procedure 2025 & 2033
- Figure 23: Europe Tissue Microarray Industry Revenue (billion), by Technology 2025 & 2033
- Figure 24: Europe Tissue Microarray Industry Volume (K Unit), by Technology 2025 & 2033
- Figure 25: Europe Tissue Microarray Industry Revenue Share (%), by Technology 2025 & 2033
- Figure 26: Europe Tissue Microarray Industry Volume Share (%), by Technology 2025 & 2033
- Figure 27: Europe Tissue Microarray Industry Revenue (billion), by End-User 2025 & 2033
- Figure 28: Europe Tissue Microarray Industry Volume (K Unit), by End-User 2025 & 2033
- Figure 29: Europe Tissue Microarray Industry Revenue Share (%), by End-User 2025 & 2033
- Figure 30: Europe Tissue Microarray Industry Volume Share (%), by End-User 2025 & 2033
- Figure 31: Europe Tissue Microarray Industry Revenue (billion), by Country 2025 & 2033
- Figure 32: Europe Tissue Microarray Industry Volume (K Unit), by Country 2025 & 2033
- Figure 33: Europe Tissue Microarray Industry Revenue Share (%), by Country 2025 & 2033
- Figure 34: Europe Tissue Microarray Industry Volume Share (%), by Country 2025 & 2033
- Figure 35: Asia Pacific Tissue Microarray Industry Revenue (billion), by Procedure 2025 & 2033
- Figure 36: Asia Pacific Tissue Microarray Industry Volume (K Unit), by Procedure 2025 & 2033
- Figure 37: Asia Pacific Tissue Microarray Industry Revenue Share (%), by Procedure 2025 & 2033
- Figure 38: Asia Pacific Tissue Microarray Industry Volume Share (%), by Procedure 2025 & 2033
- Figure 39: Asia Pacific Tissue Microarray Industry Revenue (billion), by Technology 2025 & 2033
- Figure 40: Asia Pacific Tissue Microarray Industry Volume (K Unit), by Technology 2025 & 2033
- Figure 41: Asia Pacific Tissue Microarray Industry Revenue Share (%), by Technology 2025 & 2033
- Figure 42: Asia Pacific Tissue Microarray Industry Volume Share (%), by Technology 2025 & 2033
- Figure 43: Asia Pacific Tissue Microarray Industry Revenue (billion), by End-User 2025 & 2033
- Figure 44: Asia Pacific Tissue Microarray Industry Volume (K Unit), by End-User 2025 & 2033
- Figure 45: Asia Pacific Tissue Microarray Industry Revenue Share (%), by End-User 2025 & 2033
- Figure 46: Asia Pacific Tissue Microarray Industry Volume Share (%), by End-User 2025 & 2033
- Figure 47: Asia Pacific Tissue Microarray Industry Revenue (billion), by Country 2025 & 2033
- Figure 48: Asia Pacific Tissue Microarray Industry Volume (K Unit), by Country 2025 & 2033
- Figure 49: Asia Pacific Tissue Microarray Industry Revenue Share (%), by Country 2025 & 2033
- Figure 50: Asia Pacific Tissue Microarray Industry Volume Share (%), by Country 2025 & 2033
- Figure 51: Middle East and Africa Tissue Microarray Industry Revenue (billion), by Procedure 2025 & 2033
- Figure 52: Middle East and Africa Tissue Microarray Industry Volume (K Unit), by Procedure 2025 & 2033
- Figure 53: Middle East and Africa Tissue Microarray Industry Revenue Share (%), by Procedure 2025 & 2033
- Figure 54: Middle East and Africa Tissue Microarray Industry Volume Share (%), by Procedure 2025 & 2033
- Figure 55: Middle East and Africa Tissue Microarray Industry Revenue (billion), by Technology 2025 & 2033
- Figure 56: Middle East and Africa Tissue Microarray Industry Volume (K Unit), by Technology 2025 & 2033
- Figure 57: Middle East and Africa Tissue Microarray Industry Revenue Share (%), by Technology 2025 & 2033
- Figure 58: Middle East and Africa Tissue Microarray Industry Volume Share (%), by Technology 2025 & 2033
- Figure 59: Middle East and Africa Tissue Microarray Industry Revenue (billion), by End-User 2025 & 2033
- Figure 60: Middle East and Africa Tissue Microarray Industry Volume (K Unit), by End-User 2025 & 2033
- Figure 61: Middle East and Africa Tissue Microarray Industry Revenue Share (%), by End-User 2025 & 2033
- Figure 62: Middle East and Africa Tissue Microarray Industry Volume Share (%), by End-User 2025 & 2033
- Figure 63: Middle East and Africa Tissue Microarray Industry Revenue (billion), by Country 2025 & 2033
- Figure 64: Middle East and Africa Tissue Microarray Industry Volume (K Unit), by Country 2025 & 2033
- Figure 65: Middle East and Africa Tissue Microarray Industry Revenue Share (%), by Country 2025 & 2033
- Figure 66: Middle East and Africa Tissue Microarray Industry Volume Share (%), by Country 2025 & 2033
- Figure 67: South America Tissue Microarray Industry Revenue (billion), by Procedure 2025 & 2033
- Figure 68: South America Tissue Microarray Industry Volume (K Unit), by Procedure 2025 & 2033
- Figure 69: South America Tissue Microarray Industry Revenue Share (%), by Procedure 2025 & 2033
- Figure 70: South America Tissue Microarray Industry Volume Share (%), by Procedure 2025 & 2033
- Figure 71: South America Tissue Microarray Industry Revenue (billion), by Technology 2025 & 2033
- Figure 72: South America Tissue Microarray Industry Volume (K Unit), by Technology 2025 & 2033
- Figure 73: South America Tissue Microarray Industry Revenue Share (%), by Technology 2025 & 2033
- Figure 74: South America Tissue Microarray Industry Volume Share (%), by Technology 2025 & 2033
- Figure 75: South America Tissue Microarray Industry Revenue (billion), by End-User 2025 & 2033
- Figure 76: South America Tissue Microarray Industry Volume (K Unit), by End-User 2025 & 2033
- Figure 77: South America Tissue Microarray Industry Revenue Share (%), by End-User 2025 & 2033
- Figure 78: South America Tissue Microarray Industry Volume Share (%), by End-User 2025 & 2033
- Figure 79: South America Tissue Microarray Industry Revenue (billion), by Country 2025 & 2033
- Figure 80: South America Tissue Microarray Industry Volume (K Unit), by Country 2025 & 2033
- Figure 81: South America Tissue Microarray Industry Revenue Share (%), by Country 2025 & 2033
- Figure 82: South America Tissue Microarray Industry Volume Share (%), by Country 2025 & 2033
List of Tables
- Table 1: Global Tissue Microarray Industry Revenue billion Forecast, by Procedure 2020 & 2033
- Table 2: Global Tissue Microarray Industry Volume K Unit Forecast, by Procedure 2020 & 2033
- Table 3: Global Tissue Microarray Industry Revenue billion Forecast, by Technology 2020 & 2033
- Table 4: Global Tissue Microarray Industry Volume K Unit Forecast, by Technology 2020 & 2033
- Table 5: Global Tissue Microarray Industry Revenue billion Forecast, by End-User 2020 & 2033
- Table 6: Global Tissue Microarray Industry Volume K Unit Forecast, by End-User 2020 & 2033
- Table 7: Global Tissue Microarray Industry Revenue billion Forecast, by Region 2020 & 2033
- Table 8: Global Tissue Microarray Industry Volume K Unit Forecast, by Region 2020 & 2033
- Table 9: Global Tissue Microarray Industry Revenue billion Forecast, by Procedure 2020 & 2033
- Table 10: Global Tissue Microarray Industry Volume K Unit Forecast, by Procedure 2020 & 2033
- Table 11: Global Tissue Microarray Industry Revenue billion Forecast, by Technology 2020 & 2033
- Table 12: Global Tissue Microarray Industry Volume K Unit Forecast, by Technology 2020 & 2033
- Table 13: Global Tissue Microarray Industry Revenue billion Forecast, by End-User 2020 & 2033
- Table 14: Global Tissue Microarray Industry Volume K Unit Forecast, by End-User 2020 & 2033
- Table 15: Global Tissue Microarray Industry Revenue billion Forecast, by Country 2020 & 2033
- Table 16: Global Tissue Microarray Industry Volume K Unit Forecast, by Country 2020 & 2033
- Table 17: United States Tissue Microarray Industry Revenue (billion) Forecast, by Application 2020 & 2033
- Table 18: United States Tissue Microarray Industry Volume (K Unit) Forecast, by Application 2020 & 2033
- Table 19: Canada Tissue Microarray Industry Revenue (billion) Forecast, by Application 2020 & 2033
- Table 20: Canada Tissue Microarray Industry Volume (K Unit) Forecast, by Application 2020 & 2033
- Table 21: Mexico Tissue Microarray Industry Revenue (billion) Forecast, by Application 2020 & 2033
- Table 22: Mexico Tissue Microarray Industry Volume (K Unit) Forecast, by Application 2020 & 2033
- Table 23: Global Tissue Microarray Industry Revenue billion Forecast, by Procedure 2020 & 2033
- Table 24: Global Tissue Microarray Industry Volume K Unit Forecast, by Procedure 2020 & 2033
- Table 25: Global Tissue Microarray Industry Revenue billion Forecast, by Technology 2020 & 2033
- Table 26: Global Tissue Microarray Industry Volume K Unit Forecast, by Technology 2020 & 2033
- Table 27: Global Tissue Microarray Industry Revenue billion Forecast, by End-User 2020 & 2033
- Table 28: Global Tissue Microarray Industry Volume K Unit Forecast, by End-User 2020 & 2033
- Table 29: Global Tissue Microarray Industry Revenue billion Forecast, by Country 2020 & 2033
- Table 30: Global Tissue Microarray Industry Volume K Unit Forecast, by Country 2020 & 2033
- Table 31: Germany Tissue Microarray Industry Revenue (billion) Forecast, by Application 2020 & 2033
- Table 32: Germany Tissue Microarray Industry Volume (K Unit) Forecast, by Application 2020 & 2033
- Table 33: United Kingdom Tissue Microarray Industry Revenue (billion) Forecast, by Application 2020 & 2033
- Table 34: United Kingdom Tissue Microarray Industry Volume (K Unit) Forecast, by Application 2020 & 2033
- Table 35: France Tissue Microarray Industry Revenue (billion) Forecast, by Application 2020 & 2033
- Table 36: France Tissue Microarray Industry Volume (K Unit) Forecast, by Application 2020 & 2033
- Table 37: Italy Tissue Microarray Industry Revenue (billion) Forecast, by Application 2020 & 2033
- Table 38: Italy Tissue Microarray Industry Volume (K Unit) Forecast, by Application 2020 & 2033
- Table 39: Spain Tissue Microarray Industry Revenue (billion) Forecast, by Application 2020 & 2033
- Table 40: Spain Tissue Microarray Industry Volume (K Unit) Forecast, by Application 2020 & 2033
- Table 41: Rest of Europe Tissue Microarray Industry Revenue (billion) Forecast, by Application 2020 & 2033
- Table 42: Rest of Europe Tissue Microarray Industry Volume (K Unit) Forecast, by Application 2020 & 2033
- Table 43: Global Tissue Microarray Industry Revenue billion Forecast, by Procedure 2020 & 2033
- Table 44: Global Tissue Microarray Industry Volume K Unit Forecast, by Procedure 2020 & 2033
- Table 45: Global Tissue Microarray Industry Revenue billion Forecast, by Technology 2020 & 2033
- Table 46: Global Tissue Microarray Industry Volume K Unit Forecast, by Technology 2020 & 2033
- Table 47: Global Tissue Microarray Industry Revenue billion Forecast, by End-User 2020 & 2033
- Table 48: Global Tissue Microarray Industry Volume K Unit Forecast, by End-User 2020 & 2033
- Table 49: Global Tissue Microarray Industry Revenue billion Forecast, by Country 2020 & 2033
- Table 50: Global Tissue Microarray Industry Volume K Unit Forecast, by Country 2020 & 2033
- Table 51: China Tissue Microarray Industry Revenue (billion) Forecast, by Application 2020 & 2033
- Table 52: China Tissue Microarray Industry Volume (K Unit) Forecast, by Application 2020 & 2033
- Table 53: Japan Tissue Microarray Industry Revenue (billion) Forecast, by Application 2020 & 2033
- Table 54: Japan Tissue Microarray Industry Volume (K Unit) Forecast, by Application 2020 & 2033
- Table 55: India Tissue Microarray Industry Revenue (billion) Forecast, by Application 2020 & 2033
- Table 56: India Tissue Microarray Industry Volume (K Unit) Forecast, by Application 2020 & 2033
- Table 57: Australia Tissue Microarray Industry Revenue (billion) Forecast, by Application 2020 & 2033
- Table 58: Australia Tissue Microarray Industry Volume (K Unit) Forecast, by Application 2020 & 2033
- Table 59: South Korea Tissue Microarray Industry Revenue (billion) Forecast, by Application 2020 & 2033
- Table 60: South Korea Tissue Microarray Industry Volume (K Unit) Forecast, by Application 2020 & 2033
- Table 61: Rest of Asia Pacific Tissue Microarray Industry Revenue (billion) Forecast, by Application 2020 & 2033
- Table 62: Rest of Asia Pacific Tissue Microarray Industry Volume (K Unit) Forecast, by Application 2020 & 2033
- Table 63: Global Tissue Microarray Industry Revenue billion Forecast, by Procedure 2020 & 2033
- Table 64: Global Tissue Microarray Industry Volume K Unit Forecast, by Procedure 2020 & 2033
- Table 65: Global Tissue Microarray Industry Revenue billion Forecast, by Technology 2020 & 2033
- Table 66: Global Tissue Microarray Industry Volume K Unit Forecast, by Technology 2020 & 2033
- Table 67: Global Tissue Microarray Industry Revenue billion Forecast, by End-User 2020 & 2033
- Table 68: Global Tissue Microarray Industry Volume K Unit Forecast, by End-User 2020 & 2033
- Table 69: Global Tissue Microarray Industry Revenue billion Forecast, by Country 2020 & 2033
- Table 70: Global Tissue Microarray Industry Volume K Unit Forecast, by Country 2020 & 2033
- Table 71: GCC Tissue Microarray Industry Revenue (billion) Forecast, by Application 2020 & 2033
- Table 72: GCC Tissue Microarray Industry Volume (K Unit) Forecast, by Application 2020 & 2033
- Table 73: South Africa Tissue Microarray Industry Revenue (billion) Forecast, by Application 2020 & 2033
- Table 74: South Africa Tissue Microarray Industry Volume (K Unit) Forecast, by Application 2020 & 2033
- Table 75: Rest of Middle East and Africa Tissue Microarray Industry Revenue (billion) Forecast, by Application 2020 & 2033
- Table 76: Rest of Middle East and Africa Tissue Microarray Industry Volume (K Unit) Forecast, by Application 2020 & 2033
- Table 77: Global Tissue Microarray Industry Revenue billion Forecast, by Procedure 2020 & 2033
- Table 78: Global Tissue Microarray Industry Volume K Unit Forecast, by Procedure 2020 & 2033
- Table 79: Global Tissue Microarray Industry Revenue billion Forecast, by Technology 2020 & 2033
- Table 80: Global Tissue Microarray Industry Volume K Unit Forecast, by Technology 2020 & 2033
- Table 81: Global Tissue Microarray Industry Revenue billion Forecast, by End-User 2020 & 2033
- Table 82: Global Tissue Microarray Industry Volume K Unit Forecast, by End-User 2020 & 2033
- Table 83: Global Tissue Microarray Industry Revenue billion Forecast, by Country 2020 & 2033
- Table 84: Global Tissue Microarray Industry Volume K Unit Forecast, by Country 2020 & 2033
- Table 85: Brazil Tissue Microarray Industry Revenue (billion) Forecast, by Application 2020 & 2033
- Table 86: Brazil Tissue Microarray Industry Volume (K Unit) Forecast, by Application 2020 & 2033
- Table 87: Argentina Tissue Microarray Industry Revenue (billion) Forecast, by Application 2020 & 2033
- Table 88: Argentina Tissue Microarray Industry Volume (K Unit) Forecast, by Application 2020 & 2033
- Table 89: Rest of South America Tissue Microarray Industry Revenue (billion) Forecast, by Application 2020 & 2033
- Table 90: Rest of South America Tissue Microarray Industry Volume (K Unit) Forecast, by Application 2020 & 2033
Frequently Asked Questions
1. What is the projected Compound Annual Growth Rate (CAGR) of the Tissue Microarray Industry?
The projected CAGR is approximately 10.36%.
2. Which companies are prominent players in the Tissue Microarray Industry?
Key companies in the market include BioCat GmbH, Protein Biotechnologies, PREMIER Biosoft, Applied Microarrays, US Biolab, Arrayit Corporation, Bio SB, OriGene, ProteoGenex, Biocompare, Novus Biologicals, BioIVT.
3. What are the main segments of the Tissue Microarray Industry?
The market segments include Procedure, Technology, End-User.
4. Can you provide details about the market size?
The market size is estimated to be USD 14.07 billion as of 2022.
5. What are some drivers contributing to market growth?
Growing Research and Development in Drug Discovery; Rising Burden of Cancer; Increasing Demand For Accurate Diagnostic Methods.
6. What are the notable trends driving market growth?
Immunohistochemistry Segment is Expected to Hold a Significant Market Share in the Tissue Microarray Market.
7. Are there any restraints impacting market growth?
Availability of Alternative Techniques; High Cost Associated With Microarray Techniques.
8. Can you provide examples of recent developments in the market?
May 2023: PathogenDx planned to launch a microarray-based test for urinary tract infections in late 2023. The new urinary tract infection assay will help in the identification of 26 pathogens and 20 associated antimicrobial resistance genes in one multiplexed test and favor targeted therapies for patients.
9. What pricing options are available for accessing the report?
Pricing options include single-user, multi-user, and enterprise licenses priced at USD 4750, USD 5250, and USD 8750 respectively.
10. Is the market size provided in terms of value or volume?
The market size is provided in terms of value, measured in billion and volume, measured in K Unit.
11. Are there any specific market keywords associated with the report?
Yes, the market keyword associated with the report is "Tissue Microarray Industry," which aids in identifying and referencing the specific market segment covered.
12. How do I determine which pricing option suits my needs best?
The pricing options vary based on user requirements and access needs. Individual users may opt for single-user licenses, while businesses requiring broader access may choose multi-user or enterprise licenses for cost-effective access to the report.
13. Are there any additional resources or data provided in the Tissue Microarray Industry report?
While the report offers comprehensive insights, it's advisable to review the specific contents or supplementary materials provided to ascertain if additional resources or data are available.
14. How can I stay updated on further developments or reports in the Tissue Microarray Industry?
To stay informed about further developments, trends, and reports in the Tissue Microarray Industry, consider subscribing to industry newsletters, following relevant companies and organizations, or regularly checking reputable industry news sources and publications.
Methodology
Step 1 - Identification of Relevant Samples Size from Population Database


Step 2 - Approaches for Defining Global Market Size (Value, Volume* & Price*)

Note*: In applicable scenarios
Step 3 - Data Sources
Primary Research
- Web Analytics
- Survey Reports
- Research Institute
- Latest Research Reports
- Opinion Leaders
Secondary Research
- Annual Reports
- White Paper
- Latest Press Release
- Industry Association
- Paid Database
- Investor Presentations

Step 4 - Data Triangulation
Involves using different sources of information in order to increase the validity of a study
These sources are likely to be stakeholders in a program - participants, other researchers, program staff, other community members, and so on.
Then we put all data in single framework & apply various statistical tools to find out the dynamic on the market.
During the analysis stage, feedback from the stakeholder groups would be compared to determine areas of agreement as well as areas of divergence