

Key Insights
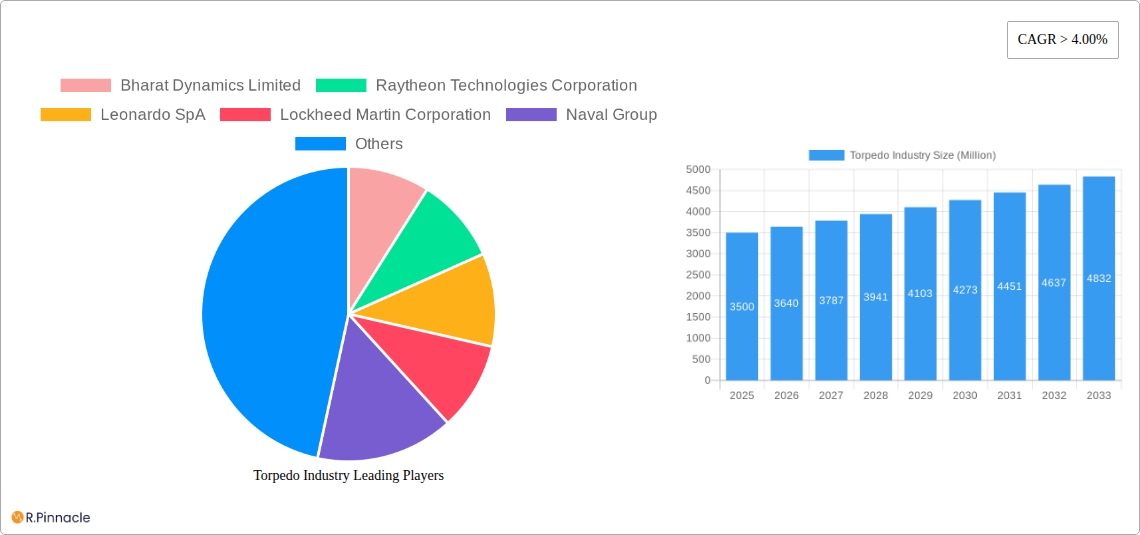
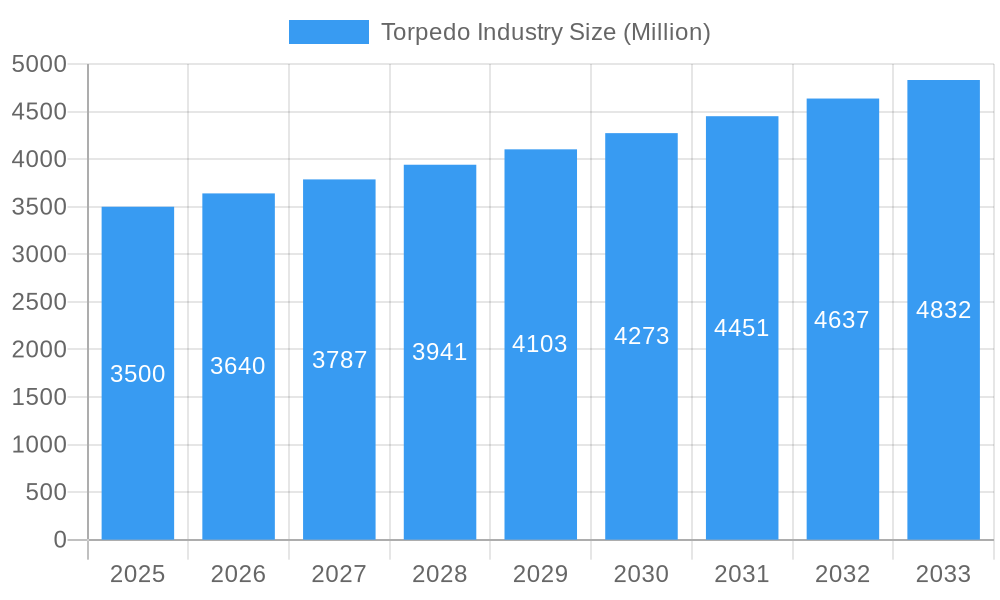
The global torpedo market, valued at approximately $3.5 billion in 2025, is projected to experience robust growth, with a compound annual growth rate (CAGR) exceeding 4% from 2025 to 2033. This expansion is driven by escalating geopolitical tensions, modernization of naval fleets worldwide, and increasing demand for advanced anti-submarine warfare (ASW) capabilities. Key trends include the development of sophisticated, autonomous torpedoes with enhanced target acquisition and homing systems, alongside improvements in propulsion technology for increased range and speed. The market is segmented by weight (heavyweight and lightweight torpedoes) and launch platform (sea-launched, air-launched, and underwater-launched). Heavyweight torpedoes, possessing greater range and destructive power, are expected to dominate the market, while the demand for air-launched torpedoes is likely to witness significant growth, fueled by the integration of these weapons into advanced maritime patrol aircraft. However, high research and development costs, along with stringent regulatory frameworks, pose challenges to market expansion.
Torpedo Industry Market Size (In Billion)
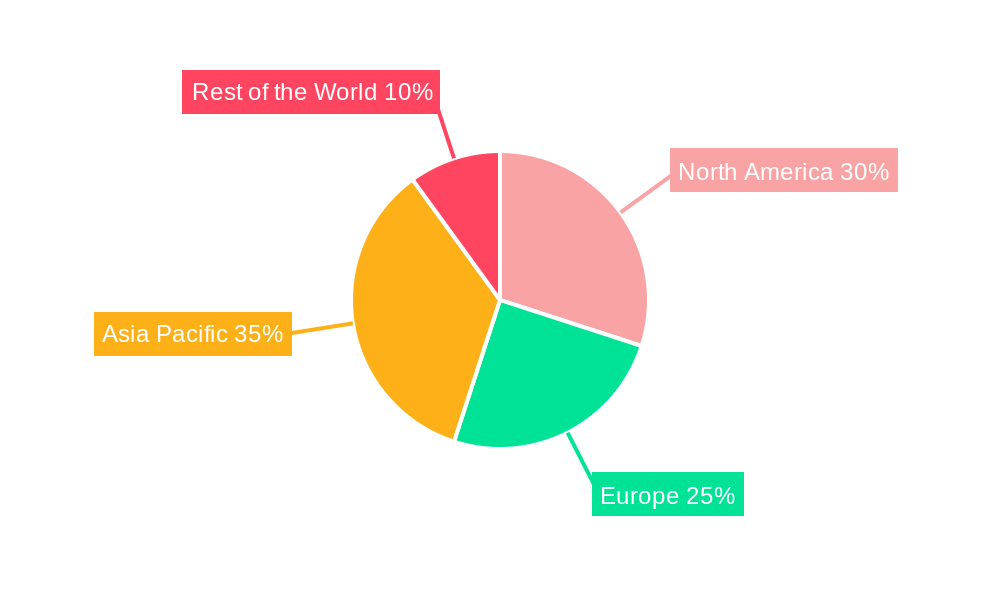
Competition within the torpedo industry is fierce, with major players such as Raytheon Technologies, Lockheed Martin, Leonardo SpA, and Bharat Dynamics Limited vying for market share through technological innovation and strategic partnerships. The Asia-Pacific region is anticipated to represent a significant market segment, driven by substantial naval modernization programs in countries like India, China, and Japan. Europe and North America will also maintain a significant presence due to established naval forces and ongoing investments in defense technology. While precise regional market shares are unavailable, a reasonable estimation suggests that Asia-Pacific could hold the largest share, followed by North America and Europe, with the Rest of the World comprising a smaller, but still significant, portion. The forecast period indicates sustained growth, propelled by continued investment in naval capabilities and the ongoing development of next-generation torpedo systems.
Torpedo Industry Company Market Share
Torpedo Industry Market Report: 2019-2033
This comprehensive report provides an in-depth analysis of the global torpedo industry, projecting a market size of USD xx Million by 2033. The study covers the historical period (2019-2024), the base year (2025), and forecasts until 2033, offering invaluable insights for industry professionals, investors, and strategists.
Torpedo Industry Market Structure & Innovation Trends
The global torpedo market is moderately concentrated, with key players like Raytheon Technologies Corporation, Lockheed Martin Corporation, and Leonardo SpA holding significant market share. However, the presence of several regional players and ongoing M&A activity indicates a dynamic competitive landscape. Innovation is driven by advancements in autonomous systems, improved guidance and navigation technologies, and the demand for increased lethality and range. Regulatory frameworks, varying by nation, significantly influence product development and deployment. Product substitutes are limited, primarily focusing on alternative anti-submarine warfare tactics. End-user demographics are primarily defense forces, with a growing focus on export markets. Recent M&A activity, while not reaching the billions, involves deals with average values of USD xx Million, signaling strategic consolidation in the sector.
- Market Concentration: Moderately concentrated, with top 5 players holding approximately xx% market share in 2025.
- Innovation Drivers: Autonomous systems, advanced guidance, increased lethality and range.
- Regulatory Frameworks: Vary significantly across countries, impacting market access and product development.
- M&A Activity: Average deal value of USD xx Million; focused on technology integration and market expansion.
Torpedo Industry Market Dynamics & Trends
The torpedo industry is projected to experience a Compound Annual Growth Rate (CAGR) of xx% during the forecast period (2025-2033), driven by rising geopolitical tensions, modernization of naval fleets, and the increasing demand for advanced anti-submarine warfare capabilities. Technological disruptions, such as the integration of AI and improved sensor technologies, are further enhancing the effectiveness of torpedo systems. Consumer preferences are shifting towards more autonomous and versatile torpedoes with extended range and improved target acquisition capabilities. Competitive dynamics are characterized by intense R&D efforts and a focus on technological differentiation, leading to a continuous improvement in product offerings and a higher market penetration rate, reaching xx% by 2033.
Dominant Regions & Segments in Torpedo Industry
The North American region dominates the torpedo market, driven by significant defense budgets and a robust domestic industry. However, Asia-Pacific is projected to witness substantial growth due to increasing defense expenditure and naval modernization programs.
- Dominant Region: North America.
- Key Drivers (North America): High defense expenditure, technological leadership, robust domestic industry.
- Key Drivers (Asia-Pacific): Increasing defense budgets, naval modernization, geopolitical tensions.
Weight: Heavyweight torpedoes hold a larger market share compared to lightweight torpedoes due to their greater destructive capabilities.
- Key Drivers (Heavyweight): Need for high destructive power against larger targets.
Launch Platform: Sea-launched torpedoes comprise the largest segment, owing to their wide applicability across various naval platforms.
- Key Drivers (Sea-launched): Versatility, compatibility with numerous naval vessels.
Torpedo Industry Product Innovations
Recent innovations focus on enhancing the autonomous capabilities of torpedoes, improving their target acquisition accuracy, and extending their range and effectiveness. These advancements cater to the growing demand for more efficient and lethal anti-submarine warfare solutions, enhancing their market fit. Technological integration of AI and improved sensor systems are key aspects of these innovations.
Report Scope & Segmentation Analysis
This report segments the torpedo market by weight (heavyweight and lightweight), launch platform (sea-launched, air-launched, underwater-launched), and region. Growth projections for each segment are provided, highlighting their respective market sizes and competitive dynamics. The analysis delves into the unique characteristics of each segment and its growth drivers, revealing the intricacies of the torpedo market’s diverse landscape.
Key Drivers of Torpedo Industry Growth
The torpedo industry's growth is driven by several factors: increasing defense budgets globally, modernization of naval fleets, rising geopolitical tensions leading to a greater focus on anti-submarine warfare, and technological advancements in guidance systems and autonomous operation.
Challenges in the Torpedo Industry Sector
Key challenges include stringent regulatory frameworks, supply chain complexities impacting the procurement of specialized components, and intense competition among established players, putting pressure on profit margins. The high cost of R&D and the long lead times associated with product development further contribute to the sector's challenges.
Emerging Opportunities in Torpedo Industry
Emerging opportunities lie in the development of autonomous and AI-powered torpedoes, integration with unmanned underwater vehicles (UUVs), and exploration of new markets in developing economies expanding their naval capabilities. Additionally, advancements in propulsion systems and countermeasures offer significant opportunities for growth and differentiation.
Leading Players in the Torpedo Industry Market
- Bharat Dynamics Limited
- Raytheon Technologies Corporation
- Leonardo SpA
- Lockheed Martin Corporation
- Naval Group
- ASELSAN AS
- JSC Tactical Missiles Corporation
- thyssenkrupp AG
- BAE Systems PLC
- Mitsubishi Heavy Industries Lt
- Northrop Grumman Corporation
- Saab AB
Key Developments in Torpedo Industry
- October 2021: The Indian Defence Ministry signed a contract with the US government for the procurement of MK 54 torpedoes for USD 56.38 Million.
- October 2021: Thales Australia secured a USD 14.5 Million contract for maintaining the Royal Australian Navy's MU90 lightweight torpedoes.
Future Outlook for Torpedo Industry Market
The torpedo industry is poised for sustained growth, driven by continuous technological advancements and the increasing demand for advanced anti-submarine warfare capabilities. Strategic partnerships and investments in R&D will be crucial for success in this dynamic market. The focus on autonomous systems and improved lethality will continue to shape the industry's trajectory in the coming years.
Torpedo Industry Segmentation
-
1. Weight
- 1.1. Heavyweight Torpedoes
- 1.2. Lightweight Torpedoes
-
2. Launch Platform
-
2.1. Sea-launched
- 2.1.1. Surface-launched
- 2.1.2. Underwater-launched
- 2.2. Air-launched
-
2.1. Sea-launched
Torpedo Industry Segmentation By Geography
- 1. North America
- 2. Europe
- 3. Asia Pacific
- 4. Rest of the World
Torpedo Industry Regional Market Share
Geographic Coverage of Torpedo Industry
Torpedo Industry REPORT HIGHLIGHTS
| Aspects | Details |
|---|---|
| Study Period | 2020-2034 |
| Base Year | 2025 |
| Estimated Year | 2026 |
| Forecast Period | 2026-2034 |
| Historical Period | 2020-2025 |
| Growth Rate | CAGR of 2.4% from 2020-2034 |
| Segmentation |
|
Table of Contents
- 1. Introduction
- 1.1. Research Scope
- 1.2. Market Segmentation
- 1.3. Research Objective
- 1.4. Definitions and Assumptions
- 2. Executive Summary
- 2.1. Market Snapshot
- 3. Market Dynamics
- 3.1. Market Drivers
- 3.2. Market Restrains
- 3.3. Market Trends
- 3.4. Market Opportunities
- 4. Market Factor Analysis
- 4.1. Porters Five Forces
- 4.1.1. Bargaining Power of Suppliers
- 4.1.2. Bargaining Power of Buyers
- 4.1.3. Threat of New Entrants
- 4.1.4. Threat of Substitutes
- 4.1.5. Competitive Rivalry
- 4.2. PESTEL analysis
- 4.3. BCG Analysis
- 4.3.1. Stars (High Growth, High Market Share)
- 4.3.2. Cash Cows (Low Growth, High Market Share)
- 4.3.3. Question Mark (High Growth, Low Market Share)
- 4.3.4. Dogs (Low Growth, Low Market Share)
- 4.4. Ansoff Matrix Analysis
- 4.5. Supply Chain Analysis
- 4.6. Regulatory Landscape
- 4.7. Current Market Potential and Opportunity Assessment (TAM–SAM–SOM Framework)
- 4.8. PRI Analyst Note
- 4.1. Porters Five Forces
- 5. Market Analysis, Insights and Forecast 2021-2033
- 5.1. Market Analysis, Insights and Forecast - by Weight
- 5.1.1. Heavyweight Torpedoes
- 5.1.2. Lightweight Torpedoes
- 5.2. Market Analysis, Insights and Forecast - by Launch Platform
- 5.2.1. Sea-launched
- 5.2.1.1. Surface-launched
- 5.2.1.2. Underwater-launched
- 5.2.2. Air-launched
- 5.2.1. Sea-launched
- 5.3. Market Analysis, Insights and Forecast - by Region
- 5.3.1. North America
- 5.3.2. Europe
- 5.3.3. Asia Pacific
- 5.3.4. Rest of the World
- 5.1. Market Analysis, Insights and Forecast - by Weight
- 6. Global Torpedo Industry Analysis, Insights and Forecast, 2021-2033
- 6.1. Market Analysis, Insights and Forecast - by Weight
- 6.1.1. Heavyweight Torpedoes
- 6.1.2. Lightweight Torpedoes
- 6.2. Market Analysis, Insights and Forecast - by Launch Platform
- 6.2.1. Sea-launched
- 6.2.1.1. Surface-launched
- 6.2.1.2. Underwater-launched
- 6.2.2. Air-launched
- 6.2.1. Sea-launched
- 6.1. Market Analysis, Insights and Forecast - by Weight
- 7. North America Torpedo Industry Analysis, Insights and Forecast, 2020-2032
- 7.1. Market Analysis, Insights and Forecast - by Weight
- 7.1.1. Heavyweight Torpedoes
- 7.1.2. Lightweight Torpedoes
- 7.2. Market Analysis, Insights and Forecast - by Launch Platform
- 7.2.1. Sea-launched
- 7.2.1.1. Surface-launched
- 7.2.1.2. Underwater-launched
- 7.2.2. Air-launched
- 7.2.1. Sea-launched
- 7.1. Market Analysis, Insights and Forecast - by Weight
- 8. Europe Torpedo Industry Analysis, Insights and Forecast, 2020-2032
- 8.1. Market Analysis, Insights and Forecast - by Weight
- 8.1.1. Heavyweight Torpedoes
- 8.1.2. Lightweight Torpedoes
- 8.2. Market Analysis, Insights and Forecast - by Launch Platform
- 8.2.1. Sea-launched
- 8.2.1.1. Surface-launched
- 8.2.1.2. Underwater-launched
- 8.2.2. Air-launched
- 8.2.1. Sea-launched
- 8.1. Market Analysis, Insights and Forecast - by Weight
- 9. Asia Pacific Torpedo Industry Analysis, Insights and Forecast, 2020-2032
- 9.1. Market Analysis, Insights and Forecast - by Weight
- 9.1.1. Heavyweight Torpedoes
- 9.1.2. Lightweight Torpedoes
- 9.2. Market Analysis, Insights and Forecast - by Launch Platform
- 9.2.1. Sea-launched
- 9.2.1.1. Surface-launched
- 9.2.1.2. Underwater-launched
- 9.2.2. Air-launched
- 9.2.1. Sea-launched
- 9.1. Market Analysis, Insights and Forecast - by Weight
- 10. Rest of the World Torpedo Industry Analysis, Insights and Forecast, 2020-2032
- 10.1. Market Analysis, Insights and Forecast - by Weight
- 10.1.1. Heavyweight Torpedoes
- 10.1.2. Lightweight Torpedoes
- 10.2. Market Analysis, Insights and Forecast - by Launch Platform
- 10.2.1. Sea-launched
- 10.2.1.1. Surface-launched
- 10.2.1.2. Underwater-launched
- 10.2.2. Air-launched
- 10.2.1. Sea-launched
- 10.1. Market Analysis, Insights and Forecast - by Weight
- 11. Competitive Analysis
- 11.1. Company Profiles
- 11.1.1 Bharat Dynamics Limited
- 11.1.1.1. Company Overview
- 11.1.1.2. Products
- 11.1.1.3. Company Financials
- 11.1.1.4. SWOT Analysis
- 11.1.2 Raytheon Technologies Corporation
- 11.1.2.1. Company Overview
- 11.1.2.2. Products
- 11.1.2.3. Company Financials
- 11.1.2.4. SWOT Analysis
- 11.1.3 Leonardo SpA
- 11.1.3.1. Company Overview
- 11.1.3.2. Products
- 11.1.3.3. Company Financials
- 11.1.3.4. SWOT Analysis
- 11.1.4 Lockheed Martin Corporation
- 11.1.4.1. Company Overview
- 11.1.4.2. Products
- 11.1.4.3. Company Financials
- 11.1.4.4. SWOT Analysis
- 11.1.5 Naval Group
- 11.1.5.1. Company Overview
- 11.1.5.2. Products
- 11.1.5.3. Company Financials
- 11.1.5.4. SWOT Analysis
- 11.1.6 ASELSAN AS
- 11.1.6.1. Company Overview
- 11.1.6.2. Products
- 11.1.6.3. Company Financials
- 11.1.6.4. SWOT Analysis
- 11.1.7 JSC Tactical Missiles Corporation
- 11.1.7.1. Company Overview
- 11.1.7.2. Products
- 11.1.7.3. Company Financials
- 11.1.7.4. SWOT Analysis
- 11.1.8 thyssenkrupp AG
- 11.1.8.1. Company Overview
- 11.1.8.2. Products
- 11.1.8.3. Company Financials
- 11.1.8.4. SWOT Analysis
- 11.1.9 BAE Systems PLC
- 11.1.9.1. Company Overview
- 11.1.9.2. Products
- 11.1.9.3. Company Financials
- 11.1.9.4. SWOT Analysis
- 11.1.10 Mitsubishi Heavy Industries Lt
- 11.1.10.1. Company Overview
- 11.1.10.2. Products
- 11.1.10.3. Company Financials
- 11.1.10.4. SWOT Analysis
- 11.1.11 Northrop Grumman Corporation
- 11.1.11.1. Company Overview
- 11.1.11.2. Products
- 11.1.11.3. Company Financials
- 11.1.11.4. SWOT Analysis
- 11.1.12 Saab AB
- 11.1.12.1. Company Overview
- 11.1.12.2. Products
- 11.1.12.3. Company Financials
- 11.1.12.4. SWOT Analysis
- 11.1.1 Bharat Dynamics Limited
- 11.2. Market Entropy
- 11.2.1 Company's Key Areas Served
- 11.2.2 Recent Developments
- 11.3. Company Market Share Analysis 2025
- 11.3.1 Top 5 Companies Market Share Analysis
- 11.3.2 Top 3 Companies Market Share Analysis
- 11.4. List of Potential Customers
- 12. Research Methodology
List of Figures
- Figure 1: Global Torpedo Industry Revenue Breakdown (billion, %) by Region 2025 & 2033
- Figure 2: North America Torpedo Industry Revenue (billion), by Weight 2025 & 2033
- Figure 3: North America Torpedo Industry Revenue Share (%), by Weight 2025 & 2033
- Figure 4: North America Torpedo Industry Revenue (billion), by Launch Platform 2025 & 2033
- Figure 5: North America Torpedo Industry Revenue Share (%), by Launch Platform 2025 & 2033
- Figure 6: North America Torpedo Industry Revenue (billion), by Country 2025 & 2033
- Figure 7: North America Torpedo Industry Revenue Share (%), by Country 2025 & 2033
- Figure 8: Europe Torpedo Industry Revenue (billion), by Weight 2025 & 2033
- Figure 9: Europe Torpedo Industry Revenue Share (%), by Weight 2025 & 2033
- Figure 10: Europe Torpedo Industry Revenue (billion), by Launch Platform 2025 & 2033
- Figure 11: Europe Torpedo Industry Revenue Share (%), by Launch Platform 2025 & 2033
- Figure 12: Europe Torpedo Industry Revenue (billion), by Country 2025 & 2033
- Figure 13: Europe Torpedo Industry Revenue Share (%), by Country 2025 & 2033
- Figure 14: Asia Pacific Torpedo Industry Revenue (billion), by Weight 2025 & 2033
- Figure 15: Asia Pacific Torpedo Industry Revenue Share (%), by Weight 2025 & 2033
- Figure 16: Asia Pacific Torpedo Industry Revenue (billion), by Launch Platform 2025 & 2033
- Figure 17: Asia Pacific Torpedo Industry Revenue Share (%), by Launch Platform 2025 & 2033
- Figure 18: Asia Pacific Torpedo Industry Revenue (billion), by Country 2025 & 2033
- Figure 19: Asia Pacific Torpedo Industry Revenue Share (%), by Country 2025 & 2033
- Figure 20: Rest of the World Torpedo Industry Revenue (billion), by Weight 2025 & 2033
- Figure 21: Rest of the World Torpedo Industry Revenue Share (%), by Weight 2025 & 2033
- Figure 22: Rest of the World Torpedo Industry Revenue (billion), by Launch Platform 2025 & 2033
- Figure 23: Rest of the World Torpedo Industry Revenue Share (%), by Launch Platform 2025 & 2033
- Figure 24: Rest of the World Torpedo Industry Revenue (billion), by Country 2025 & 2033
- Figure 25: Rest of the World Torpedo Industry Revenue Share (%), by Country 2025 & 2033
List of Tables
- Table 1: Global Torpedo Industry Revenue billion Forecast, by Weight 2020 & 2033
- Table 2: Global Torpedo Industry Revenue billion Forecast, by Launch Platform 2020 & 2033
- Table 3: Global Torpedo Industry Revenue billion Forecast, by Region 2020 & 2033
- Table 4: Global Torpedo Industry Revenue billion Forecast, by Weight 2020 & 2033
- Table 5: Global Torpedo Industry Revenue billion Forecast, by Launch Platform 2020 & 2033
- Table 6: Global Torpedo Industry Revenue billion Forecast, by Country 2020 & 2033
- Table 7: Global Torpedo Industry Revenue billion Forecast, by Weight 2020 & 2033
- Table 8: Global Torpedo Industry Revenue billion Forecast, by Launch Platform 2020 & 2033
- Table 9: Global Torpedo Industry Revenue billion Forecast, by Country 2020 & 2033
- Table 10: Global Torpedo Industry Revenue billion Forecast, by Weight 2020 & 2033
- Table 11: Global Torpedo Industry Revenue billion Forecast, by Launch Platform 2020 & 2033
- Table 12: Global Torpedo Industry Revenue billion Forecast, by Country 2020 & 2033
- Table 13: Global Torpedo Industry Revenue billion Forecast, by Weight 2020 & 2033
- Table 14: Global Torpedo Industry Revenue billion Forecast, by Launch Platform 2020 & 2033
- Table 15: Global Torpedo Industry Revenue billion Forecast, by Country 2020 & 2033
Frequently Asked Questions
1. What is the projected Compound Annual Growth Rate (CAGR) of the Torpedo Industry?
The projected CAGR is approximately 2.4%.
2. Which companies are prominent players in the Torpedo Industry?
Key companies in the market include Bharat Dynamics Limited, Raytheon Technologies Corporation, Leonardo SpA, Lockheed Martin Corporation, Naval Group, ASELSAN AS, JSC Tactical Missiles Corporation, thyssenkrupp AG, BAE Systems PLC, Mitsubishi Heavy Industries Lt, Northrop Grumman Corporation, Saab AB.
3. What are the main segments of the Torpedo Industry?
The market segments include Weight, Launch Platform.
4. Can you provide details about the market size?
The market size is estimated to be USD 1.2 billion as of 2022.
5. What are some drivers contributing to market growth?
N/A
6. What are the notable trends driving market growth?
The Sea-launched Segment Accounted for the Largest Share in the Market in 2021.
7. Are there any restraints impacting market growth?
N/A
8. Can you provide examples of recent developments in the market?
In October 2021, the Indian Defence Ministry signed a contract with the US government for the procurement of MK 54 torpedo as well as expendables such as chaff and flares for P-8I anti-submarine warfare aircraft of the Indian Navy. The contract was worth INR 423 crore (USD 56.38 million).
9. What pricing options are available for accessing the report?
Pricing options include single-user, multi-user, and enterprise licenses priced at USD 4750, USD 5250, and USD 8750 respectively.
10. Is the market size provided in terms of value or volume?
The market size is provided in terms of value, measured in billion.
11. Are there any specific market keywords associated with the report?
Yes, the market keyword associated with the report is "Torpedo Industry," which aids in identifying and referencing the specific market segment covered.
12. How do I determine which pricing option suits my needs best?
The pricing options vary based on user requirements and access needs. Individual users may opt for single-user licenses, while businesses requiring broader access may choose multi-user or enterprise licenses for cost-effective access to the report.
13. Are there any additional resources or data provided in the Torpedo Industry report?
While the report offers comprehensive insights, it's advisable to review the specific contents or supplementary materials provided to ascertain if additional resources or data are available.
14. How can I stay updated on further developments or reports in the Torpedo Industry?
To stay informed about further developments, trends, and reports in the Torpedo Industry, consider subscribing to industry newsletters, following relevant companies and organizations, or regularly checking reputable industry news sources and publications.
Methodology
Step 1 - Identification of Relevant Samples Size from Population Database


Step 2 - Approaches for Defining Global Market Size (Value, Volume* & Price*)

Note*: In applicable scenarios
Step 3 - Data Sources
Primary Research
- Web Analytics
- Survey Reports
- Research Institute
- Latest Research Reports
- Opinion Leaders
Secondary Research
- Annual Reports
- White Paper
- Latest Press Release
- Industry Association
- Paid Database
- Investor Presentations

Step 4 - Data Triangulation
Involves using different sources of information in order to increase the validity of a study
These sources are likely to be stakeholders in a program - participants, other researchers, program staff, other community members, and so on.
Then we put all data in single framework & apply various statistical tools to find out the dynamic on the market.
During the analysis stage, feedback from the stakeholder groups would be compared to determine areas of agreement as well as areas of divergence