

Key Insights
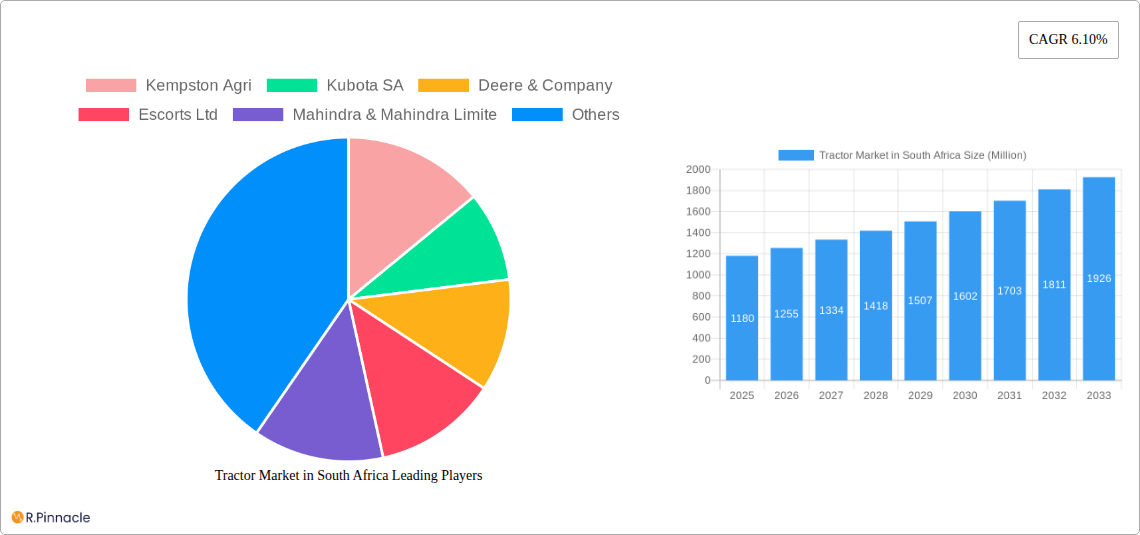
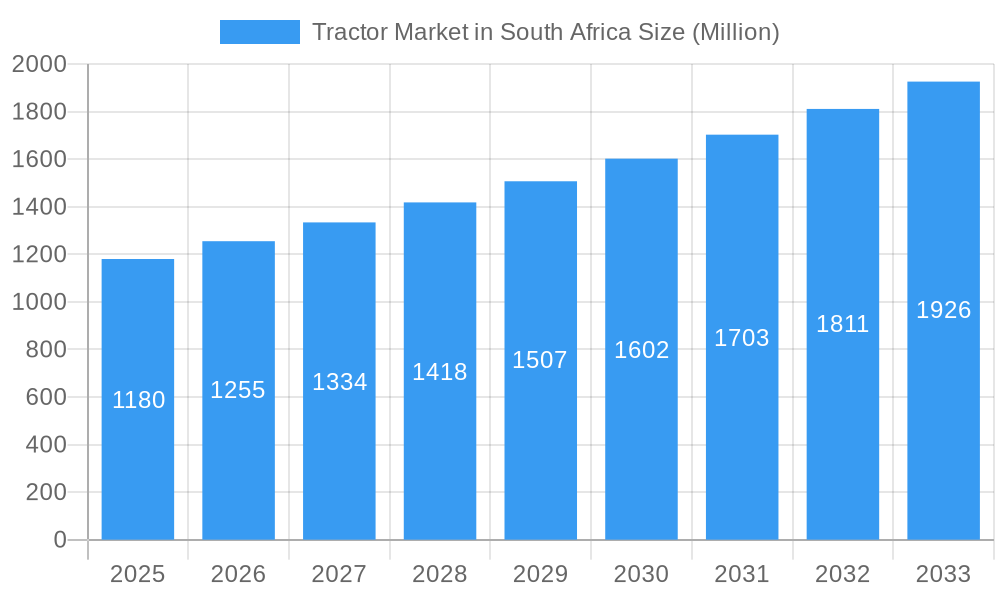
The South African tractor market, valued at $1.18 billion in 2025, is projected to experience robust growth, driven by increasing agricultural activities, government initiatives promoting mechanization, and rising demand for efficient farming practices. A Compound Annual Growth Rate (CAGR) of 6.10% is anticipated from 2025 to 2033, indicating a significant expansion in market size over the forecast period. Key growth drivers include the modernization of farming techniques, the need for increased crop yields to meet growing food demands, and the expansion of large-scale commercial farming operations. The market is segmented by engine power, with the 35-50 HP segment likely holding a significant share due to its suitability for a wide range of agricultural tasks and its affordability for many South African farmers. However, the higher HP segments are also expected to witness substantial growth fueled by the adoption of larger-scale farming and increased mechanization needs in certain regions. Competition is fierce, with major players like Kubota, Deere & Company, Mahindra & Mahindra, and Escorts Ltd vying for market share. Potential restraints could include economic fluctuations, infrastructure limitations impacting access to certain regions, and the availability of financing options for purchasing new equipment. The South African government's policies and initiatives related to agricultural development will play a vital role in shaping the market's future trajectory.
Tractor Market in South Africa Market Size (In Billion)
Despite the positive growth outlook, challenges remain. Fluctuations in commodity prices and the availability of credit could influence farmer investment decisions. Furthermore, the uneven distribution of agricultural land and resources might create regional disparities in tractor adoption. The market's success hinges on continued government support for agricultural modernization, improved infrastructure in rural areas, and the provision of accessible and affordable financing options for farmers, particularly smallholder farmers. The evolving technological landscape, with the introduction of smart farming technologies and precision agriculture tools integrated into tractors, presents significant growth opportunities for manufacturers and promises enhanced productivity for the South African agricultural sector. The focus on fuel efficiency and environmentally friendly technologies will also play a vital role in shaping future market trends.
Tractor Market in South Africa Company Market Share
Tractor Market in South Africa: A Comprehensive Report (2019-2033)
This in-depth report provides a comprehensive analysis of the South African tractor market, covering market dynamics, key players, and future growth prospects. The study period spans from 2019 to 2033, with a focus on the base year 2025 and a forecast period of 2025-2033. This report is crucial for industry professionals, investors, and anyone seeking to understand the complexities and opportunities within this vital sector of the South African economy. The report utilizes the latest data and insights to provide actionable intelligence for strategic decision-making. Expected market size values are in Millions (USD).
Tractor Market in South Africa Market Structure & Innovation Trends
This section analyzes the competitive landscape, innovation drivers, and regulatory aspects of the South African tractor market. The market is characterized by a moderate level of concentration, with key players such as Deere & Company, Mahindra & Mahindra Limited, and Kubota SA holding significant market share, estimated at xx%, xx%, and xx% respectively in 2025. However, smaller players like Kempston Agri and Argo Tractors SpA also contribute significantly to the overall market.
The South African tractor market is influenced by various factors, including government agricultural policies promoting mechanization and the growing demand from large-scale commercial farms. Innovation is driven by the need for fuel efficiency, improved productivity, and advanced technological integration. Regulatory frameworks related to emissions and safety standards also play a crucial role. Product substitutes, such as manual labor or smaller-scale machinery, are limited due to the increasing scale of farming operations. End-user demographics are skewed toward large commercial farms in regions with favorable climate conditions. M&A activity has been moderate in recent years, with smaller deals focused on regional expansion and technology acquisition. Total M&A deal value in the last five years is estimated at $xx Million.
Tractor Market in South Africa Market Dynamics & Trends
The South African tractor market is experiencing significant growth, driven by factors such as increasing agricultural production, government initiatives to support mechanization, and rising disposable incomes among farmers. The market is projected to grow at a CAGR of xx% during the forecast period (2025-2033). This growth is influenced by the adoption of advanced technologies such as precision farming and GPS-guided systems, leading to increased efficiency and productivity. Consumer preferences are shifting towards tractors with higher horsepower, advanced features, and improved fuel efficiency. The competitive landscape is characterized by both domestic and international players, resulting in increased product differentiation and price competition. Market penetration of technologically advanced tractors is slowly increasing but remains low, and is expected to increase in the forecast years.
Dominant Regions & Segments in Tractor Market in South Africa
While data on precise regional dominance is limited, the most significant demand for tractors is concentrated in agricultural regions known for large-scale farming operations such as xx and xx. These regions have strong infrastructure and favorable climate conditions which support significant tractor usage.
- Engine Power:
- Less than 35 HP: This segment caters to smallholder farmers and is experiencing relatively slower growth compared to higher horsepower segments. Key driver: affordability and suitability for smaller farms.
- 35 to 50 HP: A significant segment fueled by the need for efficient and versatile tractors on medium-sized farms. Key driver: versatility and cost-effectiveness.
- 51 to 75 HP: This segment is witnessing robust growth due to increasing adoption by medium and large farms. Key driver: improved productivity for larger-scale operations.
- 76 to 100 HP: This is a high-growth segment driven by the preference for efficient and powerful tractors in large-scale commercial operations. Key drivers: scale of operations and the need for improved speed and power.
- Above 100 HP: This premium segment exhibits substantial growth driven by the demand from large farms, driven by specialized applications and increased operational efficiency. Key drivers: specialized agricultural practices and improved efficiency.
Tractor Market in South Africa Product Innovations
Recent product innovations focus on increased fuel efficiency, enhanced power, and advanced technological integration. Tractors with GPS-guided systems, precision farming capabilities, and improved safety features are gaining traction. The market is also witnessing the introduction of tractors powered by alternative fuels, though adoption remains limited currently. These innovations aim to enhance operational efficiency and reduce the environmental impact.
Report Scope & Segmentation Analysis
This report comprehensively segments the South African tractor market by engine power: Less than 35 HP, 35 to 50 HP, 51 to 75 HP, 76 to 100 HP, and Above 100 HP. Each segment's growth projection, market size (in Millions), and competitive dynamics are thoroughly analyzed. The market size for each segment varies considerably, with the higher HP segments demonstrating higher growth rates and a larger market share than the lower HP segments. Competition is intense across all segments, with major players vying for market share through technological advancements, pricing strategies, and expansion initiatives.
Key Drivers of Tractor Market in South Africa Growth
Growth in the South African tractor market is propelled by several key factors: Government initiatives to encourage agricultural mechanization, increasing demand for higher-yielding crops, rising farm sizes, and investments in agricultural infrastructure. The adoption of precision farming techniques and improved access to financing also contribute to market expansion. Furthermore, technological advancements in tractor design and functionalities play a significant role in driving market growth.
Challenges in the Tractor Market in South Africa Sector
The South African tractor market faces various challenges including high import duties, fluctuating fuel prices, and the impact of economic cycles on farmer investments. Supply chain disruptions, particularly post-pandemic, also impacted the availability and pricing of tractors. Furthermore, competition among established players is fierce, leading to pricing pressures. These factors pose significant threats to the steady growth of the market.
Emerging Opportunities in Tractor Market in South Africa
Opportunities exist in the adoption of precision agriculture, the increasing demand for fuel-efficient tractors, and the potential for expansion into underserved regions. Moreover, government support for agricultural modernization and the development of new agricultural technologies present considerable growth potential. The growing emphasis on sustainable farming practices also presents opportunities for manufacturers of environmentally friendly tractors.
Leading Players in the Tractor Market in South Africa Market
- Kempston Agri
- Kubota SA
- Deere & Company
- Escorts Ltd
- Mahindra & Mahindra Limited
- CNH Industrial America LLC
- Argo Tractors SpA
- AGCO Corporation
Key Developments in Tractor Market in South Africa Industry
- November 2021: Mahindra South Africa (SA) launched a new range of tractors and farm equipment, expanding its product portfolio and enhancing its market presence.
- August 2022: Deere & Company's investment in Hello Tractor signifies a growing interest in leveraging technology to improve agricultural efficiency and access to resources for smallholder farmers.
- June 2022: Argo Tractors South Africa's new head office inauguration demonstrates the company's commitment to the South African market and its confidence in future growth. This investment reflects a broader trend of enhanced production capacity and focus on the South African Market.
Future Outlook for Tractor Market in South Africa Market
The South African tractor market is poised for continued growth, driven by factors such as increasing agricultural investment, technological advancements, and government support. Strategic opportunities exist for companies to leverage technology and innovation to improve product offerings, expand into new markets, and cater to the evolving needs of South African farmers. The focus on sustainability and efficiency will be key to success in the future.
Tractor Market in South Africa Segmentation
-
1. Engine Power
- 1.1. Less than 35 HP
- 1.2. 35 to 50 HP
- 1.3. 51 to 75 HP
- 1.4. 76 to 100 HP
- 1.5. Above 100 HP
-
2. Geography
- 2.1. South Africa
- 2.2. Kenya
- 2.3. Egypt
- 2.4. Rest of Africa
-
3. Engine Power
- 3.1. Less than 35 HP
- 3.2. 35 to 50 HP
- 3.3. 51 to 75 HP
- 3.4. 76 to 100 HP
- 3.5. Above 100 HP
Tractor Market in South Africa Segmentation By Geography
- 1. South Africa
- 2. Kenya
- 3. Egypt
- 4. Rest of Africa
Tractor Market in South Africa Regional Market Share
Geographic Coverage of Tractor Market in South Africa
Tractor Market in South Africa REPORT HIGHLIGHTS
| Aspects | Details |
|---|---|
| Study Period | 2020-2034 |
| Base Year | 2025 |
| Estimated Year | 2026 |
| Forecast Period | 2026-2034 |
| Historical Period | 2020-2025 |
| Growth Rate | CAGR of 6.10% from 2020-2034 |
| Segmentation |
|
Table of Contents
- 1. Introduction
- 1.1. Research Scope
- 1.2. Market Segmentation
- 1.3. Research Objective
- 1.4. Definitions and Assumptions
- 2. Executive Summary
- 2.1. Market Snapshot
- 3. Market Dynamics
- 3.1. Market Drivers
- 3.2. Market Restrains
- 3.3. Market Trends
- 3.4. Market Opportunities
- 4. Market Factor Analysis
- 4.1. Porters Five Forces
- 4.1.1. Bargaining Power of Suppliers
- 4.1.2. Bargaining Power of Buyers
- 4.1.3. Threat of New Entrants
- 4.1.4. Threat of Substitutes
- 4.1.5. Competitive Rivalry
- 4.2. PESTEL analysis
- 4.3. BCG Analysis
- 4.3.1. Stars (High Growth, High Market Share)
- 4.3.2. Cash Cows (Low Growth, High Market Share)
- 4.3.3. Question Mark (High Growth, Low Market Share)
- 4.3.4. Dogs (Low Growth, Low Market Share)
- 4.4. Ansoff Matrix Analysis
- 4.5. Supply Chain Analysis
- 4.6. Regulatory Landscape
- 4.7. Current Market Potential and Opportunity Assessment (TAM–SAM–SOM Framework)
- 4.8. PRI Analyst Note
- 4.1. Porters Five Forces
- 5. Market Analysis, Insights and Forecast 2021-2033
- 5.1. Market Analysis, Insights and Forecast - by Engine Power
- 5.1.1. Less than 35 HP
- 5.1.2. 35 to 50 HP
- 5.1.3. 51 to 75 HP
- 5.1.4. 76 to 100 HP
- 5.1.5. Above 100 HP
- 5.2. Market Analysis, Insights and Forecast - by Geography
- 5.2.1. South Africa
- 5.2.2. Kenya
- 5.2.3. Egypt
- 5.2.4. Rest of Africa
- 5.3. Market Analysis, Insights and Forecast - by Engine Power
- 5.3.1. Less than 35 HP
- 5.3.2. 35 to 50 HP
- 5.3.3. 51 to 75 HP
- 5.3.4. 76 to 100 HP
- 5.3.5. Above 100 HP
- 5.4. Market Analysis, Insights and Forecast - by Region
- 5.4.1. South Africa
- 5.4.2. Kenya
- 5.4.3. Egypt
- 5.4.4. Rest of Africa
- 5.1. Market Analysis, Insights and Forecast - by Engine Power
- 6. Tractor Market in South Africa Analysis, Insights and Forecast, 2021-2033
- 6.1. Market Analysis, Insights and Forecast - by Engine Power
- 6.1.1. Less than 35 HP
- 6.1.2. 35 to 50 HP
- 6.1.3. 51 to 75 HP
- 6.1.4. 76 to 100 HP
- 6.1.5. Above 100 HP
- 6.2. Market Analysis, Insights and Forecast - by Geography
- 6.2.1. South Africa
- 6.2.2. Kenya
- 6.2.3. Egypt
- 6.2.4. Rest of Africa
- 6.3. Market Analysis, Insights and Forecast - by Engine Power
- 6.3.1. Less than 35 HP
- 6.3.2. 35 to 50 HP
- 6.3.3. 51 to 75 HP
- 6.3.4. 76 to 100 HP
- 6.3.5. Above 100 HP
- 6.1. Market Analysis, Insights and Forecast - by Engine Power
- 7. South Africa Tractor Market in South Africa Analysis, Insights and Forecast, 2020-2032
- 7.1. Market Analysis, Insights and Forecast - by Engine Power
- 7.1.1. Less than 35 HP
- 7.1.2. 35 to 50 HP
- 7.1.3. 51 to 75 HP
- 7.1.4. 76 to 100 HP
- 7.1.5. Above 100 HP
- 7.2. Market Analysis, Insights and Forecast - by Geography
- 7.2.1. South Africa
- 7.2.2. Kenya
- 7.2.3. Egypt
- 7.2.4. Rest of Africa
- 7.3. Market Analysis, Insights and Forecast - by Engine Power
- 7.3.1. Less than 35 HP
- 7.3.2. 35 to 50 HP
- 7.3.3. 51 to 75 HP
- 7.3.4. 76 to 100 HP
- 7.3.5. Above 100 HP
- 7.1. Market Analysis, Insights and Forecast - by Engine Power
- 8. Kenya Tractor Market in South Africa Analysis, Insights and Forecast, 2020-2032
- 8.1. Market Analysis, Insights and Forecast - by Engine Power
- 8.1.1. Less than 35 HP
- 8.1.2. 35 to 50 HP
- 8.1.3. 51 to 75 HP
- 8.1.4. 76 to 100 HP
- 8.1.5. Above 100 HP
- 8.2. Market Analysis, Insights and Forecast - by Geography
- 8.2.1. South Africa
- 8.2.2. Kenya
- 8.2.3. Egypt
- 8.2.4. Rest of Africa
- 8.3. Market Analysis, Insights and Forecast - by Engine Power
- 8.3.1. Less than 35 HP
- 8.3.2. 35 to 50 HP
- 8.3.3. 51 to 75 HP
- 8.3.4. 76 to 100 HP
- 8.3.5. Above 100 HP
- 8.1. Market Analysis, Insights and Forecast - by Engine Power
- 9. Egypt Tractor Market in South Africa Analysis, Insights and Forecast, 2020-2032
- 9.1. Market Analysis, Insights and Forecast - by Engine Power
- 9.1.1. Less than 35 HP
- 9.1.2. 35 to 50 HP
- 9.1.3. 51 to 75 HP
- 9.1.4. 76 to 100 HP
- 9.1.5. Above 100 HP
- 9.2. Market Analysis, Insights and Forecast - by Geography
- 9.2.1. South Africa
- 9.2.2. Kenya
- 9.2.3. Egypt
- 9.2.4. Rest of Africa
- 9.3. Market Analysis, Insights and Forecast - by Engine Power
- 9.3.1. Less than 35 HP
- 9.3.2. 35 to 50 HP
- 9.3.3. 51 to 75 HP
- 9.3.4. 76 to 100 HP
- 9.3.5. Above 100 HP
- 9.1. Market Analysis, Insights and Forecast - by Engine Power
- 10. Rest of Africa Tractor Market in South Africa Analysis, Insights and Forecast, 2020-2032
- 10.1. Market Analysis, Insights and Forecast - by Engine Power
- 10.1.1. Less than 35 HP
- 10.1.2. 35 to 50 HP
- 10.1.3. 51 to 75 HP
- 10.1.4. 76 to 100 HP
- 10.1.5. Above 100 HP
- 10.2. Market Analysis, Insights and Forecast - by Geography
- 10.2.1. South Africa
- 10.2.2. Kenya
- 10.2.3. Egypt
- 10.2.4. Rest of Africa
- 10.3. Market Analysis, Insights and Forecast - by Engine Power
- 10.3.1. Less than 35 HP
- 10.3.2. 35 to 50 HP
- 10.3.3. 51 to 75 HP
- 10.3.4. 76 to 100 HP
- 10.3.5. Above 100 HP
- 10.1. Market Analysis, Insights and Forecast - by Engine Power
- 11. Competitive Analysis
- 11.1. Company Profiles
- 11.1.1 Kempston Agri
- 11.1.1.1. Company Overview
- 11.1.1.2. Products
- 11.1.1.3. Company Financials
- 11.1.1.4. SWOT Analysis
- 11.1.2 Kubota SA
- 11.1.2.1. Company Overview
- 11.1.2.2. Products
- 11.1.2.3. Company Financials
- 11.1.2.4. SWOT Analysis
- 11.1.3 Deere & Company
- 11.1.3.1. Company Overview
- 11.1.3.2. Products
- 11.1.3.3. Company Financials
- 11.1.3.4. SWOT Analysis
- 11.1.4 Escorts Ltd
- 11.1.4.1. Company Overview
- 11.1.4.2. Products
- 11.1.4.3. Company Financials
- 11.1.4.4. SWOT Analysis
- 11.1.5 Mahindra & Mahindra Limite
- 11.1.5.1. Company Overview
- 11.1.5.2. Products
- 11.1.5.3. Company Financials
- 11.1.5.4. SWOT Analysis
- 11.1.6 CNH Industrial America LLC
- 11.1.6.1. Company Overview
- 11.1.6.2. Products
- 11.1.6.3. Company Financials
- 11.1.6.4. SWOT Analysis
- 11.1.7 Argo Tractors SpA
- 11.1.7.1. Company Overview
- 11.1.7.2. Products
- 11.1.7.3. Company Financials
- 11.1.7.4. SWOT Analysis
- 11.1.8 AGCO Corporation
- 11.1.8.1. Company Overview
- 11.1.8.2. Products
- 11.1.8.3. Company Financials
- 11.1.8.4. SWOT Analysis
- 11.1.1 Kempston Agri
- 11.2. Market Entropy
- 11.2.1 Company's Key Areas Served
- 11.2.2 Recent Developments
- 11.3. Company Market Share Analysis 2025
- 11.3.1 Top 5 Companies Market Share Analysis
- 11.3.2 Top 3 Companies Market Share Analysis
- 11.4. List of Potential Customers
- 12. Research Methodology
List of Figures
- Figure 1: Tractor Market in South Africa Revenue Breakdown (Million, %) by Product 2025 & 2033
- Figure 2: Tractor Market in South Africa Share (%) by Company 2025
List of Tables
- Table 1: Tractor Market in South Africa Revenue Million Forecast, by Engine Power 2020 & 2033
- Table 2: Tractor Market in South Africa Revenue Million Forecast, by Geography 2020 & 2033
- Table 3: Tractor Market in South Africa Revenue Million Forecast, by Engine Power 2020 & 2033
- Table 4: Tractor Market in South Africa Revenue Million Forecast, by Region 2020 & 2033
- Table 5: Tractor Market in South Africa Revenue Million Forecast, by Engine Power 2020 & 2033
- Table 6: Tractor Market in South Africa Revenue Million Forecast, by Geography 2020 & 2033
- Table 7: Tractor Market in South Africa Revenue Million Forecast, by Engine Power 2020 & 2033
- Table 8: Tractor Market in South Africa Revenue Million Forecast, by Country 2020 & 2033
- Table 9: Tractor Market in South Africa Revenue Million Forecast, by Engine Power 2020 & 2033
- Table 10: Tractor Market in South Africa Revenue Million Forecast, by Geography 2020 & 2033
- Table 11: Tractor Market in South Africa Revenue Million Forecast, by Engine Power 2020 & 2033
- Table 12: Tractor Market in South Africa Revenue Million Forecast, by Country 2020 & 2033
- Table 13: Tractor Market in South Africa Revenue Million Forecast, by Engine Power 2020 & 2033
- Table 14: Tractor Market in South Africa Revenue Million Forecast, by Geography 2020 & 2033
- Table 15: Tractor Market in South Africa Revenue Million Forecast, by Engine Power 2020 & 2033
- Table 16: Tractor Market in South Africa Revenue Million Forecast, by Country 2020 & 2033
- Table 17: Tractor Market in South Africa Revenue Million Forecast, by Engine Power 2020 & 2033
- Table 18: Tractor Market in South Africa Revenue Million Forecast, by Geography 2020 & 2033
- Table 19: Tractor Market in South Africa Revenue Million Forecast, by Engine Power 2020 & 2033
- Table 20: Tractor Market in South Africa Revenue Million Forecast, by Country 2020 & 2033
Frequently Asked Questions
1. What is the projected Compound Annual Growth Rate (CAGR) of the Tractor Market in South Africa?
The projected CAGR is approximately 6.10%.
2. Which companies are prominent players in the Tractor Market in South Africa?
Key companies in the market include Kempston Agri, Kubota SA, Deere & Company, Escorts Ltd, Mahindra & Mahindra Limite, CNH Industrial America LLC, Argo Tractors SpA, AGCO Corporation.
3. What are the main segments of the Tractor Market in South Africa?
The market segments include Engine Power, Geography, Engine Power.
4. Can you provide details about the market size?
The market size is estimated to be USD 1.18 Million as of 2022.
5. What are some drivers contributing to market growth?
Increasing Demand for Tomato; Adoption of Greenhouse Technology in Tomato Cultivation; Government support.
6. What are the notable trends driving market growth?
Increasing Focus on Sustainable Agricultural Mechanization.
7. Are there any restraints impacting market growth?
Increasing Loses due to Physiological Disorder. Pest and Disease; Unfavourable Climatic Condition.
8. Can you provide examples of recent developments in the market?
June 2022: Agricultural vehicle supplier Argo Tractors South Africa inaugurated its new head office in South Africa. The new premise was built at the cost of USD 5. 88 million, hosts a 6000 square meter building, including office space, a 650 square meter showroom, a 100 square meter training facility, 2300 square meters dedicated to assembly, and 2000 square meters designated for spares.
9. What pricing options are available for accessing the report?
Pricing options include single-user, multi-user, and enterprise licenses priced at USD 4750, USD 5250, and USD 8750 respectively.
10. Is the market size provided in terms of value or volume?
The market size is provided in terms of value, measured in Million.
11. Are there any specific market keywords associated with the report?
Yes, the market keyword associated with the report is "Tractor Market in South Africa," which aids in identifying and referencing the specific market segment covered.
12. How do I determine which pricing option suits my needs best?
The pricing options vary based on user requirements and access needs. Individual users may opt for single-user licenses, while businesses requiring broader access may choose multi-user or enterprise licenses for cost-effective access to the report.
13. Are there any additional resources or data provided in the Tractor Market in South Africa report?
While the report offers comprehensive insights, it's advisable to review the specific contents or supplementary materials provided to ascertain if additional resources or data are available.
14. How can I stay updated on further developments or reports in the Tractor Market in South Africa?
To stay informed about further developments, trends, and reports in the Tractor Market in South Africa, consider subscribing to industry newsletters, following relevant companies and organizations, or regularly checking reputable industry news sources and publications.
Methodology
Step 1 - Identification of Relevant Samples Size from Population Database


Step 2 - Approaches for Defining Global Market Size (Value, Volume* & Price*)

Note*: In applicable scenarios
Step 3 - Data Sources
Primary Research
- Web Analytics
- Survey Reports
- Research Institute
- Latest Research Reports
- Opinion Leaders
Secondary Research
- Annual Reports
- White Paper
- Latest Press Release
- Industry Association
- Paid Database
- Investor Presentations

Step 4 - Data Triangulation
Involves using different sources of information in order to increase the validity of a study
These sources are likely to be stakeholders in a program - participants, other researchers, program staff, other community members, and so on.
Then we put all data in single framework & apply various statistical tools to find out the dynamic on the market.
During the analysis stage, feedback from the stakeholder groups would be compared to determine areas of agreement as well as areas of divergence