

Key Insights
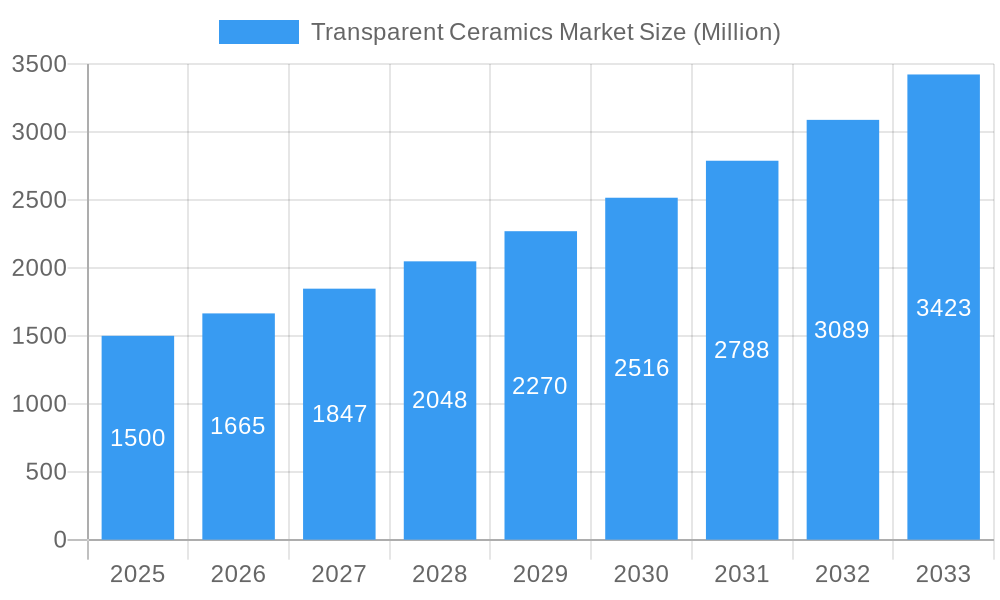
The transparent ceramics market is experiencing robust growth, projected to exceed a market size of $XX million by 2025 and exhibiting a Compound Annual Growth Rate (CAGR) of over 11% from 2025 to 2033. This expansion is fueled by increasing demand across diverse sectors. The aerospace and defense industry is a significant driver, utilizing transparent ceramics for high-performance windows and protective shields in aircraft and military applications. Simultaneously, the healthcare sector's adoption of transparent ceramics in medical imaging and laser surgery is accelerating market growth. Technological advancements in material science, enabling the production of larger, higher-quality transparent ceramic components with enhanced optical properties, further contribute to market expansion. The crystalline structure type currently dominates the market due to its superior optical and mechanical characteristics, while Sapphire and Yttrium Aluminum Garnet (YAG) are leading materials due to their exceptional transparency and durability. However, ongoing research into alternative materials like Aluminum Oxynitride and Yttria-stabilized zirconia (YSZ) presents opportunities for future market diversification. Geographic expansion is also a notable factor, with the Asia Pacific region expected to maintain a substantial market share driven by increasing industrialization and technological advancements in countries like China and India. Despite these positive trends, challenges remain, including high manufacturing costs and potential supply chain disruptions that could influence market dynamics in the coming years.
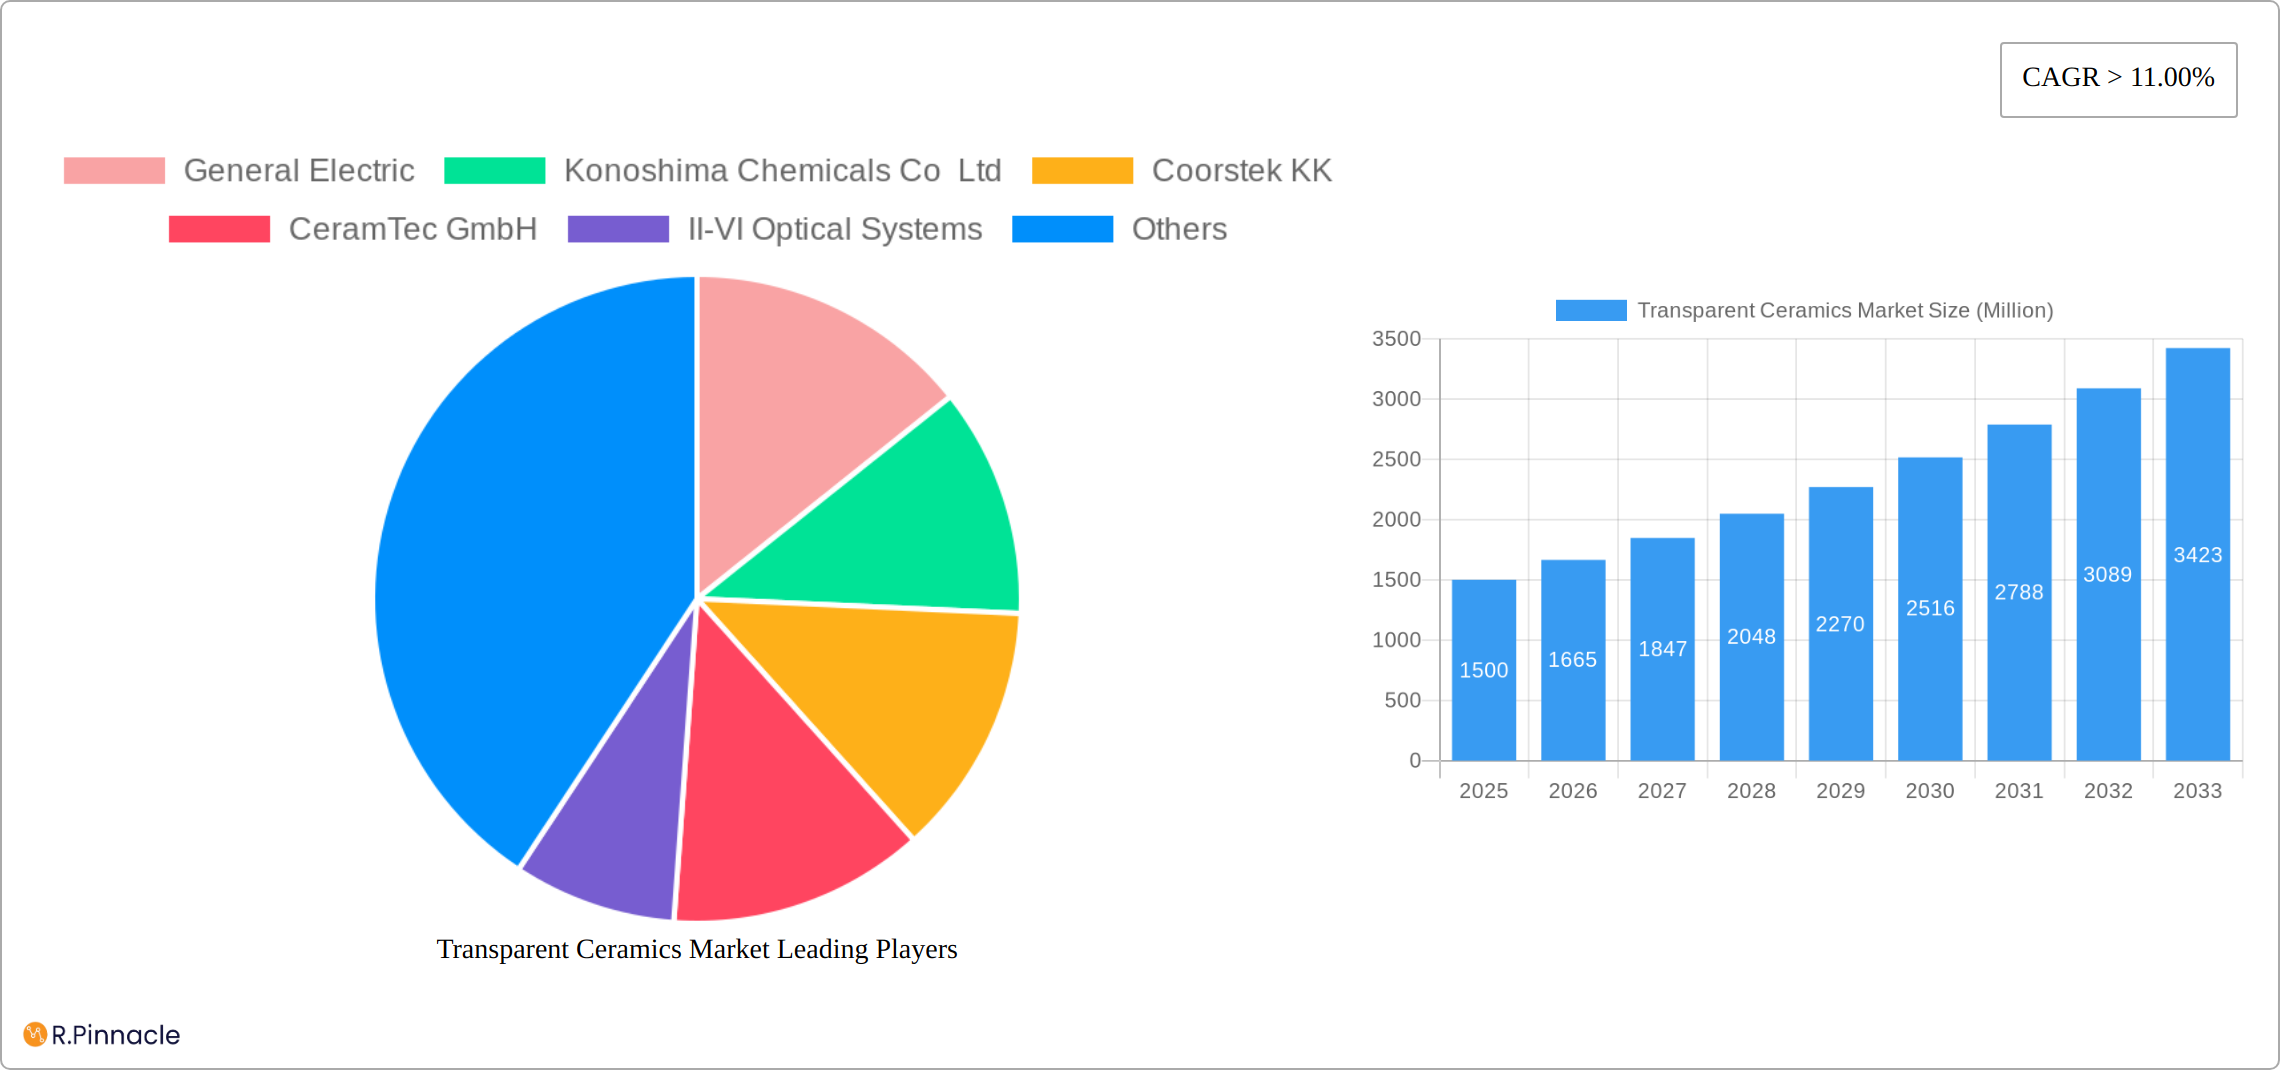
Transparent Ceramics Market Market Size (In Billion)
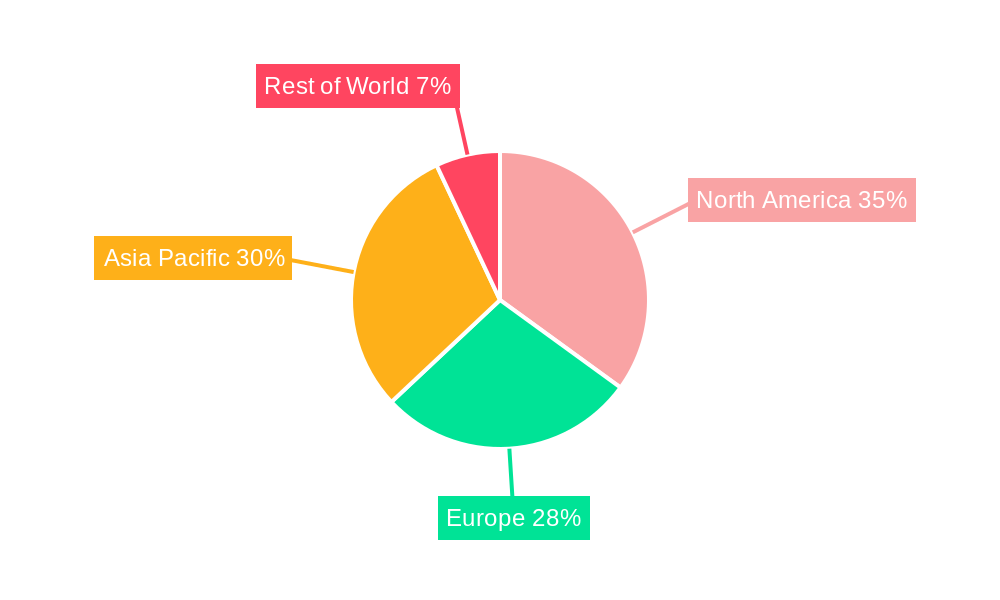
The transparent ceramics market's segmentation offers nuanced insights into growth drivers. The Aerospace and Defense segment leads in terms of revenue, reflecting the critical need for durable, high-performance materials. However, the Healthcare segment is anticipated to showcase the fastest growth rate due to ongoing technological innovations in medical devices and procedures. Material-wise, Sapphire remains dominant due to its superior optical properties and strength, but YAG is gaining traction in specialized applications. Regionally, North America currently holds a significant share, attributable to established manufacturing bases and strong technological infrastructure. However, the Asia-Pacific region is expected to experience the most significant growth, fueled by burgeoning industrialization and increasing investment in advanced technologies. Competition in the market is robust, with key players like General Electric, Coorstek KK, and CeramTec GmbH continually investing in research and development, striving for improved performance and cost-effectiveness. The ongoing expansion in applications across various sectors points to continued market growth and exciting opportunities in the coming years.
Transparent Ceramics Market Company Market Share
Transparent Ceramics Market: A Comprehensive Report (2019-2033)
This in-depth report provides a comprehensive analysis of the Transparent Ceramics Market, offering invaluable insights for industry professionals, investors, and strategic decision-makers. The study covers the period from 2019 to 2033, with a focus on the forecast period from 2025 to 2033 and a base year of 2025. The report leverages extensive data analysis to uncover key trends, challenges, and opportunities within this dynamic market, reaching a projected value of xx Million by 2033.
Transparent Ceramics Market Market Structure & Innovation Trends
This section provides a comprehensive analysis of the competitive landscape within the Transparent Ceramics Market. We meticulously examine market concentration, dissect the primary drivers of innovation, and evaluate the impact of prevailing regulatory frameworks and overarching industry dynamics. Our analysis extends to the profound influence of mergers and acquisitions (M&A) activities, offering a detailed breakdown of deal values and their subsequent effect on market share evolution. Furthermore, the report investigates the competitive threat posed by product substitutes and explores the shifting demographics of end-user bases.
- Market Concentration: An in-depth analysis of market share distribution among key players, revealing the current level of competition and the potential for future consolidation. For instance, our projections indicate that the top 5 leading players are anticipated to collectively command approximately [Insert Projected Percentage]% of the global market share by 2025.
- Innovation Drivers: A thorough examination of pivotal technological advancements, strategic R&D investments, and supportive government initiatives that are actively fueling innovation across the industry. This includes a dedicated focus on groundbreaking materials science discoveries and their transformative impact on enhancing product performance and functionality.
- Regulatory Frameworks: A critical assessment of the prevailing regulatory landscape and its multifaceted impact on market expansion, encompassing an evaluation of compliance costs, environmental regulations, and evolving industry standards.
- M&A Activities: A detailed review of significant mergers and acquisitions, including their substantial financial implications, with cumulative deal values reaching an estimated [Insert Total Deal Value] Million over the past five years, and their consequent realignment of market power dynamics.
- Product Substitutes: An insightful analysis of alternative materials and competing technologies that present a competitive challenge to transparent ceramics, along with an estimation of their potential market penetration and adoption rates.
Transparent Ceramics Market Market Dynamics & Trends
This section offers a comprehensive overview of the market dynamics, exploring key growth drivers, technological disruptions, evolving consumer preferences, and the competitive landscape. The analysis incorporates key metrics such as CAGR and market penetration rates, providing a robust understanding of market evolution. We project a CAGR of xx% from 2025 to 2033 for the overall market. This growth will be influenced by factors such as increasing demand from various sectors and advancements in material science.
Dominant Regions & Segments in Transparent Ceramics Market
This section pinpoints the leading geographical regions, key countries, and dominant market segments within the dynamic transparent ceramics industry. We conduct a performance analysis across various material types, including Sapphire, Yttrium Aluminum Garnet (YAG), Aluminum Oxynitride, Yttria-stabilized zirconia (YSZ), Spinel, and Other Materials. Our analysis also covers diverse applications such as Aerospace and Defense, Mechanical and Chemical, Healthcare, Consumer Goods, Energy, and Other Applications, as well as structural classifications including Crystalline and Non-crystalline.
- Leading Regions: A comprehensive breakdown of regional market leadership, with a specific focus on the critical factors propelling growth in distinct geographical areas. For example, North America is projected to retain the largest market share in 2025, primarily driven by its robust and continuously expanding aerospace and defense industry, coupled with significant investments in advanced optics.
- Dominant Segments: Identification of the fastest-growing segments across material types, applications, and structures, offering valuable insights into burgeoning market opportunities and strategic investment areas. For instance, the Sapphire segment is anticipated to experience exceptional growth, largely attributable to its unparalleled optical properties and the escalating demand for its application in advanced consumer electronics and high-performance imaging systems.
- Key Drivers (by region and segment):
- Proactive economic policies actively supporting and incentivizing advanced manufacturing sectors.
- Substantial and ongoing investments in the development of robust infrastructure to facilitate advanced material production and deployment.
- Favorable and progressive regulatory environments that encourage research, development, and commercialization of new technologies.
- Increasing adoption in high-tech sectors like telecommunications and defense, driven by demand for high-performance optical components.
- Growth in the medical device industry, necessitating biocompatible and high-clarity materials for implants and diagnostic equipment.
Transparent Ceramics Market Product Innovations
This section synthesizes recent and impactful product developments, with a keen emphasis on pioneering applications and the unique competitive advantages they offer. The analysis critically highlights emerging technological trends that are actively shaping market demand and their crucial influence on achieving optimal market fit. For example, significant advancements in materials synthesis techniques are enabling the development and production of more resilient, cost-effective, and high-performance transparent ceramic components tailored for demanding environments.
Report Scope & Segmentation Analysis
This report provides a detailed segmentation analysis of the Transparent Ceramics Market, covering Material, Application, and Structure. Each segment's growth projections, market size estimations, and competitive dynamics are included.
- Material: Detailed analysis of each material type, including market size, growth projections, and competitive dynamics.
- Application: In-depth examination of market size and growth forecasts for each application segment, highlighting key drivers and challenges.
- Structure: Assessment of the crystalline and non-crystalline segments, focusing on market size, growth potential, and future trends.
Key Drivers of Transparent Ceramics Market Growth
Key drivers propelling the growth of the transparent ceramics market include technological advancements, economic growth in key sectors (particularly aerospace and defense), and supportive regulatory frameworks promoting innovation and adoption of advanced materials. These factors are creating a favorable environment for market expansion.
Challenges in the Transparent Ceramics Market Sector
Challenges facing the transparent ceramics market include high production costs, complex manufacturing processes, and competition from alternative materials. These factors can hinder market growth and necessitate strategic responses from market participants. Supply chain disruptions also pose a significant challenge, affecting production capacity and delivery timelines.
Emerging Opportunities in Transparent Ceramics Market
Emerging opportunities within the transparent ceramics market are vast and transformative. These include strategic expansion into novel application areas such as augmented reality (AR) and virtual reality (VR) displays, as well as sophisticated advanced medical devices requiring unparalleled clarity and biocompatibility. Furthermore, significant strides in additive manufacturing (3D printing) techniques present substantial potential for unprecedented growth, driving enhanced production efficiency, greater design flexibility, and advanced customization capabilities. The escalating global demand for energy-efficient solutions is also a key catalyst, boosting the adoption of transparent ceramics across a broad spectrum of energy-related applications, from advanced solar technologies to energy-saving lighting solutions.
Leading Players in the Transparent Ceramics Market Market
- General Electric
- Konoshima Chemicals Co Ltd
- Coorstek KK
- CeramTec GmbH
- II-VI Optical Systems
- Koninklijke Philips N V
- Surmet Corporation
- Saint-Gobain Group
- Cilas
- www.optocity.com
- CeraNova
- Deisenroth Engineering GmbH
- AGC Inc
- SCHOTT AG
Key Developments in Transparent Ceramics Market Industry
- [Month, Year]: Company X launched a new transparent ceramic product with enhanced durability.
- [Month, Year]: Company Y announced a strategic partnership for joint development of next-generation transparent ceramics.
- [Month, Year]: A significant M&A deal reshaped the market landscape.
- [Month, Year]: New government regulations impacted production and market access. (Add more bullet points as needed)
Future Outlook for Transparent Ceramics Market Market
The future outlook for the transparent ceramics market remains positive, driven by technological advancements, expanding applications, and strong demand from key sectors. Strategic investments in R&D and manufacturing capacity will be crucial for maintaining a competitive edge and capturing the significant growth opportunities that lie ahead. The market is poised for substantial expansion in the coming years, presenting promising prospects for established players and new entrants alike.
Transparent Ceramics Market Segmentation
-
1. Structure
- 1.1. Crystalline
- 1.2. Non-crystalline
-
2. Material
- 2.1. Sapphire
- 2.2. Yttrium Aluminum Garnet (YAG)
- 2.3. Aluminum Oxynitride
- 2.4. Yttria-stabilized zirconia (YSZ)
- 2.5. Spinel
- 2.6. Other Materials
-
3. Application
- 3.1. Aerospace and Defense
- 3.2. Mechanical and Chemical
- 3.3. Healthcare
- 3.4. Consumer Goods
- 3.5. Energy
- 3.6. Other Applications
Transparent Ceramics Market Segmentation By Geography
-
1. Asia Pacific
- 1.1. China
- 1.2. India
- 1.3. Japan
- 1.4. South Korea
- 1.5. Australia
- 2. Rest of Asia Pacific
-
3. North America
- 3.1. United States
- 3.2. Canada
- 3.3. Mexico
- 3.4. Rest of North America
-
4. Europe
- 4.1. Germany
- 4.2. United Kingdom
- 4.3. Italy
- 4.4. France
- 4.5. Rest of Europe
-
5. South America
- 5.1. Brazil
- 5.2. Argentina
- 5.3. Rest of South America
-
6. Middle East and Africa
- 6.1. Saudi Arabia
- 6.2. South Africa
- 6.3. Rest of Middle East and Africa
Transparent Ceramics Market Regional Market Share
Geographic Coverage of Transparent Ceramics Market
Transparent Ceramics Market REPORT HIGHLIGHTS
| Aspects | Details |
|---|---|
| Study Period | 2020-2034 |
| Base Year | 2025 |
| Estimated Year | 2026 |
| Forecast Period | 2026-2034 |
| Historical Period | 2020-2025 |
| Growth Rate | CAGR of 17.6% from 2020-2034 |
| Segmentation |
|
Table of Contents
- 1. Introduction
- 1.1. Research Scope
- 1.2. Market Segmentation
- 1.3. Research Objective
- 1.4. Definitions and Assumptions
- 2. Executive Summary
- 2.1. Market Snapshot
- 3. Market Dynamics
- 3.1. Market Drivers
- 3.2. Market Restrains
- 3.3. Market Trends
- 3.4. Market Opportunities
- 4. Market Factor Analysis
- 4.1. Porters Five Forces
- 4.1.1. Bargaining Power of Suppliers
- 4.1.2. Bargaining Power of Buyers
- 4.1.3. Threat of New Entrants
- 4.1.4. Threat of Substitutes
- 4.1.5. Competitive Rivalry
- 4.2. PESTEL analysis
- 4.3. BCG Analysis
- 4.3.1. Stars (High Growth, High Market Share)
- 4.3.2. Cash Cows (Low Growth, High Market Share)
- 4.3.3. Question Mark (High Growth, Low Market Share)
- 4.3.4. Dogs (Low Growth, Low Market Share)
- 4.4. Ansoff Matrix Analysis
- 4.5. Supply Chain Analysis
- 4.6. Regulatory Landscape
- 4.7. Current Market Potential and Opportunity Assessment (TAM–SAM–SOM Framework)
- 4.8. PRI Analyst Note
- 4.1. Porters Five Forces
- 5. Market Analysis, Insights and Forecast 2021-2033
- 5.1. Market Analysis, Insights and Forecast - by Structure
- 5.1.1. Crystalline
- 5.1.2. Non-crystalline
- 5.2. Market Analysis, Insights and Forecast - by Material
- 5.2.1. Sapphire
- 5.2.2. Yttrium Aluminum Garnet (YAG)
- 5.2.3. Aluminum Oxynitride
- 5.2.4. Yttria-stabilized zirconia (YSZ)
- 5.2.5. Spinel
- 5.2.6. Other Materials
- 5.3. Market Analysis, Insights and Forecast - by Application
- 5.3.1. Aerospace and Defense
- 5.3.2. Mechanical and Chemical
- 5.3.3. Healthcare
- 5.3.4. Consumer Goods
- 5.3.5. Energy
- 5.3.6. Other Applications
- 5.4. Market Analysis, Insights and Forecast - by Region
- 5.4.1. Asia Pacific
- 5.4.2. Rest of Asia Pacific
- 5.4.3. North America
- 5.4.4. Europe
- 5.4.5. South America
- 5.4.6. Middle East and Africa
- 5.1. Market Analysis, Insights and Forecast - by Structure
- 6. Global Transparent Ceramics Market Analysis, Insights and Forecast, 2021-2033
- 6.1. Market Analysis, Insights and Forecast - by Structure
- 6.1.1. Crystalline
- 6.1.2. Non-crystalline
- 6.2. Market Analysis, Insights and Forecast - by Material
- 6.2.1. Sapphire
- 6.2.2. Yttrium Aluminum Garnet (YAG)
- 6.2.3. Aluminum Oxynitride
- 6.2.4. Yttria-stabilized zirconia (YSZ)
- 6.2.5. Spinel
- 6.2.6. Other Materials
- 6.3. Market Analysis, Insights and Forecast - by Application
- 6.3.1. Aerospace and Defense
- 6.3.2. Mechanical and Chemical
- 6.3.3. Healthcare
- 6.3.4. Consumer Goods
- 6.3.5. Energy
- 6.3.6. Other Applications
- 6.1. Market Analysis, Insights and Forecast - by Structure
- 7. Asia Pacific Transparent Ceramics Market Analysis, Insights and Forecast, 2020-2032
- 7.1. Market Analysis, Insights and Forecast - by Structure
- 7.1.1. Crystalline
- 7.1.2. Non-crystalline
- 7.2. Market Analysis, Insights and Forecast - by Material
- 7.2.1. Sapphire
- 7.2.2. Yttrium Aluminum Garnet (YAG)
- 7.2.3. Aluminum Oxynitride
- 7.2.4. Yttria-stabilized zirconia (YSZ)
- 7.2.5. Spinel
- 7.2.6. Other Materials
- 7.3. Market Analysis, Insights and Forecast - by Application
- 7.3.1. Aerospace and Defense
- 7.3.2. Mechanical and Chemical
- 7.3.3. Healthcare
- 7.3.4. Consumer Goods
- 7.3.5. Energy
- 7.3.6. Other Applications
- 7.1. Market Analysis, Insights and Forecast - by Structure
- 8. Rest of Asia Pacific Transparent Ceramics Market Analysis, Insights and Forecast, 2020-2032
- 8.1. Market Analysis, Insights and Forecast - by Structure
- 8.1.1. Crystalline
- 8.1.2. Non-crystalline
- 8.2. Market Analysis, Insights and Forecast - by Material
- 8.2.1. Sapphire
- 8.2.2. Yttrium Aluminum Garnet (YAG)
- 8.2.3. Aluminum Oxynitride
- 8.2.4. Yttria-stabilized zirconia (YSZ)
- 8.2.5. Spinel
- 8.2.6. Other Materials
- 8.3. Market Analysis, Insights and Forecast - by Application
- 8.3.1. Aerospace and Defense
- 8.3.2. Mechanical and Chemical
- 8.3.3. Healthcare
- 8.3.4. Consumer Goods
- 8.3.5. Energy
- 8.3.6. Other Applications
- 8.1. Market Analysis, Insights and Forecast - by Structure
- 9. North America Transparent Ceramics Market Analysis, Insights and Forecast, 2020-2032
- 9.1. Market Analysis, Insights and Forecast - by Structure
- 9.1.1. Crystalline
- 9.1.2. Non-crystalline
- 9.2. Market Analysis, Insights and Forecast - by Material
- 9.2.1. Sapphire
- 9.2.2. Yttrium Aluminum Garnet (YAG)
- 9.2.3. Aluminum Oxynitride
- 9.2.4. Yttria-stabilized zirconia (YSZ)
- 9.2.5. Spinel
- 9.2.6. Other Materials
- 9.3. Market Analysis, Insights and Forecast - by Application
- 9.3.1. Aerospace and Defense
- 9.3.2. Mechanical and Chemical
- 9.3.3. Healthcare
- 9.3.4. Consumer Goods
- 9.3.5. Energy
- 9.3.6. Other Applications
- 9.1. Market Analysis, Insights and Forecast - by Structure
- 10. Europe Transparent Ceramics Market Analysis, Insights and Forecast, 2020-2032
- 10.1. Market Analysis, Insights and Forecast - by Structure
- 10.1.1. Crystalline
- 10.1.2. Non-crystalline
- 10.2. Market Analysis, Insights and Forecast - by Material
- 10.2.1. Sapphire
- 10.2.2. Yttrium Aluminum Garnet (YAG)
- 10.2.3. Aluminum Oxynitride
- 10.2.4. Yttria-stabilized zirconia (YSZ)
- 10.2.5. Spinel
- 10.2.6. Other Materials
- 10.3. Market Analysis, Insights and Forecast - by Application
- 10.3.1. Aerospace and Defense
- 10.3.2. Mechanical and Chemical
- 10.3.3. Healthcare
- 10.3.4. Consumer Goods
- 10.3.5. Energy
- 10.3.6. Other Applications
- 10.1. Market Analysis, Insights and Forecast - by Structure
- 11. South America Transparent Ceramics Market Analysis, Insights and Forecast, 2020-2032
- 11.1. Market Analysis, Insights and Forecast - by Structure
- 11.1.1. Crystalline
- 11.1.2. Non-crystalline
- 11.2. Market Analysis, Insights and Forecast - by Material
- 11.2.1. Sapphire
- 11.2.2. Yttrium Aluminum Garnet (YAG)
- 11.2.3. Aluminum Oxynitride
- 11.2.4. Yttria-stabilized zirconia (YSZ)
- 11.2.5. Spinel
- 11.2.6. Other Materials
- 11.3. Market Analysis, Insights and Forecast - by Application
- 11.3.1. Aerospace and Defense
- 11.3.2. Mechanical and Chemical
- 11.3.3. Healthcare
- 11.3.4. Consumer Goods
- 11.3.5. Energy
- 11.3.6. Other Applications
- 11.1. Market Analysis, Insights and Forecast - by Structure
- 12. Middle East and Africa Transparent Ceramics Market Analysis, Insights and Forecast, 2020-2032
- 12.1. Market Analysis, Insights and Forecast - by Structure
- 12.1.1. Crystalline
- 12.1.2. Non-crystalline
- 12.2. Market Analysis, Insights and Forecast - by Material
- 12.2.1. Sapphire
- 12.2.2. Yttrium Aluminum Garnet (YAG)
- 12.2.3. Aluminum Oxynitride
- 12.2.4. Yttria-stabilized zirconia (YSZ)
- 12.2.5. Spinel
- 12.2.6. Other Materials
- 12.3. Market Analysis, Insights and Forecast - by Application
- 12.3.1. Aerospace and Defense
- 12.3.2. Mechanical and Chemical
- 12.3.3. Healthcare
- 12.3.4. Consumer Goods
- 12.3.5. Energy
- 12.3.6. Other Applications
- 12.1. Market Analysis, Insights and Forecast - by Structure
- 13. Competitive Analysis
- 13.1. Company Profiles
- 13.1.1 General Electric
- 13.1.1.1. Company Overview
- 13.1.1.2. Products
- 13.1.1.3. Company Financials
- 13.1.1.4. SWOT Analysis
- 13.1.2 Konoshima Chemicals Co Ltd
- 13.1.2.1. Company Overview
- 13.1.2.2. Products
- 13.1.2.3. Company Financials
- 13.1.2.4. SWOT Analysis
- 13.1.3 Coorstek KK
- 13.1.3.1. Company Overview
- 13.1.3.2. Products
- 13.1.3.3. Company Financials
- 13.1.3.4. SWOT Analysis
- 13.1.4 CeramTec GmbH
- 13.1.4.1. Company Overview
- 13.1.4.2. Products
- 13.1.4.3. Company Financials
- 13.1.4.4. SWOT Analysis
- 13.1.5 II-VI Optical Systems
- 13.1.5.1. Company Overview
- 13.1.5.2. Products
- 13.1.5.3. Company Financials
- 13.1.5.4. SWOT Analysis
- 13.1.6 Koninklijke Philips N V
- 13.1.6.1. Company Overview
- 13.1.6.2. Products
- 13.1.6.3. Company Financials
- 13.1.6.4. SWOT Analysis
- 13.1.7 Surmet Corporation*List Not Exhaustive
- 13.1.7.1. Company Overview
- 13.1.7.2. Products
- 13.1.7.3. Company Financials
- 13.1.7.4. SWOT Analysis
- 13.1.8 Saint-Gobain Group
- 13.1.8.1. Company Overview
- 13.1.8.2. Products
- 13.1.8.3. Company Financials
- 13.1.8.4. SWOT Analysis
- 13.1.9 Cilas
- 13.1.9.1. Company Overview
- 13.1.9.2. Products
- 13.1.9.3. Company Financials
- 13.1.9.4. SWOT Analysis
- 13.1.10 www optocity com
- 13.1.10.1. Company Overview
- 13.1.10.2. Products
- 13.1.10.3. Company Financials
- 13.1.10.4. SWOT Analysis
- 13.1.11 CeraNova
- 13.1.11.1. Company Overview
- 13.1.11.2. Products
- 13.1.11.3. Company Financials
- 13.1.11.4. SWOT Analysis
- 13.1.12 Deisenroth Engineering GmbH
- 13.1.12.1. Company Overview
- 13.1.12.2. Products
- 13.1.12.3. Company Financials
- 13.1.12.4. SWOT Analysis
- 13.1.13 AGC Inc
- 13.1.13.1. Company Overview
- 13.1.13.2. Products
- 13.1.13.3. Company Financials
- 13.1.13.4. SWOT Analysis
- 13.1.14 SCHOTT AG
- 13.1.14.1. Company Overview
- 13.1.14.2. Products
- 13.1.14.3. Company Financials
- 13.1.14.4. SWOT Analysis
- 13.1.1 General Electric
- 13.2. Market Entropy
- 13.2.1 Company's Key Areas Served
- 13.2.2 Recent Developments
- 13.3. Company Market Share Analysis 2025
- 13.3.1 Top 5 Companies Market Share Analysis
- 13.3.2 Top 3 Companies Market Share Analysis
- 13.4. List of Potential Customers
- 14. Research Methodology
List of Figures
- Figure 1: Global Transparent Ceramics Market Revenue Breakdown (million, %) by Region 2025 & 2033
- Figure 2: Asia Pacific Transparent Ceramics Market Revenue (million), by Structure 2025 & 2033
- Figure 3: Asia Pacific Transparent Ceramics Market Revenue Share (%), by Structure 2025 & 2033
- Figure 4: Asia Pacific Transparent Ceramics Market Revenue (million), by Material 2025 & 2033
- Figure 5: Asia Pacific Transparent Ceramics Market Revenue Share (%), by Material 2025 & 2033
- Figure 6: Asia Pacific Transparent Ceramics Market Revenue (million), by Application 2025 & 2033
- Figure 7: Asia Pacific Transparent Ceramics Market Revenue Share (%), by Application 2025 & 2033
- Figure 8: Asia Pacific Transparent Ceramics Market Revenue (million), by Country 2025 & 2033
- Figure 9: Asia Pacific Transparent Ceramics Market Revenue Share (%), by Country 2025 & 2033
- Figure 10: Rest of Asia Pacific Transparent Ceramics Market Revenue (million), by Structure 2025 & 2033
- Figure 11: Rest of Asia Pacific Transparent Ceramics Market Revenue Share (%), by Structure 2025 & 2033
- Figure 12: Rest of Asia Pacific Transparent Ceramics Market Revenue (million), by Material 2025 & 2033
- Figure 13: Rest of Asia Pacific Transparent Ceramics Market Revenue Share (%), by Material 2025 & 2033
- Figure 14: Rest of Asia Pacific Transparent Ceramics Market Revenue (million), by Application 2025 & 2033
- Figure 15: Rest of Asia Pacific Transparent Ceramics Market Revenue Share (%), by Application 2025 & 2033
- Figure 16: Rest of Asia Pacific Transparent Ceramics Market Revenue (million), by Country 2025 & 2033
- Figure 17: Rest of Asia Pacific Transparent Ceramics Market Revenue Share (%), by Country 2025 & 2033
- Figure 18: North America Transparent Ceramics Market Revenue (million), by Structure 2025 & 2033
- Figure 19: North America Transparent Ceramics Market Revenue Share (%), by Structure 2025 & 2033
- Figure 20: North America Transparent Ceramics Market Revenue (million), by Material 2025 & 2033
- Figure 21: North America Transparent Ceramics Market Revenue Share (%), by Material 2025 & 2033
- Figure 22: North America Transparent Ceramics Market Revenue (million), by Application 2025 & 2033
- Figure 23: North America Transparent Ceramics Market Revenue Share (%), by Application 2025 & 2033
- Figure 24: North America Transparent Ceramics Market Revenue (million), by Country 2025 & 2033
- Figure 25: North America Transparent Ceramics Market Revenue Share (%), by Country 2025 & 2033
- Figure 26: Europe Transparent Ceramics Market Revenue (million), by Structure 2025 & 2033
- Figure 27: Europe Transparent Ceramics Market Revenue Share (%), by Structure 2025 & 2033
- Figure 28: Europe Transparent Ceramics Market Revenue (million), by Material 2025 & 2033
- Figure 29: Europe Transparent Ceramics Market Revenue Share (%), by Material 2025 & 2033
- Figure 30: Europe Transparent Ceramics Market Revenue (million), by Application 2025 & 2033
- Figure 31: Europe Transparent Ceramics Market Revenue Share (%), by Application 2025 & 2033
- Figure 32: Europe Transparent Ceramics Market Revenue (million), by Country 2025 & 2033
- Figure 33: Europe Transparent Ceramics Market Revenue Share (%), by Country 2025 & 2033
- Figure 34: South America Transparent Ceramics Market Revenue (million), by Structure 2025 & 2033
- Figure 35: South America Transparent Ceramics Market Revenue Share (%), by Structure 2025 & 2033
- Figure 36: South America Transparent Ceramics Market Revenue (million), by Material 2025 & 2033
- Figure 37: South America Transparent Ceramics Market Revenue Share (%), by Material 2025 & 2033
- Figure 38: South America Transparent Ceramics Market Revenue (million), by Application 2025 & 2033
- Figure 39: South America Transparent Ceramics Market Revenue Share (%), by Application 2025 & 2033
- Figure 40: South America Transparent Ceramics Market Revenue (million), by Country 2025 & 2033
- Figure 41: South America Transparent Ceramics Market Revenue Share (%), by Country 2025 & 2033
- Figure 42: Middle East and Africa Transparent Ceramics Market Revenue (million), by Structure 2025 & 2033
- Figure 43: Middle East and Africa Transparent Ceramics Market Revenue Share (%), by Structure 2025 & 2033
- Figure 44: Middle East and Africa Transparent Ceramics Market Revenue (million), by Material 2025 & 2033
- Figure 45: Middle East and Africa Transparent Ceramics Market Revenue Share (%), by Material 2025 & 2033
- Figure 46: Middle East and Africa Transparent Ceramics Market Revenue (million), by Application 2025 & 2033
- Figure 47: Middle East and Africa Transparent Ceramics Market Revenue Share (%), by Application 2025 & 2033
- Figure 48: Middle East and Africa Transparent Ceramics Market Revenue (million), by Country 2025 & 2033
- Figure 49: Middle East and Africa Transparent Ceramics Market Revenue Share (%), by Country 2025 & 2033
List of Tables
- Table 1: Global Transparent Ceramics Market Revenue million Forecast, by Structure 2020 & 2033
- Table 2: Global Transparent Ceramics Market Revenue million Forecast, by Material 2020 & 2033
- Table 3: Global Transparent Ceramics Market Revenue million Forecast, by Application 2020 & 2033
- Table 4: Global Transparent Ceramics Market Revenue million Forecast, by Region 2020 & 2033
- Table 5: Global Transparent Ceramics Market Revenue million Forecast, by Structure 2020 & 2033
- Table 6: Global Transparent Ceramics Market Revenue million Forecast, by Material 2020 & 2033
- Table 7: Global Transparent Ceramics Market Revenue million Forecast, by Application 2020 & 2033
- Table 8: Global Transparent Ceramics Market Revenue million Forecast, by Country 2020 & 2033
- Table 9: China Transparent Ceramics Market Revenue (million) Forecast, by Application 2020 & 2033
- Table 10: India Transparent Ceramics Market Revenue (million) Forecast, by Application 2020 & 2033
- Table 11: Japan Transparent Ceramics Market Revenue (million) Forecast, by Application 2020 & 2033
- Table 12: South Korea Transparent Ceramics Market Revenue (million) Forecast, by Application 2020 & 2033
- Table 13: Australia Transparent Ceramics Market Revenue (million) Forecast, by Application 2020 & 2033
- Table 14: Global Transparent Ceramics Market Revenue million Forecast, by Structure 2020 & 2033
- Table 15: Global Transparent Ceramics Market Revenue million Forecast, by Material 2020 & 2033
- Table 16: Global Transparent Ceramics Market Revenue million Forecast, by Application 2020 & 2033
- Table 17: Global Transparent Ceramics Market Revenue million Forecast, by Country 2020 & 2033
- Table 18: Global Transparent Ceramics Market Revenue million Forecast, by Structure 2020 & 2033
- Table 19: Global Transparent Ceramics Market Revenue million Forecast, by Material 2020 & 2033
- Table 20: Global Transparent Ceramics Market Revenue million Forecast, by Application 2020 & 2033
- Table 21: Global Transparent Ceramics Market Revenue million Forecast, by Country 2020 & 2033
- Table 22: United States Transparent Ceramics Market Revenue (million) Forecast, by Application 2020 & 2033
- Table 23: Canada Transparent Ceramics Market Revenue (million) Forecast, by Application 2020 & 2033
- Table 24: Mexico Transparent Ceramics Market Revenue (million) Forecast, by Application 2020 & 2033
- Table 25: Rest of North America Transparent Ceramics Market Revenue (million) Forecast, by Application 2020 & 2033
- Table 26: Global Transparent Ceramics Market Revenue million Forecast, by Structure 2020 & 2033
- Table 27: Global Transparent Ceramics Market Revenue million Forecast, by Material 2020 & 2033
- Table 28: Global Transparent Ceramics Market Revenue million Forecast, by Application 2020 & 2033
- Table 29: Global Transparent Ceramics Market Revenue million Forecast, by Country 2020 & 2033
- Table 30: Germany Transparent Ceramics Market Revenue (million) Forecast, by Application 2020 & 2033
- Table 31: United Kingdom Transparent Ceramics Market Revenue (million) Forecast, by Application 2020 & 2033
- Table 32: Italy Transparent Ceramics Market Revenue (million) Forecast, by Application 2020 & 2033
- Table 33: France Transparent Ceramics Market Revenue (million) Forecast, by Application 2020 & 2033
- Table 34: Rest of Europe Transparent Ceramics Market Revenue (million) Forecast, by Application 2020 & 2033
- Table 35: Global Transparent Ceramics Market Revenue million Forecast, by Structure 2020 & 2033
- Table 36: Global Transparent Ceramics Market Revenue million Forecast, by Material 2020 & 2033
- Table 37: Global Transparent Ceramics Market Revenue million Forecast, by Application 2020 & 2033
- Table 38: Global Transparent Ceramics Market Revenue million Forecast, by Country 2020 & 2033
- Table 39: Brazil Transparent Ceramics Market Revenue (million) Forecast, by Application 2020 & 2033
- Table 40: Argentina Transparent Ceramics Market Revenue (million) Forecast, by Application 2020 & 2033
- Table 41: Rest of South America Transparent Ceramics Market Revenue (million) Forecast, by Application 2020 & 2033
- Table 42: Global Transparent Ceramics Market Revenue million Forecast, by Structure 2020 & 2033
- Table 43: Global Transparent Ceramics Market Revenue million Forecast, by Material 2020 & 2033
- Table 44: Global Transparent Ceramics Market Revenue million Forecast, by Application 2020 & 2033
- Table 45: Global Transparent Ceramics Market Revenue million Forecast, by Country 2020 & 2033
- Table 46: Saudi Arabia Transparent Ceramics Market Revenue (million) Forecast, by Application 2020 & 2033
- Table 47: South Africa Transparent Ceramics Market Revenue (million) Forecast, by Application 2020 & 2033
- Table 48: Rest of Middle East and Africa Transparent Ceramics Market Revenue (million) Forecast, by Application 2020 & 2033
Frequently Asked Questions
1. What is the projected Compound Annual Growth Rate (CAGR) of the Transparent Ceramics Market?
The projected CAGR is approximately 17.6%.
2. Which companies are prominent players in the Transparent Ceramics Market?
Key companies in the market include General Electric, Konoshima Chemicals Co Ltd, Coorstek KK, CeramTec GmbH, II-VI Optical Systems, Koninklijke Philips N V, Surmet Corporation*List Not Exhaustive, Saint-Gobain Group, Cilas, www optocity com, CeraNova, Deisenroth Engineering GmbH, AGC Inc, SCHOTT AG.
3. What are the main segments of the Transparent Ceramics Market?
The market segments include Structure, Material, Application.
4. Can you provide details about the market size?
The market size is estimated to be USD 782.62 million as of 2022.
5. What are some drivers contributing to market growth?
; Accelerating Usage in Optics and Optoelectronics; Increasing Demand in the Aerospace and Defense Sector; Advanced Ceramics Increasingly Replacing Plastics and Metals.
6. What are the notable trends driving market growth?
Increasing Demand from the Aerospace and Defense Sector.
7. Are there any restraints impacting market growth?
; High Cost; Other Restraints.
8. Can you provide examples of recent developments in the market?
N/A
9. What pricing options are available for accessing the report?
Pricing options include single-user, multi-user, and enterprise licenses priced at USD 4750, USD 5250, and USD 8750 respectively.
10. Is the market size provided in terms of value or volume?
The market size is provided in terms of value, measured in million.
11. Are there any specific market keywords associated with the report?
Yes, the market keyword associated with the report is "Transparent Ceramics Market," which aids in identifying and referencing the specific market segment covered.
12. How do I determine which pricing option suits my needs best?
The pricing options vary based on user requirements and access needs. Individual users may opt for single-user licenses, while businesses requiring broader access may choose multi-user or enterprise licenses for cost-effective access to the report.
13. Are there any additional resources or data provided in the Transparent Ceramics Market report?
While the report offers comprehensive insights, it's advisable to review the specific contents or supplementary materials provided to ascertain if additional resources or data are available.
14. How can I stay updated on further developments or reports in the Transparent Ceramics Market?
To stay informed about further developments, trends, and reports in the Transparent Ceramics Market, consider subscribing to industry newsletters, following relevant companies and organizations, or regularly checking reputable industry news sources and publications.
Methodology
Step 1 - Identification of Relevant Samples Size from Population Database


Step 2 - Approaches for Defining Global Market Size (Value, Volume* & Price*)

Note*: In applicable scenarios
Step 3 - Data Sources
Primary Research
- Web Analytics
- Survey Reports
- Research Institute
- Latest Research Reports
- Opinion Leaders
Secondary Research
- Annual Reports
- White Paper
- Latest Press Release
- Industry Association
- Paid Database
- Investor Presentations

Step 4 - Data Triangulation
Involves using different sources of information in order to increase the validity of a study
These sources are likely to be stakeholders in a program - participants, other researchers, program staff, other community members, and so on.
Then we put all data in single framework & apply various statistical tools to find out the dynamic on the market.
During the analysis stage, feedback from the stakeholder groups would be compared to determine areas of agreement as well as areas of divergence