

Key Insights
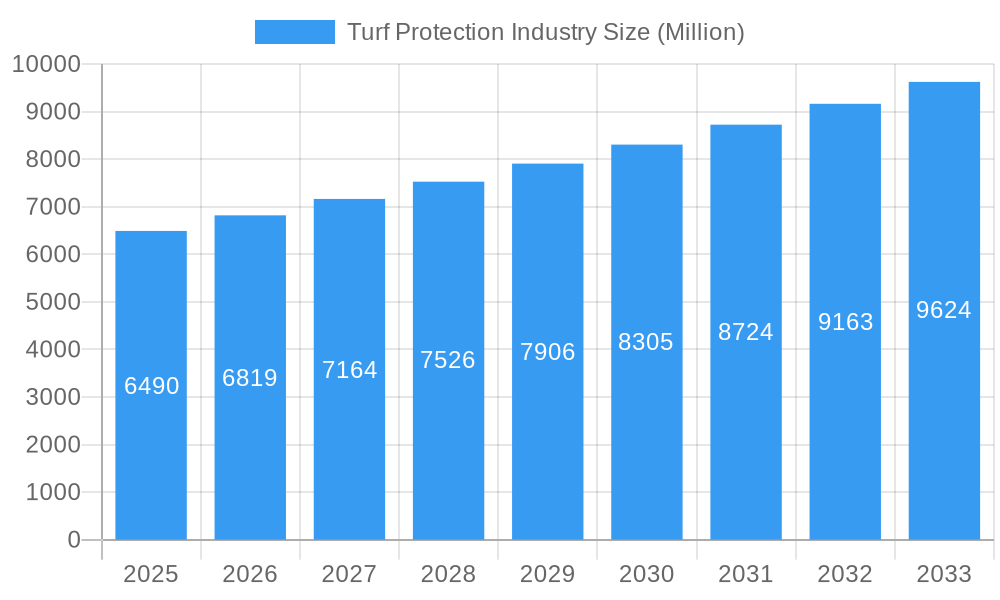
The global turf protection market, valued at $6.49 billion in 2025, is projected to experience robust growth, driven by increasing urbanization, rising disposable incomes fueling demand for aesthetically pleasing landscapes, and the expanding popularity of golf and sports. The market's Compound Annual Growth Rate (CAGR) of 4.90% from 2025 to 2033 indicates a significant expansion, fueled by advancements in turf protection technologies offering enhanced efficacy and environmental sustainability. Key application segments include landscaping, golf courses, sports fields, and sod farming, each contributing to the market's overall growth. Major players such as Bayer Cropscience AG, UPL, and Syngenta AG are driving innovation through the development of novel products, focusing on bio-pesticides and sustainable solutions to meet growing environmental concerns. The North American market, particularly the United States, holds a significant share due to high adoption rates and established turf management practices. However, growth in Asia-Pacific is expected to accelerate, driven by increasing infrastructure development and rising demand for high-quality turf in developing economies. Market restraints include stringent regulatory frameworks concerning pesticide use and potential fluctuations in raw material prices. Despite these challenges, the long-term outlook for the turf protection market remains optimistic, anticipating continued expansion based on the factors mentioned.
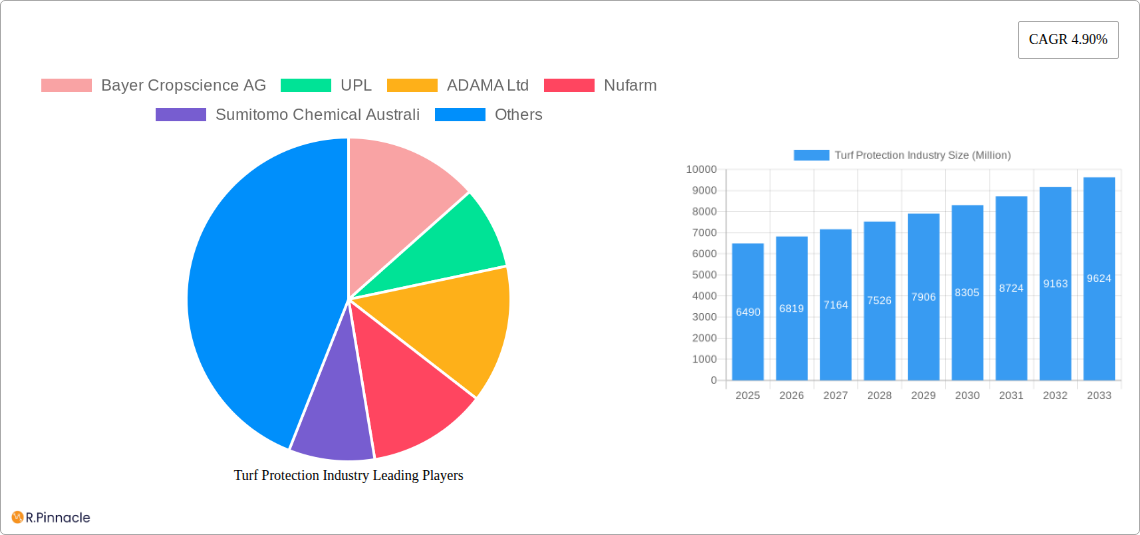
Turf Protection Industry Market Size (In Billion)
The competitive landscape is characterized by both large multinational corporations and specialized companies, each focusing on specific turf protection product categories. This competitive environment fosters innovation and drives down costs, ultimately benefiting consumers. Future growth will be significantly impacted by advancements in precision application technologies, ensuring optimal product utilization and minimizing environmental impact. Furthermore, the increasing awareness of sustainable practices is likely to accelerate the adoption of environmentally friendly turf protection solutions, shaping the market's trajectory in the coming years. The market segmentation will continue to evolve, reflecting the specific needs of different applications and regional preferences. Careful analysis of regulatory landscape and consumer preferences will be crucial for successful market penetration for existing and emerging players.
Turf Protection Industry Company Market Share
Turf Protection Industry Market Report: 2019-2033
This comprehensive report provides a detailed analysis of the global Turf Protection Industry, offering invaluable insights for industry professionals, investors, and strategic decision-makers. With a study period spanning 2019-2033, a base year of 2025, and a forecast period of 2025-2033, this report leverages rigorous data analysis to project a market valued at $XX Billion by 2033, exhibiting a robust CAGR of XX%.
Turf Protection Industry Market Structure & Innovation Trends
The Turf Protection Industry is characterized by a moderately concentrated market structure, with key players such as Bayer Cropscience AG, UPL, ADAMA Ltd, Nufarm, Sumitomo Chemical Australia, AMVAC Chemical Corporation, Marrone Bio Innovations, Syngenta AG, and BASF SE holding significant market share. The combined market share of the top five companies is estimated at XX% in 2025. Innovation is driven by the need for more effective, sustainable, and environmentally friendly products, fueled by increasing regulatory scrutiny and consumer demand for eco-conscious solutions. The industry is witnessing significant M&A activity, with deal values exceeding $XX Billion in the past five years, primarily driven by companies seeking to expand their product portfolios and geographical reach. Regulatory frameworks, particularly concerning pesticide registration and usage, play a crucial role in shaping market dynamics. The increasing availability of bio-based and low-impact alternatives is also impacting the market. End-user demographics, particularly the rise of environmentally conscious consumers, are influencing product development and marketing strategies.
- Market Concentration: Top 5 players hold XX% market share (2025).
- M&A Activity: Deal values exceeding $XX Billion (2019-2024).
- Key Innovation Drivers: Sustainable solutions, regulatory pressures, consumer preferences.
- Product Substitutes: Biopesticides, natural turf management techniques.
Turf Protection Industry Market Dynamics & Trends
The Turf Protection Industry is experiencing robust growth, driven by several factors. Increased urbanization and rising disposable incomes are fueling demand for aesthetically pleasing and well-maintained lawns and turf in residential and commercial settings. The golf industry, a significant end-user segment, continues to expand globally, further driving market growth. Technological advancements, such as the development of more targeted and effective pesticides, are also contributing to market expansion. Consumer preferences are shifting towards environmentally friendly products with minimal impact on human health and the ecosystem. Competitive dynamics are intense, with companies focusing on product differentiation, innovation, and strategic partnerships to gain a competitive edge. The market penetration of biopesticides is gradually increasing, though chemical pesticides still dominate.
- Growth Drivers: Urbanization, rising disposable incomes, golf industry expansion, technological advancements.
- CAGR (2025-2033): XX%
- Market Penetration of Biopesticides (2025): XX%
- Competitive Dynamics: Intense competition, focus on product differentiation and sustainability.
Dominant Regions & Segments in Turf Protection Industry
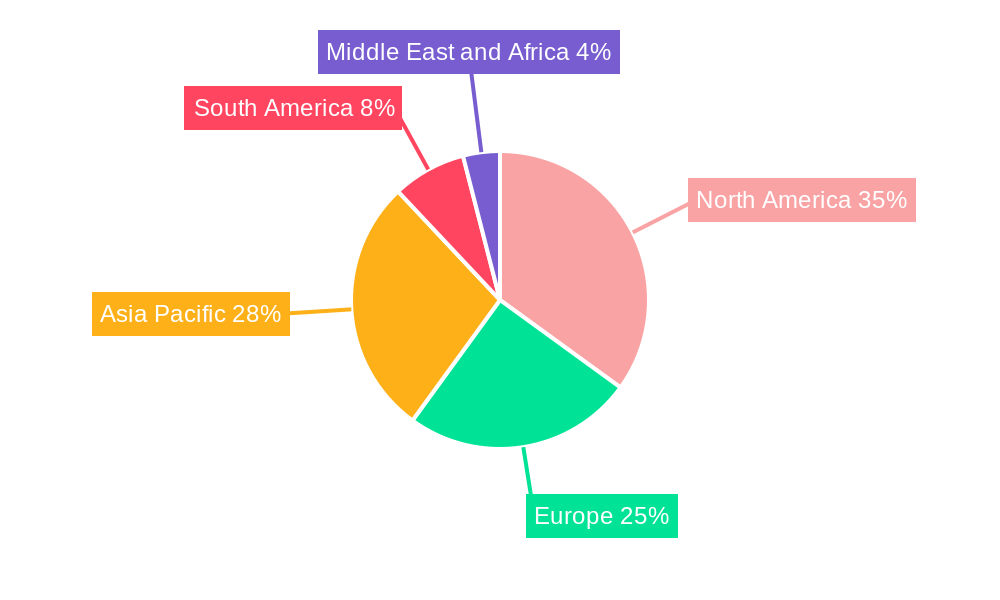
The North American region currently dominates the Turf Protection Industry, accounting for approximately XX% of the global market in 2025. This dominance is largely attributed to high per capita income levels, extensive landscaping practices, and a well-established golf industry. Europe follows as the second largest regional market, driven by similar factors albeit with a stronger emphasis on sustainable and environmentally friendly practices. Within application segments, landscaping holds the largest market share, followed by golf courses and sports fields. The Sod Growers segment is also witnessing significant growth, propelled by the increasing demand for high-quality turfgrass for landscaping and other applications.
- Leading Region: North America (XX% market share in 2025)
- Key Drivers (North America): High per capita income, extensive landscaping, established golf industry.
- Key Drivers (Europe): Strong focus on sustainability, increasing government support for eco-friendly practices.
- Largest Segment: Landscaping
Turf Protection Industry Product Innovations
Recent product innovations focus on delivering superior efficacy while minimizing environmental impact. This includes the development of targeted pesticides with reduced toxicity, biopesticides derived from natural sources, and integrated pest management (IPM) strategies. These innovations are driven by the need to comply with stricter environmental regulations and meet growing consumer demand for sustainable solutions. The market is also witnessing the integration of technology, such as precision application technologies and remote sensing, to optimize pesticide use and enhance overall efficiency.
Report Scope & Segmentation Analysis
This report segments the Turf Protection Industry by application: Landscaping, Golf, Sports, and Sod Growers. Each segment presents unique growth projections and competitive dynamics. The Landscaping segment is projected to experience robust growth due to the increasing demand for aesthetically pleasing lawns and gardens. The Golf segment is also expected to show significant growth fueled by the global expansion of the golf industry. The Sports segment is witnessing growth due to the increasing popularity of various sports and the demand for high-quality turf in sports fields. The Sod Growers segment's growth is driven by the increasing demand for high-quality turfgrass.
- Landscaping: Projected to reach $XX Billion by 2033.
- Golf: Projected to reach $XX Billion by 2033.
- Sports: Projected to reach $XX Billion by 2033.
- Sod Growers: Projected to reach $XX Billion by 2033.
Key Drivers of Turf Protection Industry Growth
Several factors are driving the growth of the Turf Protection Industry. Technological advancements, such as the development of more efficient and targeted pesticides, are contributing to market expansion. Favorable economic conditions and rising disposable incomes, particularly in developing countries, are boosting demand for lawn and turf care services. Government policies promoting sustainable turf management practices are also influencing market growth.
Challenges in the Turf Protection Industry Sector
The Turf Protection Industry faces several challenges, including stringent environmental regulations that limit the use of certain pesticides, supply chain disruptions that can impact the availability of raw materials, and intense competition from both established and emerging players. These factors can negatively impact profitability and market growth. The fluctuating prices of raw materials are another major challenge.
Emerging Opportunities in Turf Protection Industry
The Turf Protection Industry presents several emerging opportunities. The growing adoption of sustainable and environmentally friendly turf management practices creates opportunities for biopesticide manufacturers and providers of integrated pest management (IPM) solutions. Technological advancements such as precision application technologies and drone-based spraying open new avenues for efficiency and cost savings. Expanding into developing markets with increasing disposable incomes presents significant growth potential.
Leading Players in the Turf Protection Industry Market
Key Developments in Turf Protection Industry Industry
- Jan 2023: Bayer Cropscience AG launched a new biopesticide for turfgrass.
- Apr 2022: UPL acquired a smaller competitor, expanding its product portfolio.
- Oct 2021: Syngenta AG invested in a new research and development facility focused on sustainable turf protection solutions.
- (Add more key developments with dates as available)
Future Outlook for Turf Protection Industry Market
The Turf Protection Industry is poised for continued growth, driven by factors such as urbanization, rising disposable incomes, and the increasing demand for aesthetically pleasing and healthy turf. The shift towards sustainable and environmentally friendly solutions will continue to shape market dynamics, creating opportunities for innovative companies offering biopesticides and integrated pest management solutions. Technological advancements will further optimize pesticide application and enhance efficiency, leading to improved sustainability and cost-effectiveness.
Turf Protection Industry Segmentation
-
1. Application
- 1.1. Landscaping
- 1.2. Golf
- 1.3. Sports
- 1.4. Sod Growers
-
2. Application
- 2.1. Landscaping
- 2.2. Golf
- 2.3. Sports
- 2.4. Sod Growers
Turf Protection Industry Segmentation By Geography
-
1. North America
- 1.1. United States
- 1.2. Canada
- 1.3. Mexico
- 1.4. Rest of North America
-
2. Europe
- 2.1. Germany
- 2.2. United Kingdom
- 2.3. France
- 2.4. Russia
- 2.5. Spain
- 2.6. Italy
- 2.7. Rest of Europe
-
3. Asia Pacific
- 3.1. China
- 3.2. Japan
- 3.3. India
- 3.4. Australia
- 3.5. Rest of Asia Pacific
-
4. South America
- 4.1. Brazil
- 4.2. Argentina
- 4.3. Rest of South America
-
5. Middle East and Africa
- 5.1. South Africa
- 5.2. Rest of Middle East and Africa
Turf Protection Industry Regional Market Share
Geographic Coverage of Turf Protection Industry
Turf Protection Industry REPORT HIGHLIGHTS
| Aspects | Details |
|---|---|
| Study Period | 2020-2034 |
| Base Year | 2025 |
| Estimated Year | 2026 |
| Forecast Period | 2026-2034 |
| Historical Period | 2020-2025 |
| Growth Rate | CAGR of 4.90% from 2020-2034 |
| Segmentation |
|
Table of Contents
- 1. Introduction
- 1.1. Research Scope
- 1.2. Market Segmentation
- 1.3. Research Objective
- 1.4. Definitions and Assumptions
- 2. Executive Summary
- 2.1. Market Snapshot
- 3. Market Dynamics
- 3.1. Market Drivers
- 3.2. Market Restrains
- 3.3. Market Trends
- 3.4. Market Opportunities
- 4. Market Factor Analysis
- 4.1. Porters Five Forces
- 4.1.1. Bargaining Power of Suppliers
- 4.1.2. Bargaining Power of Buyers
- 4.1.3. Threat of New Entrants
- 4.1.4. Threat of Substitutes
- 4.1.5. Competitive Rivalry
- 4.2. PESTEL analysis
- 4.3. BCG Analysis
- 4.3.1. Stars (High Growth, High Market Share)
- 4.3.2. Cash Cows (Low Growth, High Market Share)
- 4.3.3. Question Mark (High Growth, Low Market Share)
- 4.3.4. Dogs (Low Growth, Low Market Share)
- 4.4. Ansoff Matrix Analysis
- 4.5. Supply Chain Analysis
- 4.6. Regulatory Landscape
- 4.7. Current Market Potential and Opportunity Assessment (TAM–SAM–SOM Framework)
- 4.8. PRI Analyst Note
- 4.1. Porters Five Forces
- 5. Market Analysis, Insights and Forecast 2021-2033
- 5.1. Market Analysis, Insights and Forecast - by Application
- 5.1.1. Landscaping
- 5.1.2. Golf
- 5.1.3. Sports
- 5.1.4. Sod Growers
- 5.2. Market Analysis, Insights and Forecast - by Application
- 5.2.1. Landscaping
- 5.2.2. Golf
- 5.2.3. Sports
- 5.2.4. Sod Growers
- 5.3. Market Analysis, Insights and Forecast - by Region
- 5.3.1. North America
- 5.3.2. Europe
- 5.3.3. Asia Pacific
- 5.3.4. South America
- 5.3.5. Middle East and Africa
- 5.1. Market Analysis, Insights and Forecast - by Application
- 6. Global Turf Protection Industry Analysis, Insights and Forecast, 2021-2033
- 6.1. Market Analysis, Insights and Forecast - by Application
- 6.1.1. Landscaping
- 6.1.2. Golf
- 6.1.3. Sports
- 6.1.4. Sod Growers
- 6.2. Market Analysis, Insights and Forecast - by Application
- 6.2.1. Landscaping
- 6.2.2. Golf
- 6.2.3. Sports
- 6.2.4. Sod Growers
- 6.1. Market Analysis, Insights and Forecast - by Application
- 7. North America Turf Protection Industry Analysis, Insights and Forecast, 2020-2032
- 7.1. Market Analysis, Insights and Forecast - by Application
- 7.1.1. Landscaping
- 7.1.2. Golf
- 7.1.3. Sports
- 7.1.4. Sod Growers
- 7.2. Market Analysis, Insights and Forecast - by Application
- 7.2.1. Landscaping
- 7.2.2. Golf
- 7.2.3. Sports
- 7.2.4. Sod Growers
- 7.1. Market Analysis, Insights and Forecast - by Application
- 8. Europe Turf Protection Industry Analysis, Insights and Forecast, 2020-2032
- 8.1. Market Analysis, Insights and Forecast - by Application
- 8.1.1. Landscaping
- 8.1.2. Golf
- 8.1.3. Sports
- 8.1.4. Sod Growers
- 8.2. Market Analysis, Insights and Forecast - by Application
- 8.2.1. Landscaping
- 8.2.2. Golf
- 8.2.3. Sports
- 8.2.4. Sod Growers
- 8.1. Market Analysis, Insights and Forecast - by Application
- 9. Asia Pacific Turf Protection Industry Analysis, Insights and Forecast, 2020-2032
- 9.1. Market Analysis, Insights and Forecast - by Application
- 9.1.1. Landscaping
- 9.1.2. Golf
- 9.1.3. Sports
- 9.1.4. Sod Growers
- 9.2. Market Analysis, Insights and Forecast - by Application
- 9.2.1. Landscaping
- 9.2.2. Golf
- 9.2.3. Sports
- 9.2.4. Sod Growers
- 9.1. Market Analysis, Insights and Forecast - by Application
- 10. South America Turf Protection Industry Analysis, Insights and Forecast, 2020-2032
- 10.1. Market Analysis, Insights and Forecast - by Application
- 10.1.1. Landscaping
- 10.1.2. Golf
- 10.1.3. Sports
- 10.1.4. Sod Growers
- 10.2. Market Analysis, Insights and Forecast - by Application
- 10.2.1. Landscaping
- 10.2.2. Golf
- 10.2.3. Sports
- 10.2.4. Sod Growers
- 10.1. Market Analysis, Insights and Forecast - by Application
- 11. Middle East and Africa Turf Protection Industry Analysis, Insights and Forecast, 2020-2032
- 11.1. Market Analysis, Insights and Forecast - by Application
- 11.1.1. Landscaping
- 11.1.2. Golf
- 11.1.3. Sports
- 11.1.4. Sod Growers
- 11.2. Market Analysis, Insights and Forecast - by Application
- 11.2.1. Landscaping
- 11.2.2. Golf
- 11.2.3. Sports
- 11.2.4. Sod Growers
- 11.1. Market Analysis, Insights and Forecast - by Application
- 12. Competitive Analysis
- 12.1. Company Profiles
- 12.1.1 Bayer Cropscience AG
- 12.1.1.1. Company Overview
- 12.1.1.2. Products
- 12.1.1.3. Company Financials
- 12.1.1.4. SWOT Analysis
- 12.1.2 UPL
- 12.1.2.1. Company Overview
- 12.1.2.2. Products
- 12.1.2.3. Company Financials
- 12.1.2.4. SWOT Analysis
- 12.1.3 ADAMA Ltd
- 12.1.3.1. Company Overview
- 12.1.3.2. Products
- 12.1.3.3. Company Financials
- 12.1.3.4. SWOT Analysis
- 12.1.4 Nufarm
- 12.1.4.1. Company Overview
- 12.1.4.2. Products
- 12.1.4.3. Company Financials
- 12.1.4.4. SWOT Analysis
- 12.1.5 Sumitomo Chemical Australi
- 12.1.5.1. Company Overview
- 12.1.5.2. Products
- 12.1.5.3. Company Financials
- 12.1.5.4. SWOT Analysis
- 12.1.6 AMVAC Chemical Corporation
- 12.1.6.1. Company Overview
- 12.1.6.2. Products
- 12.1.6.3. Company Financials
- 12.1.6.4. SWOT Analysis
- 12.1.7 Marrone Bio Innovations
- 12.1.7.1. Company Overview
- 12.1.7.2. Products
- 12.1.7.3. Company Financials
- 12.1.7.4. SWOT Analysis
- 12.1.8 Syngenta AG
- 12.1.8.1. Company Overview
- 12.1.8.2. Products
- 12.1.8.3. Company Financials
- 12.1.8.4. SWOT Analysis
- 12.1.9 BASF SE
- 12.1.9.1. Company Overview
- 12.1.9.2. Products
- 12.1.9.3. Company Financials
- 12.1.9.4. SWOT Analysis
- 12.1.1 Bayer Cropscience AG
- 12.2. Market Entropy
- 12.2.1 Company's Key Areas Served
- 12.2.2 Recent Developments
- 12.3. Company Market Share Analysis 2025
- 12.3.1 Top 5 Companies Market Share Analysis
- 12.3.2 Top 3 Companies Market Share Analysis
- 12.4. List of Potential Customers
- 13. Research Methodology
List of Figures
- Figure 1: Global Turf Protection Industry Revenue Breakdown (Million, %) by Region 2025 & 2033
- Figure 2: North America Turf Protection Industry Revenue (Million), by Application 2025 & 2033
- Figure 3: North America Turf Protection Industry Revenue Share (%), by Application 2025 & 2033
- Figure 4: North America Turf Protection Industry Revenue (Million), by Application 2025 & 2033
- Figure 5: North America Turf Protection Industry Revenue Share (%), by Application 2025 & 2033
- Figure 6: North America Turf Protection Industry Revenue (Million), by Country 2025 & 2033
- Figure 7: North America Turf Protection Industry Revenue Share (%), by Country 2025 & 2033
- Figure 8: Europe Turf Protection Industry Revenue (Million), by Application 2025 & 2033
- Figure 9: Europe Turf Protection Industry Revenue Share (%), by Application 2025 & 2033
- Figure 10: Europe Turf Protection Industry Revenue (Million), by Application 2025 & 2033
- Figure 11: Europe Turf Protection Industry Revenue Share (%), by Application 2025 & 2033
- Figure 12: Europe Turf Protection Industry Revenue (Million), by Country 2025 & 2033
- Figure 13: Europe Turf Protection Industry Revenue Share (%), by Country 2025 & 2033
- Figure 14: Asia Pacific Turf Protection Industry Revenue (Million), by Application 2025 & 2033
- Figure 15: Asia Pacific Turf Protection Industry Revenue Share (%), by Application 2025 & 2033
- Figure 16: Asia Pacific Turf Protection Industry Revenue (Million), by Application 2025 & 2033
- Figure 17: Asia Pacific Turf Protection Industry Revenue Share (%), by Application 2025 & 2033
- Figure 18: Asia Pacific Turf Protection Industry Revenue (Million), by Country 2025 & 2033
- Figure 19: Asia Pacific Turf Protection Industry Revenue Share (%), by Country 2025 & 2033
- Figure 20: South America Turf Protection Industry Revenue (Million), by Application 2025 & 2033
- Figure 21: South America Turf Protection Industry Revenue Share (%), by Application 2025 & 2033
- Figure 22: South America Turf Protection Industry Revenue (Million), by Application 2025 & 2033
- Figure 23: South America Turf Protection Industry Revenue Share (%), by Application 2025 & 2033
- Figure 24: South America Turf Protection Industry Revenue (Million), by Country 2025 & 2033
- Figure 25: South America Turf Protection Industry Revenue Share (%), by Country 2025 & 2033
- Figure 26: Middle East and Africa Turf Protection Industry Revenue (Million), by Application 2025 & 2033
- Figure 27: Middle East and Africa Turf Protection Industry Revenue Share (%), by Application 2025 & 2033
- Figure 28: Middle East and Africa Turf Protection Industry Revenue (Million), by Application 2025 & 2033
- Figure 29: Middle East and Africa Turf Protection Industry Revenue Share (%), by Application 2025 & 2033
- Figure 30: Middle East and Africa Turf Protection Industry Revenue (Million), by Country 2025 & 2033
- Figure 31: Middle East and Africa Turf Protection Industry Revenue Share (%), by Country 2025 & 2033
List of Tables
- Table 1: Global Turf Protection Industry Revenue Million Forecast, by Application 2020 & 2033
- Table 2: Global Turf Protection Industry Revenue Million Forecast, by Application 2020 & 2033
- Table 3: Global Turf Protection Industry Revenue Million Forecast, by Region 2020 & 2033
- Table 4: Global Turf Protection Industry Revenue Million Forecast, by Application 2020 & 2033
- Table 5: Global Turf Protection Industry Revenue Million Forecast, by Application 2020 & 2033
- Table 6: Global Turf Protection Industry Revenue Million Forecast, by Country 2020 & 2033
- Table 7: United States Turf Protection Industry Revenue (Million) Forecast, by Application 2020 & 2033
- Table 8: Canada Turf Protection Industry Revenue (Million) Forecast, by Application 2020 & 2033
- Table 9: Mexico Turf Protection Industry Revenue (Million) Forecast, by Application 2020 & 2033
- Table 10: Rest of North America Turf Protection Industry Revenue (Million) Forecast, by Application 2020 & 2033
- Table 11: Global Turf Protection Industry Revenue Million Forecast, by Application 2020 & 2033
- Table 12: Global Turf Protection Industry Revenue Million Forecast, by Application 2020 & 2033
- Table 13: Global Turf Protection Industry Revenue Million Forecast, by Country 2020 & 2033
- Table 14: Germany Turf Protection Industry Revenue (Million) Forecast, by Application 2020 & 2033
- Table 15: United Kingdom Turf Protection Industry Revenue (Million) Forecast, by Application 2020 & 2033
- Table 16: France Turf Protection Industry Revenue (Million) Forecast, by Application 2020 & 2033
- Table 17: Russia Turf Protection Industry Revenue (Million) Forecast, by Application 2020 & 2033
- Table 18: Spain Turf Protection Industry Revenue (Million) Forecast, by Application 2020 & 2033
- Table 19: Italy Turf Protection Industry Revenue (Million) Forecast, by Application 2020 & 2033
- Table 20: Rest of Europe Turf Protection Industry Revenue (Million) Forecast, by Application 2020 & 2033
- Table 21: Global Turf Protection Industry Revenue Million Forecast, by Application 2020 & 2033
- Table 22: Global Turf Protection Industry Revenue Million Forecast, by Application 2020 & 2033
- Table 23: Global Turf Protection Industry Revenue Million Forecast, by Country 2020 & 2033
- Table 24: China Turf Protection Industry Revenue (Million) Forecast, by Application 2020 & 2033
- Table 25: Japan Turf Protection Industry Revenue (Million) Forecast, by Application 2020 & 2033
- Table 26: India Turf Protection Industry Revenue (Million) Forecast, by Application 2020 & 2033
- Table 27: Australia Turf Protection Industry Revenue (Million) Forecast, by Application 2020 & 2033
- Table 28: Rest of Asia Pacific Turf Protection Industry Revenue (Million) Forecast, by Application 2020 & 2033
- Table 29: Global Turf Protection Industry Revenue Million Forecast, by Application 2020 & 2033
- Table 30: Global Turf Protection Industry Revenue Million Forecast, by Application 2020 & 2033
- Table 31: Global Turf Protection Industry Revenue Million Forecast, by Country 2020 & 2033
- Table 32: Brazil Turf Protection Industry Revenue (Million) Forecast, by Application 2020 & 2033
- Table 33: Argentina Turf Protection Industry Revenue (Million) Forecast, by Application 2020 & 2033
- Table 34: Rest of South America Turf Protection Industry Revenue (Million) Forecast, by Application 2020 & 2033
- Table 35: Global Turf Protection Industry Revenue Million Forecast, by Application 2020 & 2033
- Table 36: Global Turf Protection Industry Revenue Million Forecast, by Application 2020 & 2033
- Table 37: Global Turf Protection Industry Revenue Million Forecast, by Country 2020 & 2033
- Table 38: South Africa Turf Protection Industry Revenue (Million) Forecast, by Application 2020 & 2033
- Table 39: Rest of Middle East and Africa Turf Protection Industry Revenue (Million) Forecast, by Application 2020 & 2033
Frequently Asked Questions
1. What is the projected Compound Annual Growth Rate (CAGR) of the Turf Protection Industry?
The projected CAGR is approximately 4.90%.
2. Which companies are prominent players in the Turf Protection Industry?
Key companies in the market include Bayer Cropscience AG, UPL, ADAMA Ltd, Nufarm, Sumitomo Chemical Australi, AMVAC Chemical Corporation, Marrone Bio Innovations, Syngenta AG, BASF SE.
3. What are the main segments of the Turf Protection Industry?
The market segments include Application, Application.
4. Can you provide details about the market size?
The market size is estimated to be USD 6.49 Million as of 2022.
5. What are some drivers contributing to market growth?
Seed Treatment As A Solution To Enhance Yield; Growing Awareness For Seed Treatment Among The Farmers; Rising Trend Of Organic Farming.
6. What are the notable trends driving market growth?
Expansion of Sports Activities.
7. Are there any restraints impacting market growth?
Limitations Across Farm-Level Seed Treatment; Rising Environmental Concerns.
8. Can you provide examples of recent developments in the market?
N/A
9. What pricing options are available for accessing the report?
Pricing options include single-user, multi-user, and enterprise licenses priced at USD 4750, USD 5250, and USD 8750 respectively.
10. Is the market size provided in terms of value or volume?
The market size is provided in terms of value, measured in Million.
11. Are there any specific market keywords associated with the report?
Yes, the market keyword associated with the report is "Turf Protection Industry," which aids in identifying and referencing the specific market segment covered.
12. How do I determine which pricing option suits my needs best?
The pricing options vary based on user requirements and access needs. Individual users may opt for single-user licenses, while businesses requiring broader access may choose multi-user or enterprise licenses for cost-effective access to the report.
13. Are there any additional resources or data provided in the Turf Protection Industry report?
While the report offers comprehensive insights, it's advisable to review the specific contents or supplementary materials provided to ascertain if additional resources or data are available.
14. How can I stay updated on further developments or reports in the Turf Protection Industry?
To stay informed about further developments, trends, and reports in the Turf Protection Industry, consider subscribing to industry newsletters, following relevant companies and organizations, or regularly checking reputable industry news sources and publications.
Methodology
Step 1 - Identification of Relevant Samples Size from Population Database


Step 2 - Approaches for Defining Global Market Size (Value, Volume* & Price*)

Note*: In applicable scenarios
Step 3 - Data Sources
Primary Research
- Web Analytics
- Survey Reports
- Research Institute
- Latest Research Reports
- Opinion Leaders
Secondary Research
- Annual Reports
- White Paper
- Latest Press Release
- Industry Association
- Paid Database
- Investor Presentations

Step 4 - Data Triangulation
Involves using different sources of information in order to increase the validity of a study
These sources are likely to be stakeholders in a program - participants, other researchers, program staff, other community members, and so on.
Then we put all data in single framework & apply various statistical tools to find out the dynamic on the market.
During the analysis stage, feedback from the stakeholder groups would be compared to determine areas of agreement as well as areas of divergence