

Key Insights
The global TV Set-Top Box (STB) market is forecast for substantial growth, projected to reach 307.1 million by 2033. This expansion is propelled by the increasing consumption of High-Definition (HD) and Ultra-High-Definition (UHD) content, the widespread adoption of streaming services, and the industry-wide shift from traditional cable to Internet Protocol Television (IPTV) and Over-The-Top (OTT) platforms. The market is expected to grow at a Compound Annual Growth Rate (CAGR) of 5.54% from 2025 to 2033. Technological advancements in STB capabilities, including enhanced processing power, intuitive user interfaces, and seamless integration with smart home ecosystems, are key drivers. Significant growth is anticipated in the HD and Ultra-HD STB segments, catering to consumer demand for superior viewing experiences. While streaming services present significant opportunities, market expansion may face challenges from the increasing integration of smart TV functionalities and the capital investment required for infrastructure upgrades. North America and the Asia Pacific region are anticipated to lead market growth, supported by robust internet penetration and substantial consumer expenditure on entertainment. The competitive landscape features established leaders such as ARRIS International PLC (CommScope Inc.), HUMAX, and Technicolor, alongside innovative new entrants targeting specific regional markets and technological niches. Future market success will depend on the integration of advanced features like 4K resolution, voice control, and enhanced streaming capabilities at competitive price points.
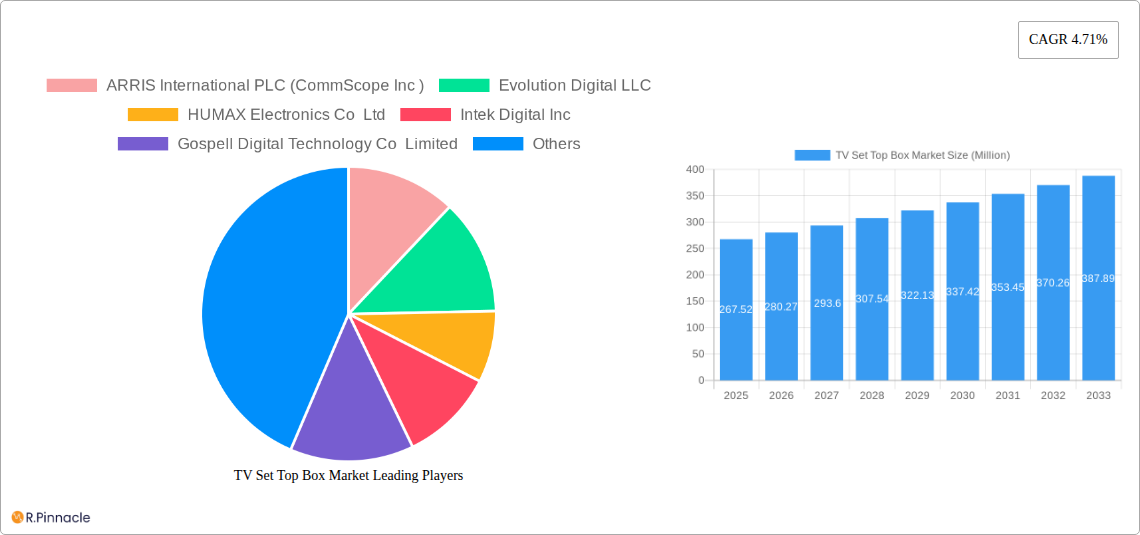
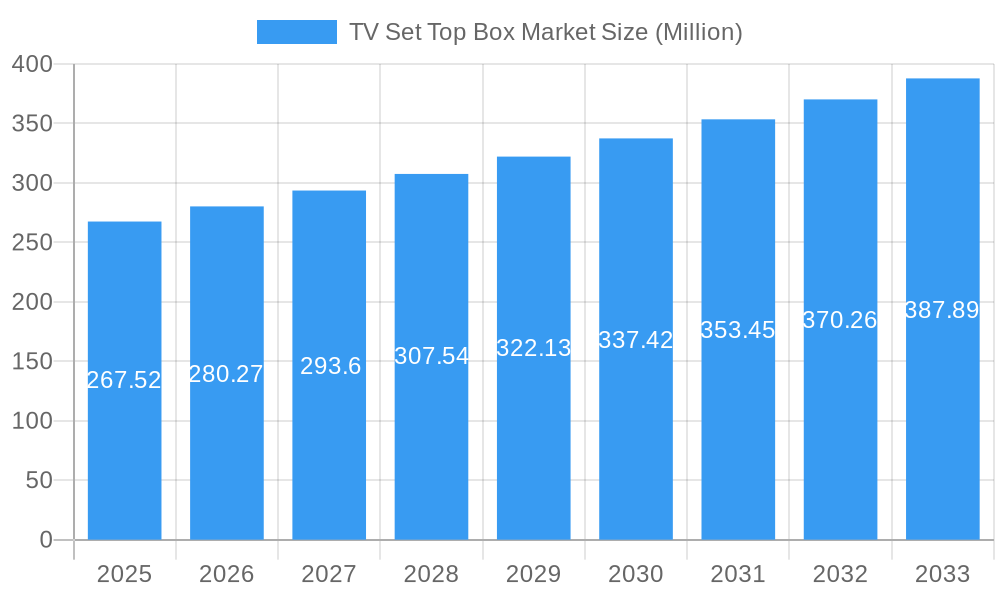
TV Set Top Box Market Market Size (In Million)
The competitive intensity within the TV STB market is expected to rise due to ongoing mergers and acquisitions, and the emergence of new companies specializing in niche functionalities and regional markets. Government regulations pertaining to broadcasting standards and digital migration initiatives will also play a significant role in shaping market dynamics. The expansion of broadband infrastructure in developing economies is poised to stimulate demand for STBs, particularly in regions such as the Asia Pacific and South America. Conversely, economic downturns or shifts in consumer preferences towards alternative entertainment platforms could affect growth projections. Therefore, manufacturers must prioritize innovation, strategic partnerships, and effective marketing strategies to maintain their competitive advantage and secure market share in this dynamic environment. Successful strategies will involve adapting to evolving consumer demands, offering competitive pricing, and developing customized solutions for diverse market segments.
TV Set Top Box Market Company Market Share
TV Set Top Box Market: A Comprehensive Report (2019-2033)
This in-depth report provides a comprehensive analysis of the global TV Set Top Box market, covering the period 2019-2033. It offers invaluable insights into market dynamics, competitive landscapes, technological advancements, and future growth opportunities for industry professionals, investors, and strategic decision-makers. The report leverages extensive data analysis and incorporates key developments to present a clear and actionable understanding of this rapidly evolving sector. The market is segmented by technology (Satellite/DTH, IPTV, Cable, Other Types (DTT and OTT)), resolution (SD, HD, Ultra-HD and Higher), and key geographic regions. The total market size is projected to reach xx Million by 2033.
TV Set Top Box Market Market Structure & Innovation Trends
The TV Set Top Box market exhibits a moderately consolidated structure, with a handful of major players commanding significant market share. The top ten companies, including ARRIS International PLC (CommScope Inc), Evolution Digital LLC, HUMAX Electronics Co Ltd, Intek Digital Inc, Gospell Digital Technology Co Limited, Shenzhen SDMC Technology Co Ltd, Shenzhen Coship Electronics Co Ltd, Sagemcom SAS, ZTE Corporation, Skyworth Digital Ltd, Kaon Media Co Limited, and Technicolor SA, collectively account for approximately xx% of the global market in 2025. Market share dynamics are influenced by factors such as technological innovation, strategic partnerships, mergers and acquisitions (M&A), and regulatory changes.
Innovation Drivers: The increasing demand for high-definition and Ultra-HD video streaming, coupled with the rise of OTT platforms and smart TV functionalities, are driving innovation in set-top box technology. Features like voice control, enhanced user interfaces, and integration with smart home ecosystems are becoming increasingly important.
Regulatory Frameworks: Government regulations concerning broadcasting standards and digital migration significantly impact market growth and technological adoption.
Product Substitutes: Streaming devices and smart TVs are emerging as potential substitutes for traditional set-top boxes, impacting market dynamics.
End-User Demographics: The report analyzes end-user preferences across various demographics, including age, income, and geographic location, to understand market demand and segmentation.
M&A Activities: The TV Set Top Box market has witnessed significant M&A activity in recent years, with deal values totaling xx Million in 2024. These activities are driven by the desire to expand market share, acquire new technologies, and enhance product portfolios. For example, the acquisition of [Company A] by [Company B] in [Year] significantly altered the competitive landscape.
TV Set Top Box Market Market Dynamics & Trends
The global TV Set Top Box market is experiencing robust growth, driven by several key factors. The increasing penetration of high-speed internet, rising disposable incomes in developing economies, and the growing popularity of streaming services are fueling demand for advanced set-top boxes. The market is expected to register a CAGR of xx% during the forecast period (2025-2033). Technological disruptions, such as the shift towards 4K UHD and 8K resolutions, are also reshaping the market landscape. Consumer preferences are increasingly leaning towards smart functionalities, user-friendly interfaces, and seamless integration with other smart home devices. Competitive dynamics are intense, with leading players investing heavily in R&D and strategic partnerships to maintain their market positions. Market penetration of smart set-top boxes is projected to reach xx% by 2033.
Dominant Regions & Segments in TV Set Top Box Market
Leading Region: [Region Name] dominates the global TV Set Top Box market, accounting for xx% of the total market share in 2025. This dominance is driven by [Reasons for Dominance, e.g., strong economic growth, high internet penetration, supportive government policies].
Leading Country: [Country Name] holds a leading position within [Region Name], attributable to [Specific Reasons like high disposable incomes, robust consumer electronics market, government initiatives to promote digitalization].
Leading Technology Segment: The IPTV segment is leading the technology market in 2025, with xx Million in revenue, owing to its widespread availability and high-quality streaming capabilities.
Leading Resolution Segment: The HD segment maintains a strong market share due to its established market presence. However, the Ultra-HD and Higher segment is growing rapidly, driven by the increasing affordability of 4K displays and the growing adoption of 4K content. This segment is projected to dominate the market by 2033.
Other Types (DTT and OTT): The demand for these segments is increasing due to the rising popularity of Over-The-Top streaming services and Digital Terrestrial Television broadcasting.
Key Drivers:
- Economic policies: Government incentives for digitalization and infrastructure development are boosting market growth.
- Infrastructure: Extensive broadband network expansion facilitates seamless streaming and adoption of advanced set-top box features.
TV Set Top Box Market Product Innovations
Recent product developments focus on enhanced user experience, seamless integration with streaming platforms, and improved processing power to support higher resolutions (4K and 8K). The integration of AI and voice-activated controls is becoming increasingly prevalent, enhancing user convenience and personalization. Set-top boxes with advanced features like cloud DVR functionality, multi-screen viewing options, and enhanced gaming capabilities are gaining traction. These innovations offer significant competitive advantages by catering to evolving consumer preferences and technological advancements.
Report Scope & Segmentation Analysis
This report segments the TV Set Top Box market based on technology (Satellite/DTH, IPTV, Cable, Other Types (DTT and OTT)) and resolution (SD, HD, Ultra-HD and Higher). Each segment is analyzed in detail, providing insights into its market size, growth projections, and competitive dynamics.
Technology: The IPTV segment is projected to witness the highest growth rate during the forecast period, driven by increasing internet penetration and the growing popularity of streaming services. Satellite/DTH remains a significant segment, particularly in regions with limited broadband infrastructure. Cable remains a strong presence in established markets but faces increasing competition from IPTV and OTT. The Other Types segment is also showing potential as the adoption of DTT and OTT solutions expands.
Resolution: The HD segment currently dominates the market but is projected to witness slower growth compared to the Ultra-HD and higher segment, which is expected to experience rapid growth due to the increasing affordability of higher-resolution displays and content. SD is expected to decline in market share over time.
Key Drivers of TV Set Top Box Market Growth
The TV Set Top Box market's growth is propelled by technological advancements such as the introduction of 4K and 8K resolution capabilities, increased demand for high-quality video streaming, and the growing popularity of OTT platforms. Economic factors, like rising disposable incomes in developing nations, facilitate the purchase of these devices, while supportive government policies that promote digital broadcasting further accelerate market growth.
Challenges in the TV Set Top Box Market Sector
The TV Set Top Box market faces several challenges, including the increasing competition from smart TVs and streaming devices, which offer integrated functionalities, thus reducing the necessity of a separate set-top box. Supply chain disruptions caused by geopolitical instability and component shortages can also impact manufacturing and production timelines. Furthermore, regulatory hurdles and compliance requirements in different regions add to the complexities of market expansion. The combined impact of these challenges is estimated to negatively impact market growth by approximately xx% during the forecast period.
Emerging Opportunities in TV Set Top Box Market
The integration of AI and machine learning is opening up new opportunities for personalized content recommendations and user experience enhancement. The growing adoption of 5G technology is expected to facilitate smoother, higher-bandwidth streaming, further driving demand for advanced set-top boxes capable of harnessing these capabilities. Expansion into new markets, particularly in developing countries with increasing internet penetration, represents a significant opportunity for market growth.
Leading Players in the TV Set Top Box Market Market
- ARRIS International PLC (CommScope Inc)
- Evolution Digital LLC
- HUMAX Electronics Co Ltd
- Intek Digital Inc
- Gospell Digital Technology Co Limited
- Shenzhen SDMC Technology Co Ltd
- Shenzhen Coship Electronics Co Ltd
- Sagemcom SAS
- ZTE Corporation
- Skyworth Digital Ltd
- Kaon Media Co Limited
- Technicolor SA
Key Developments in TV Set Top Box Market Industry
February 2022: ZTE Corporation launched the ZXV10 B960GV1 next-generation 5G media gateway set-top box, offering gigabit speed access and 4K UHD video service. This signifies a significant advancement in set-top box technology, driving higher quality and speed.
March 2022: GTPL Hathway Limited introduced the GTPL Genie, a hybrid Android TV Set Top Box, combining live TV and OTT channels. This hybrid approach expands content accessibility and caters to evolving consumer preferences, indicating market innovation.
Future Outlook for TV Set Top Box Market Market
The future of the TV Set Top Box market is bright, fueled by the continued growth of streaming services, increasing internet penetration, and the ongoing development of innovative technologies. Strategic partnerships, technological advancements, and expansion into new markets will be key to unlocking the significant growth potential of this dynamic sector. The market is expected to reach xx Million by 2033, driven by factors such as adoption of advanced features and growth in emerging markets.
TV Set Top Box Market Segmentation
-
1. Technology
- 1.1. Satellite/DTH
- 1.2. IPTV
- 1.3. Cable
- 1.4. Other Types (DTT)
-
2. Resolution
- 2.1. SD
- 2.2. HD
- 2.3. Ultra-HD and Higher
TV Set Top Box Market Segmentation By Geography
- 1. North America
- 2. Europe
-
3. Asia
- 3.1. India
- 4. Australia and New Zealand
- 5. Latin America
- 6. Middle East and Africa
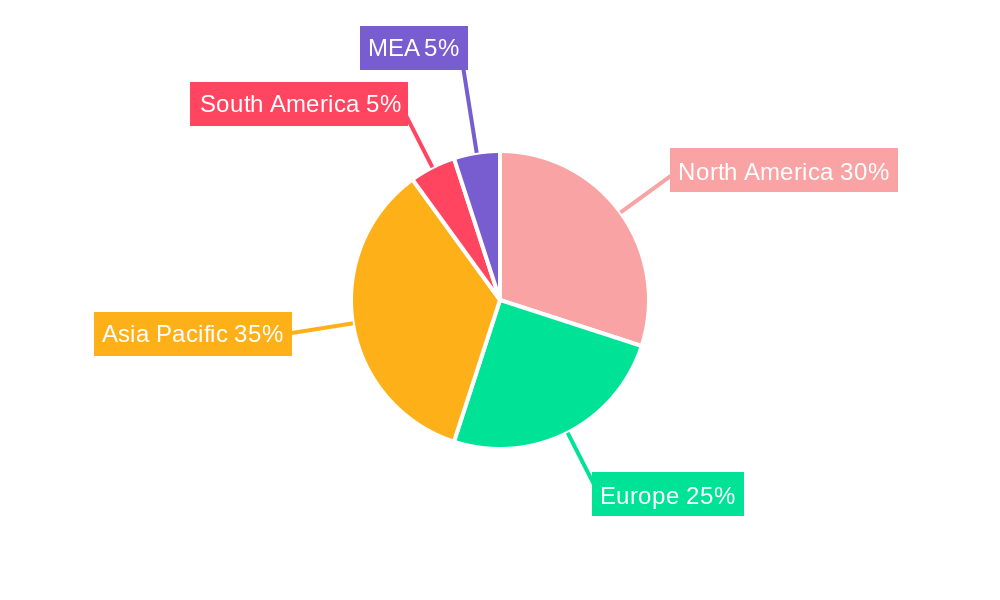
TV Set Top Box Market Regional Market Share
Geographic Coverage of TV Set Top Box Market
TV Set Top Box Market REPORT HIGHLIGHTS
| Aspects | Details |
|---|---|
| Study Period | 2020-2034 |
| Base Year | 2025 |
| Estimated Year | 2026 |
| Forecast Period | 2026-2034 |
| Historical Period | 2020-2025 |
| Growth Rate | CAGR of 5.54% from 2020-2034 |
| Segmentation |
|
Table of Contents
- 1. Introduction
- 1.1. Research Scope
- 1.2. Market Segmentation
- 1.3. Research Objective
- 1.4. Definitions and Assumptions
- 2. Executive Summary
- 2.1. Market Snapshot
- 3. Market Dynamics
- 3.1. Market Drivers
- 3.2. Market Restrains
- 3.3. Market Trends
- 3.4. Market Opportunities
- 4. Market Factor Analysis
- 4.1. Porters Five Forces
- 4.1.1. Bargaining Power of Suppliers
- 4.1.2. Bargaining Power of Buyers
- 4.1.3. Threat of New Entrants
- 4.1.4. Threat of Substitutes
- 4.1.5. Competitive Rivalry
- 4.2. PESTEL analysis
- 4.3. BCG Analysis
- 4.3.1. Stars (High Growth, High Market Share)
- 4.3.2. Cash Cows (Low Growth, High Market Share)
- 4.3.3. Question Mark (High Growth, Low Market Share)
- 4.3.4. Dogs (Low Growth, Low Market Share)
- 4.4. Ansoff Matrix Analysis
- 4.5. Supply Chain Analysis
- 4.6. Regulatory Landscape
- 4.7. Current Market Potential and Opportunity Assessment (TAM–SAM–SOM Framework)
- 4.8. PRI Analyst Note
- 4.1. Porters Five Forces
- 5. Market Analysis, Insights and Forecast 2021-2033
- 5.1. Market Analysis, Insights and Forecast - by Technology
- 5.1.1. Satellite/DTH
- 5.1.2. IPTV
- 5.1.3. Cable
- 5.1.4. Other Types (DTT)
- 5.2. Market Analysis, Insights and Forecast - by Resolution
- 5.2.1. SD
- 5.2.2. HD
- 5.2.3. Ultra-HD and Higher
- 5.3. Market Analysis, Insights and Forecast - by Region
- 5.3.1. North America
- 5.3.2. Europe
- 5.3.3. Asia
- 5.3.4. Australia and New Zealand
- 5.3.5. Latin America
- 5.3.6. Middle East and Africa
- 5.1. Market Analysis, Insights and Forecast - by Technology
- 6. Global TV Set Top Box Market Analysis, Insights and Forecast, 2021-2033
- 6.1. Market Analysis, Insights and Forecast - by Technology
- 6.1.1. Satellite/DTH
- 6.1.2. IPTV
- 6.1.3. Cable
- 6.1.4. Other Types (DTT)
- 6.2. Market Analysis, Insights and Forecast - by Resolution
- 6.2.1. SD
- 6.2.2. HD
- 6.2.3. Ultra-HD and Higher
- 6.1. Market Analysis, Insights and Forecast - by Technology
- 7. North America TV Set Top Box Market Analysis, Insights and Forecast, 2020-2032
- 7.1. Market Analysis, Insights and Forecast - by Technology
- 7.1.1. Satellite/DTH
- 7.1.2. IPTV
- 7.1.3. Cable
- 7.1.4. Other Types (DTT)
- 7.2. Market Analysis, Insights and Forecast - by Resolution
- 7.2.1. SD
- 7.2.2. HD
- 7.2.3. Ultra-HD and Higher
- 7.1. Market Analysis, Insights and Forecast - by Technology
- 8. Europe TV Set Top Box Market Analysis, Insights and Forecast, 2020-2032
- 8.1. Market Analysis, Insights and Forecast - by Technology
- 8.1.1. Satellite/DTH
- 8.1.2. IPTV
- 8.1.3. Cable
- 8.1.4. Other Types (DTT)
- 8.2. Market Analysis, Insights and Forecast - by Resolution
- 8.2.1. SD
- 8.2.2. HD
- 8.2.3. Ultra-HD and Higher
- 8.1. Market Analysis, Insights and Forecast - by Technology
- 9. Asia TV Set Top Box Market Analysis, Insights and Forecast, 2020-2032
- 9.1. Market Analysis, Insights and Forecast - by Technology
- 9.1.1. Satellite/DTH
- 9.1.2. IPTV
- 9.1.3. Cable
- 9.1.4. Other Types (DTT)
- 9.2. Market Analysis, Insights and Forecast - by Resolution
- 9.2.1. SD
- 9.2.2. HD
- 9.2.3. Ultra-HD and Higher
- 9.1. Market Analysis, Insights and Forecast - by Technology
- 10. Australia and New Zealand TV Set Top Box Market Analysis, Insights and Forecast, 2020-2032
- 10.1. Market Analysis, Insights and Forecast - by Technology
- 10.1.1. Satellite/DTH
- 10.1.2. IPTV
- 10.1.3. Cable
- 10.1.4. Other Types (DTT)
- 10.2. Market Analysis, Insights and Forecast - by Resolution
- 10.2.1. SD
- 10.2.2. HD
- 10.2.3. Ultra-HD and Higher
- 10.1. Market Analysis, Insights and Forecast - by Technology
- 11. Latin America TV Set Top Box Market Analysis, Insights and Forecast, 2020-2032
- 11.1. Market Analysis, Insights and Forecast - by Technology
- 11.1.1. Satellite/DTH
- 11.1.2. IPTV
- 11.1.3. Cable
- 11.1.4. Other Types (DTT)
- 11.2. Market Analysis, Insights and Forecast - by Resolution
- 11.2.1. SD
- 11.2.2. HD
- 11.2.3. Ultra-HD and Higher
- 11.1. Market Analysis, Insights and Forecast - by Technology
- 12. Middle East and Africa TV Set Top Box Market Analysis, Insights and Forecast, 2020-2032
- 12.1. Market Analysis, Insights and Forecast - by Technology
- 12.1.1. Satellite/DTH
- 12.1.2. IPTV
- 12.1.3. Cable
- 12.1.4. Other Types (DTT)
- 12.2. Market Analysis, Insights and Forecast - by Resolution
- 12.2.1. SD
- 12.2.2. HD
- 12.2.3. Ultra-HD and Higher
- 12.1. Market Analysis, Insights and Forecast - by Technology
- 13. Competitive Analysis
- 13.1. Company Profiles
- 13.1.1 ARRIS International PLC (CommScope Inc )
- 13.1.1.1. Company Overview
- 13.1.1.2. Products
- 13.1.1.3. Company Financials
- 13.1.1.4. SWOT Analysis
- 13.1.2 Evolution Digital LLC
- 13.1.2.1. Company Overview
- 13.1.2.2. Products
- 13.1.2.3. Company Financials
- 13.1.2.4. SWOT Analysis
- 13.1.3 HUMAX Electronics Co Ltd
- 13.1.3.1. Company Overview
- 13.1.3.2. Products
- 13.1.3.3. Company Financials
- 13.1.3.4. SWOT Analysis
- 13.1.4 Intek Digital Inc
- 13.1.4.1. Company Overview
- 13.1.4.2. Products
- 13.1.4.3. Company Financials
- 13.1.4.4. SWOT Analysis
- 13.1.5 Gospell Digital Technology Co Limited
- 13.1.5.1. Company Overview
- 13.1.5.2. Products
- 13.1.5.3. Company Financials
- 13.1.5.4. SWOT Analysis
- 13.1.6 Shenzhen SDMC Technology Co Ltd
- 13.1.6.1. Company Overview
- 13.1.6.2. Products
- 13.1.6.3. Company Financials
- 13.1.6.4. SWOT Analysis
- 13.1.7 Shenzhen Coship Electronics Co Ltd
- 13.1.7.1. Company Overview
- 13.1.7.2. Products
- 13.1.7.3. Company Financials
- 13.1.7.4. SWOT Analysis
- 13.1.8 Sagemcom SAS
- 13.1.8.1. Company Overview
- 13.1.8.2. Products
- 13.1.8.3. Company Financials
- 13.1.8.4. SWOT Analysis
- 13.1.9 ZTE Corporation
- 13.1.9.1. Company Overview
- 13.1.9.2. Products
- 13.1.9.3. Company Financials
- 13.1.9.4. SWOT Analysis
- 13.1.10 Skyworth Digital Ltd
- 13.1.10.1. Company Overview
- 13.1.10.2. Products
- 13.1.10.3. Company Financials
- 13.1.10.4. SWOT Analysis
- 13.1.11 Kaon Media Co Limited
- 13.1.11.1. Company Overview
- 13.1.11.2. Products
- 13.1.11.3. Company Financials
- 13.1.11.4. SWOT Analysis
- 13.1.12 Technicolor SA
- 13.1.12.1. Company Overview
- 13.1.12.2. Products
- 13.1.12.3. Company Financials
- 13.1.12.4. SWOT Analysis
- 13.1.1 ARRIS International PLC (CommScope Inc )
- 13.2. Market Entropy
- 13.2.1 Company's Key Areas Served
- 13.2.2 Recent Developments
- 13.3. Company Market Share Analysis 2025
- 13.3.1 Top 5 Companies Market Share Analysis
- 13.3.2 Top 3 Companies Market Share Analysis
- 13.4. List of Potential Customers
- 14. Research Methodology
List of Figures
- Figure 1: Global TV Set Top Box Market Revenue Breakdown (million, %) by Region 2025 & 2033
- Figure 2: Global TV Set Top Box Market Volume Breakdown (K Units, %) by Region 2025 & 2033
- Figure 3: North America TV Set Top Box Market Revenue (million), by Technology 2025 & 2033
- Figure 4: North America TV Set Top Box Market Volume (K Units), by Technology 2025 & 2033
- Figure 5: North America TV Set Top Box Market Revenue Share (%), by Technology 2025 & 2033
- Figure 6: North America TV Set Top Box Market Volume Share (%), by Technology 2025 & 2033
- Figure 7: North America TV Set Top Box Market Revenue (million), by Resolution 2025 & 2033
- Figure 8: North America TV Set Top Box Market Volume (K Units), by Resolution 2025 & 2033
- Figure 9: North America TV Set Top Box Market Revenue Share (%), by Resolution 2025 & 2033
- Figure 10: North America TV Set Top Box Market Volume Share (%), by Resolution 2025 & 2033
- Figure 11: North America TV Set Top Box Market Revenue (million), by Country 2025 & 2033
- Figure 12: North America TV Set Top Box Market Volume (K Units), by Country 2025 & 2033
- Figure 13: North America TV Set Top Box Market Revenue Share (%), by Country 2025 & 2033
- Figure 14: North America TV Set Top Box Market Volume Share (%), by Country 2025 & 2033
- Figure 15: Europe TV Set Top Box Market Revenue (million), by Technology 2025 & 2033
- Figure 16: Europe TV Set Top Box Market Volume (K Units), by Technology 2025 & 2033
- Figure 17: Europe TV Set Top Box Market Revenue Share (%), by Technology 2025 & 2033
- Figure 18: Europe TV Set Top Box Market Volume Share (%), by Technology 2025 & 2033
- Figure 19: Europe TV Set Top Box Market Revenue (million), by Resolution 2025 & 2033
- Figure 20: Europe TV Set Top Box Market Volume (K Units), by Resolution 2025 & 2033
- Figure 21: Europe TV Set Top Box Market Revenue Share (%), by Resolution 2025 & 2033
- Figure 22: Europe TV Set Top Box Market Volume Share (%), by Resolution 2025 & 2033
- Figure 23: Europe TV Set Top Box Market Revenue (million), by Country 2025 & 2033
- Figure 24: Europe TV Set Top Box Market Volume (K Units), by Country 2025 & 2033
- Figure 25: Europe TV Set Top Box Market Revenue Share (%), by Country 2025 & 2033
- Figure 26: Europe TV Set Top Box Market Volume Share (%), by Country 2025 & 2033
- Figure 27: Asia TV Set Top Box Market Revenue (million), by Technology 2025 & 2033
- Figure 28: Asia TV Set Top Box Market Volume (K Units), by Technology 2025 & 2033
- Figure 29: Asia TV Set Top Box Market Revenue Share (%), by Technology 2025 & 2033
- Figure 30: Asia TV Set Top Box Market Volume Share (%), by Technology 2025 & 2033
- Figure 31: Asia TV Set Top Box Market Revenue (million), by Resolution 2025 & 2033
- Figure 32: Asia TV Set Top Box Market Volume (K Units), by Resolution 2025 & 2033
- Figure 33: Asia TV Set Top Box Market Revenue Share (%), by Resolution 2025 & 2033
- Figure 34: Asia TV Set Top Box Market Volume Share (%), by Resolution 2025 & 2033
- Figure 35: Asia TV Set Top Box Market Revenue (million), by Country 2025 & 2033
- Figure 36: Asia TV Set Top Box Market Volume (K Units), by Country 2025 & 2033
- Figure 37: Asia TV Set Top Box Market Revenue Share (%), by Country 2025 & 2033
- Figure 38: Asia TV Set Top Box Market Volume Share (%), by Country 2025 & 2033
- Figure 39: Australia and New Zealand TV Set Top Box Market Revenue (million), by Technology 2025 & 2033
- Figure 40: Australia and New Zealand TV Set Top Box Market Volume (K Units), by Technology 2025 & 2033
- Figure 41: Australia and New Zealand TV Set Top Box Market Revenue Share (%), by Technology 2025 & 2033
- Figure 42: Australia and New Zealand TV Set Top Box Market Volume Share (%), by Technology 2025 & 2033
- Figure 43: Australia and New Zealand TV Set Top Box Market Revenue (million), by Resolution 2025 & 2033
- Figure 44: Australia and New Zealand TV Set Top Box Market Volume (K Units), by Resolution 2025 & 2033
- Figure 45: Australia and New Zealand TV Set Top Box Market Revenue Share (%), by Resolution 2025 & 2033
- Figure 46: Australia and New Zealand TV Set Top Box Market Volume Share (%), by Resolution 2025 & 2033
- Figure 47: Australia and New Zealand TV Set Top Box Market Revenue (million), by Country 2025 & 2033
- Figure 48: Australia and New Zealand TV Set Top Box Market Volume (K Units), by Country 2025 & 2033
- Figure 49: Australia and New Zealand TV Set Top Box Market Revenue Share (%), by Country 2025 & 2033
- Figure 50: Australia and New Zealand TV Set Top Box Market Volume Share (%), by Country 2025 & 2033
- Figure 51: Latin America TV Set Top Box Market Revenue (million), by Technology 2025 & 2033
- Figure 52: Latin America TV Set Top Box Market Volume (K Units), by Technology 2025 & 2033
- Figure 53: Latin America TV Set Top Box Market Revenue Share (%), by Technology 2025 & 2033
- Figure 54: Latin America TV Set Top Box Market Volume Share (%), by Technology 2025 & 2033
- Figure 55: Latin America TV Set Top Box Market Revenue (million), by Resolution 2025 & 2033
- Figure 56: Latin America TV Set Top Box Market Volume (K Units), by Resolution 2025 & 2033
- Figure 57: Latin America TV Set Top Box Market Revenue Share (%), by Resolution 2025 & 2033
- Figure 58: Latin America TV Set Top Box Market Volume Share (%), by Resolution 2025 & 2033
- Figure 59: Latin America TV Set Top Box Market Revenue (million), by Country 2025 & 2033
- Figure 60: Latin America TV Set Top Box Market Volume (K Units), by Country 2025 & 2033
- Figure 61: Latin America TV Set Top Box Market Revenue Share (%), by Country 2025 & 2033
- Figure 62: Latin America TV Set Top Box Market Volume Share (%), by Country 2025 & 2033
- Figure 63: Middle East and Africa TV Set Top Box Market Revenue (million), by Technology 2025 & 2033
- Figure 64: Middle East and Africa TV Set Top Box Market Volume (K Units), by Technology 2025 & 2033
- Figure 65: Middle East and Africa TV Set Top Box Market Revenue Share (%), by Technology 2025 & 2033
- Figure 66: Middle East and Africa TV Set Top Box Market Volume Share (%), by Technology 2025 & 2033
- Figure 67: Middle East and Africa TV Set Top Box Market Revenue (million), by Resolution 2025 & 2033
- Figure 68: Middle East and Africa TV Set Top Box Market Volume (K Units), by Resolution 2025 & 2033
- Figure 69: Middle East and Africa TV Set Top Box Market Revenue Share (%), by Resolution 2025 & 2033
- Figure 70: Middle East and Africa TV Set Top Box Market Volume Share (%), by Resolution 2025 & 2033
- Figure 71: Middle East and Africa TV Set Top Box Market Revenue (million), by Country 2025 & 2033
- Figure 72: Middle East and Africa TV Set Top Box Market Volume (K Units), by Country 2025 & 2033
- Figure 73: Middle East and Africa TV Set Top Box Market Revenue Share (%), by Country 2025 & 2033
- Figure 74: Middle East and Africa TV Set Top Box Market Volume Share (%), by Country 2025 & 2033
List of Tables
- Table 1: Global TV Set Top Box Market Revenue million Forecast, by Technology 2020 & 2033
- Table 2: Global TV Set Top Box Market Volume K Units Forecast, by Technology 2020 & 2033
- Table 3: Global TV Set Top Box Market Revenue million Forecast, by Resolution 2020 & 2033
- Table 4: Global TV Set Top Box Market Volume K Units Forecast, by Resolution 2020 & 2033
- Table 5: Global TV Set Top Box Market Revenue million Forecast, by Region 2020 & 2033
- Table 6: Global TV Set Top Box Market Volume K Units Forecast, by Region 2020 & 2033
- Table 7: Global TV Set Top Box Market Revenue million Forecast, by Technology 2020 & 2033
- Table 8: Global TV Set Top Box Market Volume K Units Forecast, by Technology 2020 & 2033
- Table 9: Global TV Set Top Box Market Revenue million Forecast, by Resolution 2020 & 2033
- Table 10: Global TV Set Top Box Market Volume K Units Forecast, by Resolution 2020 & 2033
- Table 11: Global TV Set Top Box Market Revenue million Forecast, by Country 2020 & 2033
- Table 12: Global TV Set Top Box Market Volume K Units Forecast, by Country 2020 & 2033
- Table 13: Global TV Set Top Box Market Revenue million Forecast, by Technology 2020 & 2033
- Table 14: Global TV Set Top Box Market Volume K Units Forecast, by Technology 2020 & 2033
- Table 15: Global TV Set Top Box Market Revenue million Forecast, by Resolution 2020 & 2033
- Table 16: Global TV Set Top Box Market Volume K Units Forecast, by Resolution 2020 & 2033
- Table 17: Global TV Set Top Box Market Revenue million Forecast, by Country 2020 & 2033
- Table 18: Global TV Set Top Box Market Volume K Units Forecast, by Country 2020 & 2033
- Table 19: Global TV Set Top Box Market Revenue million Forecast, by Technology 2020 & 2033
- Table 20: Global TV Set Top Box Market Volume K Units Forecast, by Technology 2020 & 2033
- Table 21: Global TV Set Top Box Market Revenue million Forecast, by Resolution 2020 & 2033
- Table 22: Global TV Set Top Box Market Volume K Units Forecast, by Resolution 2020 & 2033
- Table 23: Global TV Set Top Box Market Revenue million Forecast, by Country 2020 & 2033
- Table 24: Global TV Set Top Box Market Volume K Units Forecast, by Country 2020 & 2033
- Table 25: India TV Set Top Box Market Revenue (million) Forecast, by Application 2020 & 2033
- Table 26: India TV Set Top Box Market Volume (K Units) Forecast, by Application 2020 & 2033
- Table 27: Global TV Set Top Box Market Revenue million Forecast, by Technology 2020 & 2033
- Table 28: Global TV Set Top Box Market Volume K Units Forecast, by Technology 2020 & 2033
- Table 29: Global TV Set Top Box Market Revenue million Forecast, by Resolution 2020 & 2033
- Table 30: Global TV Set Top Box Market Volume K Units Forecast, by Resolution 2020 & 2033
- Table 31: Global TV Set Top Box Market Revenue million Forecast, by Country 2020 & 2033
- Table 32: Global TV Set Top Box Market Volume K Units Forecast, by Country 2020 & 2033
- Table 33: Global TV Set Top Box Market Revenue million Forecast, by Technology 2020 & 2033
- Table 34: Global TV Set Top Box Market Volume K Units Forecast, by Technology 2020 & 2033
- Table 35: Global TV Set Top Box Market Revenue million Forecast, by Resolution 2020 & 2033
- Table 36: Global TV Set Top Box Market Volume K Units Forecast, by Resolution 2020 & 2033
- Table 37: Global TV Set Top Box Market Revenue million Forecast, by Country 2020 & 2033
- Table 38: Global TV Set Top Box Market Volume K Units Forecast, by Country 2020 & 2033
- Table 39: Global TV Set Top Box Market Revenue million Forecast, by Technology 2020 & 2033
- Table 40: Global TV Set Top Box Market Volume K Units Forecast, by Technology 2020 & 2033
- Table 41: Global TV Set Top Box Market Revenue million Forecast, by Resolution 2020 & 2033
- Table 42: Global TV Set Top Box Market Volume K Units Forecast, by Resolution 2020 & 2033
- Table 43: Global TV Set Top Box Market Revenue million Forecast, by Country 2020 & 2033
- Table 44: Global TV Set Top Box Market Volume K Units Forecast, by Country 2020 & 2033
Frequently Asked Questions
1. What is the projected Compound Annual Growth Rate (CAGR) of the TV Set Top Box Market?
The projected CAGR is approximately 5.54%.
2. Which companies are prominent players in the TV Set Top Box Market?
Key companies in the market include ARRIS International PLC (CommScope Inc ), Evolution Digital LLC, HUMAX Electronics Co Ltd, Intek Digital Inc, Gospell Digital Technology Co Limited, Shenzhen SDMC Technology Co Ltd, Shenzhen Coship Electronics Co Ltd, Sagemcom SAS, ZTE Corporation, Skyworth Digital Ltd, Kaon Media Co Limited, Technicolor SA.
3. What are the main segments of the TV Set Top Box Market?
The market segments include Technology, Resolution.
4. Can you provide details about the market size?
The market size is estimated to be USD 307.1 million as of 2022.
5. What are some drivers contributing to market growth?
High Levels of Technological Innovations; Increasing Adoption of Set-Top Boxes in the Emerging Markets; Deployment of OS-based Devices.
6. What are the notable trends driving market growth?
HD Resolution Held the Largest Market Share.
7. Are there any restraints impacting market growth?
Growing Online OTT Services/Platform.
8. Can you provide examples of recent developments in the market?
March 2022 - The GTPL Genie, a Hybrid Android TV Set Top Box, which provides easy Live TV and OTT channels at an attractive bulk price, was introduced by GTPL Hathway Limited (GTPL), a leading supplier of digital cable TV and broadband service in India. GTPL Genie blends the strength of classic Cable TV with contemporary features and a customizable environment to offer a wide variety of content in OTT entertainment apps. Customers can now watch popular OTT app material on their existing TV screen in addition to line TV channels as part of GTPL Genie's expansion of its "Connection Dil Se" offer.
9. What pricing options are available for accessing the report?
Pricing options include single-user, multi-user, and enterprise licenses priced at USD 4750, USD 5250, and USD 8750 respectively.
10. Is the market size provided in terms of value or volume?
The market size is provided in terms of value, measured in million and volume, measured in K Units.
11. Are there any specific market keywords associated with the report?
Yes, the market keyword associated with the report is "TV Set Top Box Market," which aids in identifying and referencing the specific market segment covered.
12. How do I determine which pricing option suits my needs best?
The pricing options vary based on user requirements and access needs. Individual users may opt for single-user licenses, while businesses requiring broader access may choose multi-user or enterprise licenses for cost-effective access to the report.
13. Are there any additional resources or data provided in the TV Set Top Box Market report?
While the report offers comprehensive insights, it's advisable to review the specific contents or supplementary materials provided to ascertain if additional resources or data are available.
14. How can I stay updated on further developments or reports in the TV Set Top Box Market?
To stay informed about further developments, trends, and reports in the TV Set Top Box Market, consider subscribing to industry newsletters, following relevant companies and organizations, or regularly checking reputable industry news sources and publications.
Methodology
Step 1 - Identification of Relevant Samples Size from Population Database


Step 2 - Approaches for Defining Global Market Size (Value, Volume* & Price*)

Note*: In applicable scenarios
Step 3 - Data Sources
Primary Research
- Web Analytics
- Survey Reports
- Research Institute
- Latest Research Reports
- Opinion Leaders
Secondary Research
- Annual Reports
- White Paper
- Latest Press Release
- Industry Association
- Paid Database
- Investor Presentations

Step 4 - Data Triangulation
Involves using different sources of information in order to increase the validity of a study
These sources are likely to be stakeholders in a program - participants, other researchers, program staff, other community members, and so on.
Then we put all data in single framework & apply various statistical tools to find out the dynamic on the market.
During the analysis stage, feedback from the stakeholder groups would be compared to determine areas of agreement as well as areas of divergence