

Key Insights
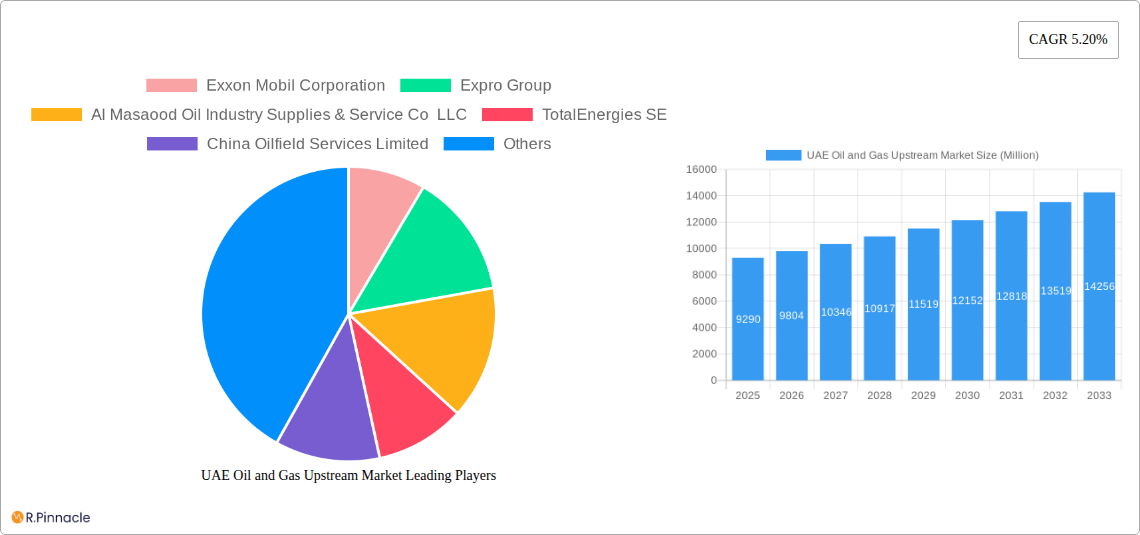
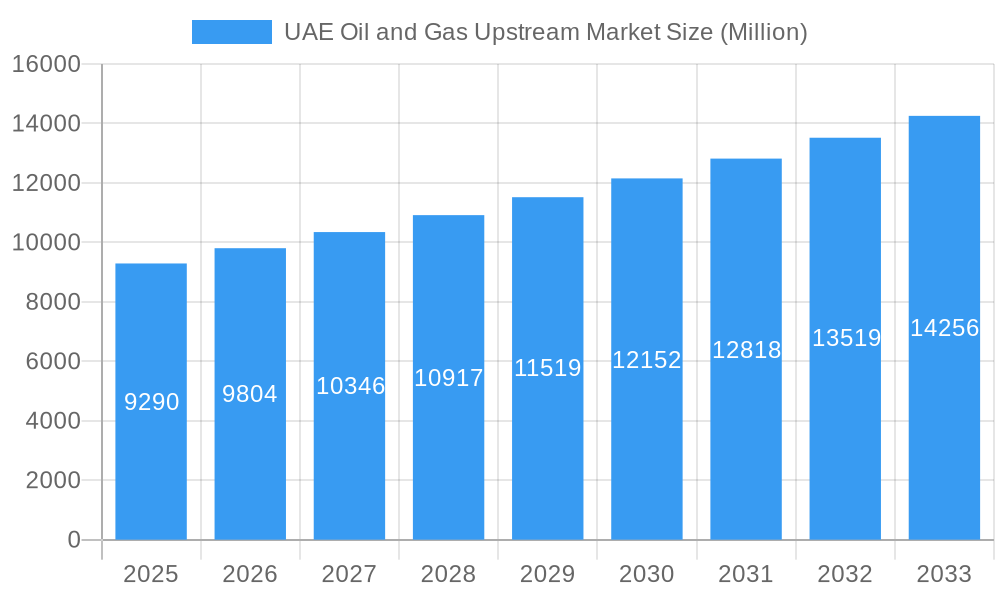
The UAE Oil and Gas Upstream Market, valued at $9.29 billion in 2025, is projected to experience robust growth, driven by sustained high oil prices, increasing energy demand, and ongoing investments in exploration and production activities. The 5.20% CAGR from 2025 to 2033 indicates a significant expansion, with the market expected to surpass $14 billion by 2033. Key growth drivers include strategic government initiatives promoting energy security, technological advancements in enhanced oil recovery (EOR) techniques, and a focus on maximizing output from existing fields. The onshore segment currently dominates, fueled by established infrastructure and extensive exploration activities. However, the offshore sector is anticipated to witness substantial growth driven by exploration of deeper waters and the development of new offshore fields. Major players such as ADNOC, Emirates National Oil Company, ExxonMobil, and Schlumberger are actively shaping the market landscape through strategic partnerships, technological innovations, and substantial investments in new projects. Competition is intensifying, with companies focusing on operational efficiency and cost optimization to maintain profitability in a fluctuating global energy market.
UAE Oil and Gas Upstream Market Market Size (In Billion)
The market segmentation by project stage (existing, pipeline, upcoming) offers valuable insights into the investment cycle and future growth trajectory. The significant number of projects in the pipeline indicates a considerable future potential for market expansion. Despite challenges such as fluctuating global oil prices and environmental regulations, the UAE’s strategic importance as a major oil producer and its commitment to long-term energy security ensures a positive outlook for the upstream oil and gas sector. The ongoing exploration activities, coupled with a supportive regulatory environment, are expected to further stimulate market growth throughout the forecast period. The robust growth is also fueled by increasing global demand for energy resources and the UAE's strategic focus on diversifying its energy portfolio while maintaining its energy dominance.
UAE Oil and Gas Upstream Market Company Market Share
UAE Oil and Gas Upstream Market: A Comprehensive Report (2019-2033)
This in-depth report provides a comprehensive analysis of the UAE oil and gas upstream market, offering invaluable insights for industry professionals, investors, and strategic decision-makers. Covering the period from 2019 to 2033, with a base year of 2025 and a forecast period from 2025 to 2033, this report meticulously examines market dynamics, key players, and future growth potential. The report leverages extensive data analysis and expert insights to present a clear, actionable picture of this dynamic sector.
UAE Oil and Gas Upstream Market Market Structure & Innovation Trends
This section analyzes the UAE's oil and gas upstream market structure, encompassing market concentration, innovation drivers, regulatory frameworks, and competitive dynamics. We explore the influence of mergers and acquisitions (M&A) activities, examining deal values and their impact on market share. The report assesses the role of product substitutes and end-user demographics in shaping market trends.
- Market Concentration: The UAE oil and gas upstream market exhibits a relatively concentrated structure, with a few major players holding significant market share. ADNOC, for example, plays a dominant role. Precise market share figures for each player will be detailed within the full report.
- Innovation Drivers: Technological advancements in exploration, drilling, and production techniques are key innovation drivers. The adoption of digital technologies and artificial intelligence is transforming operations, leading to increased efficiency and cost savings.
- Regulatory Framework: The UAE's supportive regulatory environment encourages investment and fosters growth within the sector. Specific regulations and their impact on market players will be analyzed.
- M&A Activities: The report details significant M&A activities in the historical period (2019-2024) and estimates future activity based on current trends. Specific deal values will be presented, providing insights into investment flows and market consolidation. For example, the xx Million USD acquisition of Company X by Company Y in 2023 significantly altered the market landscape.
UAE Oil and Gas Upstream Market Market Dynamics & Trends
This section delves into the market dynamics and trends shaping the UAE oil and gas upstream sector. It examines market growth drivers, technological disruptions, consumer preferences, and competitive dynamics. The report provides a comprehensive overview of the historical period (2019-2024) and projects future market growth using a Compound Annual Growth Rate (CAGR).
The UAE oil and gas upstream market is experiencing robust growth driven by factors including increasing global energy demand, government initiatives to enhance production capacity, and significant investments in exploration and production projects. Technological advancements, such as enhanced oil recovery (EOR) techniques, are boosting production efficiency. Market penetration of these advanced technologies will be analyzed.
Dominant Regions & Segments in UAE Oil and Gas Upstream Market
This section identifies the leading regions and segments within the UAE oil and gas upstream market, focusing on both onshore and offshore activities. The analysis considers existing projects, projects in the pipeline, and upcoming projects.
Onshore:
- Existing Projects: Numerous established onshore oil and gas fields contribute significantly to production.
- Projects in Pipeline: Several new onshore projects are planned, aiming to increase production capacity.
- Upcoming Projects: New exploration and development initiatives are underway to tap into untapped reserves.
Offshore:
- Existing Projects: Offshore fields represent a substantial portion of the UAE's oil and gas production.
- Projects in Pipeline: Significant investments are being made in offshore exploration and development.
- Upcoming Projects: Several large-scale offshore projects are expected to come online in the coming years.
Key drivers for dominance will be discussed in detail within the report, including economic policies, infrastructure development, and access to resources.
UAE Oil and Gas Upstream Market Product Innovations
The UAE oil and gas upstream market is witnessing significant product innovations, primarily driven by the need for improved efficiency, reduced environmental impact, and increased safety. New technologies are improving exploration techniques, enhancing production methods, and optimizing reservoir management. These advancements are improving the overall profitability and sustainability of operations.
Report Scope & Segmentation Analysis
This report segments the UAE oil and gas upstream market based on Location of Deployment (Onshore and Offshore) and Project Status (Existing Projects, Projects in Pipeline, and Upcoming Projects). Each segment's growth projections, market sizes, and competitive dynamics are analyzed, offering a granular view of market opportunities and challenges. Market size estimations for each segment (in Millions of USD) for 2025 and projected values for 2033 will be provided.
Key Drivers of UAE Oil and Gas Upstream Market Growth
Several factors contribute to the growth of the UAE oil and gas upstream market. These include: Government support through favorable policies and regulatory frameworks, significant investments in infrastructure development, technological advancements driving production efficiency, and rising global energy demand.
Challenges in the UAE Oil and Gas Upstream Market Sector
The UAE oil and gas upstream market faces various challenges, including maintaining production levels from maturing fields, managing environmental concerns, attracting and retaining skilled workforce, adapting to volatile global oil prices, and ensuring operational safety.
Emerging Opportunities in UAE Oil and Gas Upstream Market
The UAE oil and gas upstream market presents considerable opportunities, including the exploration and development of unconventional resources, investments in carbon capture and storage technologies, development of renewable energy resources, and expanding into new markets.
Leading Players in the UAE Oil and Gas Upstream Market Market
- Exxon Mobil Corporation
- Expro Group
- Al Masaood Oil Industry Supplies & Service Co LLC
- TotalEnergies SE
- China Oilfield Services Limited
- Halliburton Company
- BP PLC
- Schlumberger Limited
- Abu Dhabi National Oil Company (ADNOC)
- Emirates National Oil Company Group
Key Developments in UAE Oil and Gas Upstream Market Industry
- June 2023: ADNOC Drilling secured contracts worth USD 2 Billion from ADNOC for jack-up rig charters. This highlights significant investment in the sector and supports production growth.
- January 2022: ADNOC awarded a USD 946 Million EPC contract for the Umm Shaif field development. This underscores long-term commitment to enhancing production capacity.
Future Outlook for UAE Oil and Gas Upstream Market Market
The UAE oil and gas upstream market is poised for continued growth, driven by strategic investments, technological advancements, and supportive government policies. Future market potential is strong, with significant opportunities for companies to expand their operations and capitalize on emerging technologies. The report provides detailed projections for future market size and growth, considering various scenarios and potential disruptions.
UAE Oil and Gas Upstream Market Segmentation
-
1. Location of Deployment
- 1.1. Onshore
- 1.2. Offshore
-
2. Product Type
- 2.1. Oil
- 2.2. Natural gas
-
3. Services
- 3.1. Exploration
- 3.2. Production
- 3.3. Transportation
-
4. End User
- 4.1. Domestic
- 4.2. Export
UAE Oil and Gas Upstream Market Segmentation By Geography
-
1. North America
- 1.1. United States
- 1.2. Canada
- 1.3. Mexico
-
2. South America
- 2.1. Brazil
- 2.2. Argentina
- 2.3. Rest of South America
-
3. Europe
- 3.1. United Kingdom
- 3.2. Germany
- 3.3. France
- 3.4. Italy
- 3.5. Spain
- 3.6. Russia
- 3.7. Benelux
- 3.8. Nordics
- 3.9. Rest of Europe
-
4. Middle East & Africa
- 4.1. Turkey
- 4.2. Israel
- 4.3. GCC
- 4.4. North Africa
- 4.5. South Africa
- 4.6. Rest of Middle East & Africa
-
5. Asia Pacific
- 5.1. China
- 5.2. India
- 5.3. Japan
- 5.4. South Korea
- 5.5. ASEAN
- 5.6. Oceania
- 5.7. Rest of Asia Pacific
UAE Oil and Gas Upstream Market Regional Market Share
Geographic Coverage of UAE Oil and Gas Upstream Market
UAE Oil and Gas Upstream Market REPORT HIGHLIGHTS
| Aspects | Details |
|---|---|
| Study Period | 2020-2034 |
| Base Year | 2025 |
| Estimated Year | 2026 |
| Forecast Period | 2026-2034 |
| Historical Period | 2020-2025 |
| Growth Rate | CAGR of 5.20% from 2020-2034 |
| Segmentation |
|
Table of Contents
- 1. Introduction
- 1.1. Research Scope
- 1.2. Market Segmentation
- 1.3. Research Objective
- 1.4. Definitions and Assumptions
- 2. Executive Summary
- 2.1. Market Snapshot
- 3. Market Dynamics
- 3.1. Market Drivers
- 3.2. Market Restrains
- 3.3. Market Trends
- 3.4. Market Opportunities
- 4. Market Factor Analysis
- 4.1. Porters Five Forces
- 4.1.1. Bargaining Power of Suppliers
- 4.1.2. Bargaining Power of Buyers
- 4.1.3. Threat of New Entrants
- 4.1.4. Threat of Substitutes
- 4.1.5. Competitive Rivalry
- 4.2. PESTEL analysis
- 4.3. BCG Analysis
- 4.3.1. Stars (High Growth, High Market Share)
- 4.3.2. Cash Cows (Low Growth, High Market Share)
- 4.3.3. Question Mark (High Growth, Low Market Share)
- 4.3.4. Dogs (Low Growth, Low Market Share)
- 4.4. Ansoff Matrix Analysis
- 4.5. Supply Chain Analysis
- 4.6. Regulatory Landscape
- 4.7. Current Market Potential and Opportunity Assessment (TAM–SAM–SOM Framework)
- 4.8. PRI Analyst Note
- 4.1. Porters Five Forces
- 5. Market Analysis, Insights and Forecast 2021-2033
- 5.1. Market Analysis, Insights and Forecast - by Location of Deployment
- 5.1.1. Onshore
- 5.1.2. Offshore
- 5.2. Market Analysis, Insights and Forecast - by Product Type
- 5.2.1. Oil
- 5.2.2. Natural gas
- 5.3. Market Analysis, Insights and Forecast - by Services
- 5.3.1. Exploration
- 5.3.2. Production
- 5.3.3. Transportation
- 5.4. Market Analysis, Insights and Forecast - by End User
- 5.4.1. Domestic
- 5.4.2. Export
- 5.5. Market Analysis, Insights and Forecast - by Region
- 5.5.1. North America
- 5.5.2. South America
- 5.5.3. Europe
- 5.5.4. Middle East & Africa
- 5.5.5. Asia Pacific
- 5.1. Market Analysis, Insights and Forecast - by Location of Deployment
- 6. Global UAE Oil and Gas Upstream Market Analysis, Insights and Forecast, 2021-2033
- 6.1. Market Analysis, Insights and Forecast - by Location of Deployment
- 6.1.1. Onshore
- 6.1.2. Offshore
- 6.2. Market Analysis, Insights and Forecast - by Product Type
- 6.2.1. Oil
- 6.2.2. Natural gas
- 6.3. Market Analysis, Insights and Forecast - by Services
- 6.3.1. Exploration
- 6.3.2. Production
- 6.3.3. Transportation
- 6.4. Market Analysis, Insights and Forecast - by End User
- 6.4.1. Domestic
- 6.4.2. Export
- 6.1. Market Analysis, Insights and Forecast - by Location of Deployment
- 7. North America UAE Oil and Gas Upstream Market Analysis, Insights and Forecast, 2020-2032
- 7.1. Market Analysis, Insights and Forecast - by Location of Deployment
- 7.1.1. Onshore
- 7.1.2. Offshore
- 7.2. Market Analysis, Insights and Forecast - by Product Type
- 7.2.1. Oil
- 7.2.2. Natural gas
- 7.3. Market Analysis, Insights and Forecast - by Services
- 7.3.1. Exploration
- 7.3.2. Production
- 7.3.3. Transportation
- 7.4. Market Analysis, Insights and Forecast - by End User
- 7.4.1. Domestic
- 7.4.2. Export
- 7.1. Market Analysis, Insights and Forecast - by Location of Deployment
- 8. South America UAE Oil and Gas Upstream Market Analysis, Insights and Forecast, 2020-2032
- 8.1. Market Analysis, Insights and Forecast - by Location of Deployment
- 8.1.1. Onshore
- 8.1.2. Offshore
- 8.2. Market Analysis, Insights and Forecast - by Product Type
- 8.2.1. Oil
- 8.2.2. Natural gas
- 8.3. Market Analysis, Insights and Forecast - by Services
- 8.3.1. Exploration
- 8.3.2. Production
- 8.3.3. Transportation
- 8.4. Market Analysis, Insights and Forecast - by End User
- 8.4.1. Domestic
- 8.4.2. Export
- 8.1. Market Analysis, Insights and Forecast - by Location of Deployment
- 9. Europe UAE Oil and Gas Upstream Market Analysis, Insights and Forecast, 2020-2032
- 9.1. Market Analysis, Insights and Forecast - by Location of Deployment
- 9.1.1. Onshore
- 9.1.2. Offshore
- 9.2. Market Analysis, Insights and Forecast - by Product Type
- 9.2.1. Oil
- 9.2.2. Natural gas
- 9.3. Market Analysis, Insights and Forecast - by Services
- 9.3.1. Exploration
- 9.3.2. Production
- 9.3.3. Transportation
- 9.4. Market Analysis, Insights and Forecast - by End User
- 9.4.1. Domestic
- 9.4.2. Export
- 9.1. Market Analysis, Insights and Forecast - by Location of Deployment
- 10. Middle East & Africa UAE Oil and Gas Upstream Market Analysis, Insights and Forecast, 2020-2032
- 10.1. Market Analysis, Insights and Forecast - by Location of Deployment
- 10.1.1. Onshore
- 10.1.2. Offshore
- 10.2. Market Analysis, Insights and Forecast - by Product Type
- 10.2.1. Oil
- 10.2.2. Natural gas
- 10.3. Market Analysis, Insights and Forecast - by Services
- 10.3.1. Exploration
- 10.3.2. Production
- 10.3.3. Transportation
- 10.4. Market Analysis, Insights and Forecast - by End User
- 10.4.1. Domestic
- 10.4.2. Export
- 10.1. Market Analysis, Insights and Forecast - by Location of Deployment
- 11. Asia Pacific UAE Oil and Gas Upstream Market Analysis, Insights and Forecast, 2020-2032
- 11.1. Market Analysis, Insights and Forecast - by Location of Deployment
- 11.1.1. Onshore
- 11.1.2. Offshore
- 11.2. Market Analysis, Insights and Forecast - by Product Type
- 11.2.1. Oil
- 11.2.2. Natural gas
- 11.3. Market Analysis, Insights and Forecast - by Services
- 11.3.1. Exploration
- 11.3.2. Production
- 11.3.3. Transportation
- 11.4. Market Analysis, Insights and Forecast - by End User
- 11.4.1. Domestic
- 11.4.2. Export
- 11.1. Market Analysis, Insights and Forecast - by Location of Deployment
- 12. Competitive Analysis
- 12.1. Company Profiles
- 12.1.1 Exxon Mobil Corporation
- 12.1.1.1. Company Overview
- 12.1.1.2. Products
- 12.1.1.3. Company Financials
- 12.1.1.4. SWOT Analysis
- 12.1.2 Expro Group
- 12.1.2.1. Company Overview
- 12.1.2.2. Products
- 12.1.2.3. Company Financials
- 12.1.2.4. SWOT Analysis
- 12.1.3 Al Masaood Oil Industry Supplies & Service Co LLC
- 12.1.3.1. Company Overview
- 12.1.3.2. Products
- 12.1.3.3. Company Financials
- 12.1.3.4. SWOT Analysis
- 12.1.4 TotalEnergies SE
- 12.1.4.1. Company Overview
- 12.1.4.2. Products
- 12.1.4.3. Company Financials
- 12.1.4.4. SWOT Analysis
- 12.1.5 China Oilfield Services Limited
- 12.1.5.1. Company Overview
- 12.1.5.2. Products
- 12.1.5.3. Company Financials
- 12.1.5.4. SWOT Analysis
- 12.1.6 Halliburton Company
- 12.1.6.1. Company Overview
- 12.1.6.2. Products
- 12.1.6.3. Company Financials
- 12.1.6.4. SWOT Analysis
- 12.1.7 BP PLC
- 12.1.7.1. Company Overview
- 12.1.7.2. Products
- 12.1.7.3. Company Financials
- 12.1.7.4. SWOT Analysis
- 12.1.8 Schlumberger Limited
- 12.1.8.1. Company Overview
- 12.1.8.2. Products
- 12.1.8.3. Company Financials
- 12.1.8.4. SWOT Analysis
- 12.1.9 Abu Dhabi National Oil Company (ADNOC)
- 12.1.9.1. Company Overview
- 12.1.9.2. Products
- 12.1.9.3. Company Financials
- 12.1.9.4. SWOT Analysis
- 12.1.10 Emirates National Oil Company Group
- 12.1.10.1. Company Overview
- 12.1.10.2. Products
- 12.1.10.3. Company Financials
- 12.1.10.4. SWOT Analysis
- 12.1.1 Exxon Mobil Corporation
- 12.2. Market Entropy
- 12.2.1 Company's Key Areas Served
- 12.2.2 Recent Developments
- 12.3. Company Market Share Analysis 2025
- 12.3.1 Top 5 Companies Market Share Analysis
- 12.3.2 Top 3 Companies Market Share Analysis
- 12.4. List of Potential Customers
- 13. Research Methodology
List of Figures
- Figure 1: Global UAE Oil and Gas Upstream Market Revenue Breakdown (Million, %) by Region 2025 & 2033
- Figure 2: North America UAE Oil and Gas Upstream Market Revenue (Million), by Location of Deployment 2025 & 2033
- Figure 3: North America UAE Oil and Gas Upstream Market Revenue Share (%), by Location of Deployment 2025 & 2033
- Figure 4: North America UAE Oil and Gas Upstream Market Revenue (Million), by Product Type 2025 & 2033
- Figure 5: North America UAE Oil and Gas Upstream Market Revenue Share (%), by Product Type 2025 & 2033
- Figure 6: North America UAE Oil and Gas Upstream Market Revenue (Million), by Services 2025 & 2033
- Figure 7: North America UAE Oil and Gas Upstream Market Revenue Share (%), by Services 2025 & 2033
- Figure 8: North America UAE Oil and Gas Upstream Market Revenue (Million), by End User 2025 & 2033
- Figure 9: North America UAE Oil and Gas Upstream Market Revenue Share (%), by End User 2025 & 2033
- Figure 10: North America UAE Oil and Gas Upstream Market Revenue (Million), by Country 2025 & 2033
- Figure 11: North America UAE Oil and Gas Upstream Market Revenue Share (%), by Country 2025 & 2033
- Figure 12: South America UAE Oil and Gas Upstream Market Revenue (Million), by Location of Deployment 2025 & 2033
- Figure 13: South America UAE Oil and Gas Upstream Market Revenue Share (%), by Location of Deployment 2025 & 2033
- Figure 14: South America UAE Oil and Gas Upstream Market Revenue (Million), by Product Type 2025 & 2033
- Figure 15: South America UAE Oil and Gas Upstream Market Revenue Share (%), by Product Type 2025 & 2033
- Figure 16: South America UAE Oil and Gas Upstream Market Revenue (Million), by Services 2025 & 2033
- Figure 17: South America UAE Oil and Gas Upstream Market Revenue Share (%), by Services 2025 & 2033
- Figure 18: South America UAE Oil and Gas Upstream Market Revenue (Million), by End User 2025 & 2033
- Figure 19: South America UAE Oil and Gas Upstream Market Revenue Share (%), by End User 2025 & 2033
- Figure 20: South America UAE Oil and Gas Upstream Market Revenue (Million), by Country 2025 & 2033
- Figure 21: South America UAE Oil and Gas Upstream Market Revenue Share (%), by Country 2025 & 2033
- Figure 22: Europe UAE Oil and Gas Upstream Market Revenue (Million), by Location of Deployment 2025 & 2033
- Figure 23: Europe UAE Oil and Gas Upstream Market Revenue Share (%), by Location of Deployment 2025 & 2033
- Figure 24: Europe UAE Oil and Gas Upstream Market Revenue (Million), by Product Type 2025 & 2033
- Figure 25: Europe UAE Oil and Gas Upstream Market Revenue Share (%), by Product Type 2025 & 2033
- Figure 26: Europe UAE Oil and Gas Upstream Market Revenue (Million), by Services 2025 & 2033
- Figure 27: Europe UAE Oil and Gas Upstream Market Revenue Share (%), by Services 2025 & 2033
- Figure 28: Europe UAE Oil and Gas Upstream Market Revenue (Million), by End User 2025 & 2033
- Figure 29: Europe UAE Oil and Gas Upstream Market Revenue Share (%), by End User 2025 & 2033
- Figure 30: Europe UAE Oil and Gas Upstream Market Revenue (Million), by Country 2025 & 2033
- Figure 31: Europe UAE Oil and Gas Upstream Market Revenue Share (%), by Country 2025 & 2033
- Figure 32: Middle East & Africa UAE Oil and Gas Upstream Market Revenue (Million), by Location of Deployment 2025 & 2033
- Figure 33: Middle East & Africa UAE Oil and Gas Upstream Market Revenue Share (%), by Location of Deployment 2025 & 2033
- Figure 34: Middle East & Africa UAE Oil and Gas Upstream Market Revenue (Million), by Product Type 2025 & 2033
- Figure 35: Middle East & Africa UAE Oil and Gas Upstream Market Revenue Share (%), by Product Type 2025 & 2033
- Figure 36: Middle East & Africa UAE Oil and Gas Upstream Market Revenue (Million), by Services 2025 & 2033
- Figure 37: Middle East & Africa UAE Oil and Gas Upstream Market Revenue Share (%), by Services 2025 & 2033
- Figure 38: Middle East & Africa UAE Oil and Gas Upstream Market Revenue (Million), by End User 2025 & 2033
- Figure 39: Middle East & Africa UAE Oil and Gas Upstream Market Revenue Share (%), by End User 2025 & 2033
- Figure 40: Middle East & Africa UAE Oil and Gas Upstream Market Revenue (Million), by Country 2025 & 2033
- Figure 41: Middle East & Africa UAE Oil and Gas Upstream Market Revenue Share (%), by Country 2025 & 2033
- Figure 42: Asia Pacific UAE Oil and Gas Upstream Market Revenue (Million), by Location of Deployment 2025 & 2033
- Figure 43: Asia Pacific UAE Oil and Gas Upstream Market Revenue Share (%), by Location of Deployment 2025 & 2033
- Figure 44: Asia Pacific UAE Oil and Gas Upstream Market Revenue (Million), by Product Type 2025 & 2033
- Figure 45: Asia Pacific UAE Oil and Gas Upstream Market Revenue Share (%), by Product Type 2025 & 2033
- Figure 46: Asia Pacific UAE Oil and Gas Upstream Market Revenue (Million), by Services 2025 & 2033
- Figure 47: Asia Pacific UAE Oil and Gas Upstream Market Revenue Share (%), by Services 2025 & 2033
- Figure 48: Asia Pacific UAE Oil and Gas Upstream Market Revenue (Million), by End User 2025 & 2033
- Figure 49: Asia Pacific UAE Oil and Gas Upstream Market Revenue Share (%), by End User 2025 & 2033
- Figure 50: Asia Pacific UAE Oil and Gas Upstream Market Revenue (Million), by Country 2025 & 2033
- Figure 51: Asia Pacific UAE Oil and Gas Upstream Market Revenue Share (%), by Country 2025 & 2033
List of Tables
- Table 1: Global UAE Oil and Gas Upstream Market Revenue Million Forecast, by Location of Deployment 2020 & 2033
- Table 2: Global UAE Oil and Gas Upstream Market Revenue Million Forecast, by Product Type 2020 & 2033
- Table 3: Global UAE Oil and Gas Upstream Market Revenue Million Forecast, by Services 2020 & 2033
- Table 4: Global UAE Oil and Gas Upstream Market Revenue Million Forecast, by End User 2020 & 2033
- Table 5: Global UAE Oil and Gas Upstream Market Revenue Million Forecast, by Region 2020 & 2033
- Table 6: Global UAE Oil and Gas Upstream Market Revenue Million Forecast, by Location of Deployment 2020 & 2033
- Table 7: Global UAE Oil and Gas Upstream Market Revenue Million Forecast, by Product Type 2020 & 2033
- Table 8: Global UAE Oil and Gas Upstream Market Revenue Million Forecast, by Services 2020 & 2033
- Table 9: Global UAE Oil and Gas Upstream Market Revenue Million Forecast, by End User 2020 & 2033
- Table 10: Global UAE Oil and Gas Upstream Market Revenue Million Forecast, by Country 2020 & 2033
- Table 11: United States UAE Oil and Gas Upstream Market Revenue (Million) Forecast, by Application 2020 & 2033
- Table 12: Canada UAE Oil and Gas Upstream Market Revenue (Million) Forecast, by Application 2020 & 2033
- Table 13: Mexico UAE Oil and Gas Upstream Market Revenue (Million) Forecast, by Application 2020 & 2033
- Table 14: Global UAE Oil and Gas Upstream Market Revenue Million Forecast, by Location of Deployment 2020 & 2033
- Table 15: Global UAE Oil and Gas Upstream Market Revenue Million Forecast, by Product Type 2020 & 2033
- Table 16: Global UAE Oil and Gas Upstream Market Revenue Million Forecast, by Services 2020 & 2033
- Table 17: Global UAE Oil and Gas Upstream Market Revenue Million Forecast, by End User 2020 & 2033
- Table 18: Global UAE Oil and Gas Upstream Market Revenue Million Forecast, by Country 2020 & 2033
- Table 19: Brazil UAE Oil and Gas Upstream Market Revenue (Million) Forecast, by Application 2020 & 2033
- Table 20: Argentina UAE Oil and Gas Upstream Market Revenue (Million) Forecast, by Application 2020 & 2033
- Table 21: Rest of South America UAE Oil and Gas Upstream Market Revenue (Million) Forecast, by Application 2020 & 2033
- Table 22: Global UAE Oil and Gas Upstream Market Revenue Million Forecast, by Location of Deployment 2020 & 2033
- Table 23: Global UAE Oil and Gas Upstream Market Revenue Million Forecast, by Product Type 2020 & 2033
- Table 24: Global UAE Oil and Gas Upstream Market Revenue Million Forecast, by Services 2020 & 2033
- Table 25: Global UAE Oil and Gas Upstream Market Revenue Million Forecast, by End User 2020 & 2033
- Table 26: Global UAE Oil and Gas Upstream Market Revenue Million Forecast, by Country 2020 & 2033
- Table 27: United Kingdom UAE Oil and Gas Upstream Market Revenue (Million) Forecast, by Application 2020 & 2033
- Table 28: Germany UAE Oil and Gas Upstream Market Revenue (Million) Forecast, by Application 2020 & 2033
- Table 29: France UAE Oil and Gas Upstream Market Revenue (Million) Forecast, by Application 2020 & 2033
- Table 30: Italy UAE Oil and Gas Upstream Market Revenue (Million) Forecast, by Application 2020 & 2033
- Table 31: Spain UAE Oil and Gas Upstream Market Revenue (Million) Forecast, by Application 2020 & 2033
- Table 32: Russia UAE Oil and Gas Upstream Market Revenue (Million) Forecast, by Application 2020 & 2033
- Table 33: Benelux UAE Oil and Gas Upstream Market Revenue (Million) Forecast, by Application 2020 & 2033
- Table 34: Nordics UAE Oil and Gas Upstream Market Revenue (Million) Forecast, by Application 2020 & 2033
- Table 35: Rest of Europe UAE Oil and Gas Upstream Market Revenue (Million) Forecast, by Application 2020 & 2033
- Table 36: Global UAE Oil and Gas Upstream Market Revenue Million Forecast, by Location of Deployment 2020 & 2033
- Table 37: Global UAE Oil and Gas Upstream Market Revenue Million Forecast, by Product Type 2020 & 2033
- Table 38: Global UAE Oil and Gas Upstream Market Revenue Million Forecast, by Services 2020 & 2033
- Table 39: Global UAE Oil and Gas Upstream Market Revenue Million Forecast, by End User 2020 & 2033
- Table 40: Global UAE Oil and Gas Upstream Market Revenue Million Forecast, by Country 2020 & 2033
- Table 41: Turkey UAE Oil and Gas Upstream Market Revenue (Million) Forecast, by Application 2020 & 2033
- Table 42: Israel UAE Oil and Gas Upstream Market Revenue (Million) Forecast, by Application 2020 & 2033
- Table 43: GCC UAE Oil and Gas Upstream Market Revenue (Million) Forecast, by Application 2020 & 2033
- Table 44: North Africa UAE Oil and Gas Upstream Market Revenue (Million) Forecast, by Application 2020 & 2033
- Table 45: South Africa UAE Oil and Gas Upstream Market Revenue (Million) Forecast, by Application 2020 & 2033
- Table 46: Rest of Middle East & Africa UAE Oil and Gas Upstream Market Revenue (Million) Forecast, by Application 2020 & 2033
- Table 47: Global UAE Oil and Gas Upstream Market Revenue Million Forecast, by Location of Deployment 2020 & 2033
- Table 48: Global UAE Oil and Gas Upstream Market Revenue Million Forecast, by Product Type 2020 & 2033
- Table 49: Global UAE Oil and Gas Upstream Market Revenue Million Forecast, by Services 2020 & 2033
- Table 50: Global UAE Oil and Gas Upstream Market Revenue Million Forecast, by End User 2020 & 2033
- Table 51: Global UAE Oil and Gas Upstream Market Revenue Million Forecast, by Country 2020 & 2033
- Table 52: China UAE Oil and Gas Upstream Market Revenue (Million) Forecast, by Application 2020 & 2033
- Table 53: India UAE Oil and Gas Upstream Market Revenue (Million) Forecast, by Application 2020 & 2033
- Table 54: Japan UAE Oil and Gas Upstream Market Revenue (Million) Forecast, by Application 2020 & 2033
- Table 55: South Korea UAE Oil and Gas Upstream Market Revenue (Million) Forecast, by Application 2020 & 2033
- Table 56: ASEAN UAE Oil and Gas Upstream Market Revenue (Million) Forecast, by Application 2020 & 2033
- Table 57: Oceania UAE Oil and Gas Upstream Market Revenue (Million) Forecast, by Application 2020 & 2033
- Table 58: Rest of Asia Pacific UAE Oil and Gas Upstream Market Revenue (Million) Forecast, by Application 2020 & 2033
Frequently Asked Questions
1. What is the projected Compound Annual Growth Rate (CAGR) of the UAE Oil and Gas Upstream Market?
The projected CAGR is approximately 5.20%.
2. Which companies are prominent players in the UAE Oil and Gas Upstream Market?
Key companies in the market include Exxon Mobil Corporation, Expro Group, Al Masaood Oil Industry Supplies & Service Co LLC, TotalEnergies SE, China Oilfield Services Limited, Halliburton Company, BP PLC, Schlumberger Limited, Abu Dhabi National Oil Company (ADNOC), Emirates National Oil Company Group.
3. What are the main segments of the UAE Oil and Gas Upstream Market?
The market segments include Location of Deployment, Product Type, Services, End User.
4. Can you provide details about the market size?
The market size is estimated to be USD 9.29 Million as of 2022.
5. What are some drivers contributing to market growth?
Increasing Natural Gas Production4.; Rising Upstream Oil and Gas Investments.
6. What are the notable trends driving market growth?
Onshore Segment to Witness Significant Growth.
7. Are there any restraints impacting market growth?
Plans to Diversify the Power Generation Mix by Adoption of Renewable Energy Sources.
8. Can you provide examples of recent developments in the market?
June 2023, United Arab Emitates-based ADNOC Drilling secured contracts worth USD 2 billion from state-owned Abu Dhabi National Oil Company (ADNOC) involving the charter of multiple jack-up rigs.
9. What pricing options are available for accessing the report?
Pricing options include single-user, multi-user, and enterprise licenses priced at USD 3800, USD 4500, and USD 5800 respectively.
10. Is the market size provided in terms of value or volume?
The market size is provided in terms of value, measured in Million.
11. Are there any specific market keywords associated with the report?
Yes, the market keyword associated with the report is "UAE Oil and Gas Upstream Market," which aids in identifying and referencing the specific market segment covered.
12. How do I determine which pricing option suits my needs best?
The pricing options vary based on user requirements and access needs. Individual users may opt for single-user licenses, while businesses requiring broader access may choose multi-user or enterprise licenses for cost-effective access to the report.
13. Are there any additional resources or data provided in the UAE Oil and Gas Upstream Market report?
While the report offers comprehensive insights, it's advisable to review the specific contents or supplementary materials provided to ascertain if additional resources or data are available.
14. How can I stay updated on further developments or reports in the UAE Oil and Gas Upstream Market?
To stay informed about further developments, trends, and reports in the UAE Oil and Gas Upstream Market, consider subscribing to industry newsletters, following relevant companies and organizations, or regularly checking reputable industry news sources and publications.
Methodology
Step 1 - Identification of Relevant Samples Size from Population Database


Step 2 - Approaches for Defining Global Market Size (Value, Volume* & Price*)

Note*: In applicable scenarios
Step 3 - Data Sources
Primary Research
- Web Analytics
- Survey Reports
- Research Institute
- Latest Research Reports
- Opinion Leaders
Secondary Research
- Annual Reports
- White Paper
- Latest Press Release
- Industry Association
- Paid Database
- Investor Presentations

Step 4 - Data Triangulation
Involves using different sources of information in order to increase the validity of a study
These sources are likely to be stakeholders in a program - participants, other researchers, program staff, other community members, and so on.
Then we put all data in single framework & apply various statistical tools to find out the dynamic on the market.
During the analysis stage, feedback from the stakeholder groups would be compared to determine areas of agreement as well as areas of divergence