

Key Insights
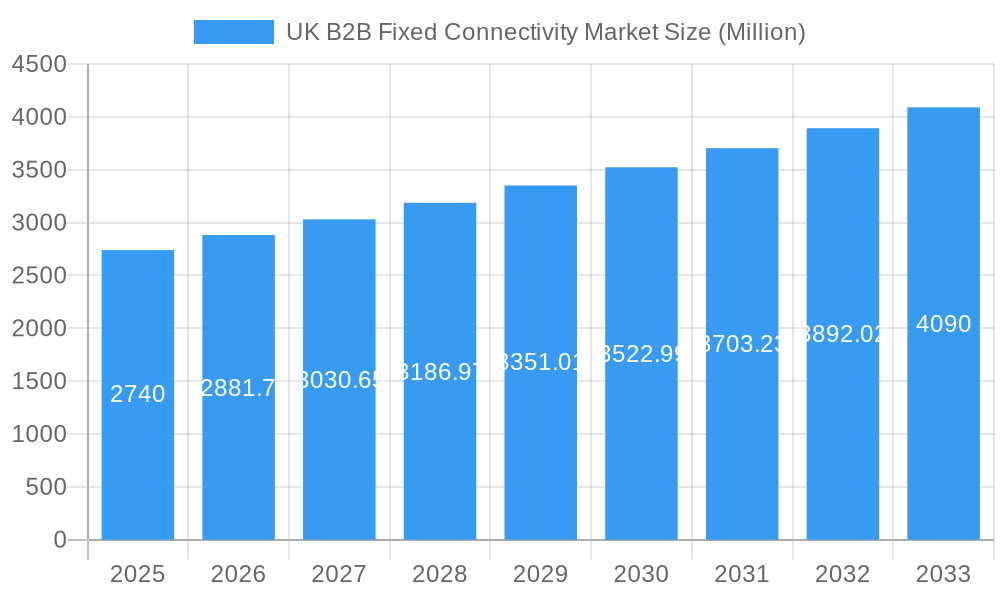
The UK B2B fixed connectivity market, valued at £2.74 billion in 2025, is projected to experience robust growth, driven by increasing digitalization across various sectors, the expanding adoption of cloud-based services, and the rising demand for high-bandwidth connectivity solutions. Businesses are increasingly reliant on reliable and fast internet access for operational efficiency, collaboration, and data management. This fuels the demand for advanced fixed connectivity solutions like fiber optic networks and Ethernet connections, offering greater speeds and reliability compared to traditional technologies. The market's expansion is also fueled by government initiatives promoting digital infrastructure improvements and increasing investments in 5G and other next-generation network technologies. Key players like BT Group, Vodafone, and Virgin Media Business are actively expanding their network infrastructure and service offerings to cater to this growing demand. Competitive pressures are driving innovation and price optimization, making these services increasingly accessible to a wider range of businesses.
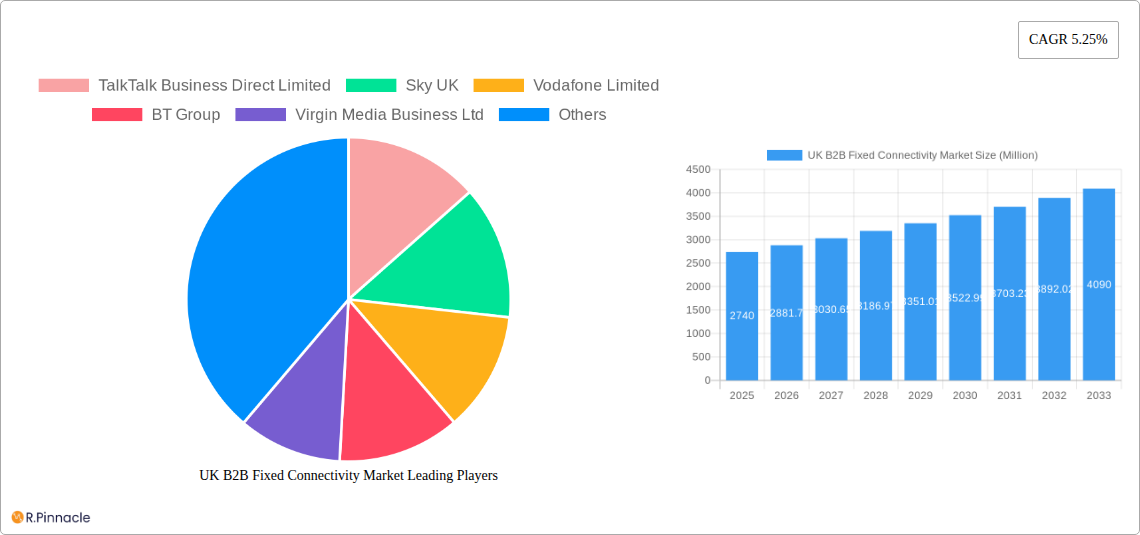
UK B2B Fixed Connectivity Market Market Size (In Billion)
However, challenges remain. The market faces potential restraints including the high cost of infrastructure deployment, particularly in underserved rural areas, and the need for ongoing investment in network maintenance and upgrades. Regulatory hurdles and competition from alternative connectivity solutions, such as wireless broadband, also impact market growth. Despite these challenges, the long-term outlook for the UK B2B fixed connectivity market remains positive, with projected consistent growth fueled by sustained demand and technological advancements. The market segmentation is likely to evolve, with a growing focus on specialized solutions tailored to the unique connectivity needs of different industry verticals. Further, sustainable growth will depend on addressing the digital divide and ensuring equitable access to high-speed internet for businesses of all sizes, regardless of their geographical location.
UK B2B Fixed Connectivity Market Company Market Share
UK B2B Fixed Connectivity Market Report: 2019-2033
This comprehensive report provides an in-depth analysis of the UK B2B fixed connectivity market, offering invaluable insights for industry professionals, investors, and strategic planners. Covering the period 2019-2033, with a focus on 2025, this report meticulously examines market structure, dynamics, key players, and future trends. The analysis leverages extensive data and expert insights to deliver actionable intelligence for navigating this rapidly evolving landscape. The market is projected to reach xx Million by 2033.
UK B2B Fixed Connectivity Market Structure & Innovation Trends
This section analyzes the competitive landscape, innovation drivers, and regulatory influences shaping the UK B2B fixed connectivity market. The market exhibits a moderate level of concentration, with a few dominant players and a number of smaller niche providers. Market share data for 2024 suggests BT Group holds the largest share, followed by Vodafone Limited and Virgin Media Business Ltd. However, smaller players are aggressively pursuing market share through specialized offerings and strategic partnerships.
- Market Concentration: Moderately concentrated, with BT Group, Vodafone Limited, and Virgin Media Business Ltd dominating.
- Innovation Drivers: Demand for higher bandwidth, increased reliance on cloud services, and the growing adoption of IoT are key drivers of innovation.
- Regulatory Framework: OFCOM's regulations significantly impact market dynamics, particularly regarding pricing, infrastructure investment, and consumer protection.
- Product Substitutes: Wireless connectivity (5G, 4G) poses a growing challenge, particularly for smaller providers. The rise of satellite internet could also impact future market share.
- End-User Demographics: The market is diverse, encompassing SMEs, large enterprises, and government organizations, each with unique connectivity needs.
- M&A Activities: The past five years have witnessed several mergers and acquisitions, with deal values ranging from xx Million to xx Million, reflecting consolidation and expansion strategies. Examples include [Specific examples of M&A activities if available, otherwise state "Data not publicly available"].
UK B2B Fixed Connectivity Market Dynamics & Trends
The UK B2B fixed connectivity market is characterized by robust growth, driven by factors such as increasing digitalization, rising data consumption, and government initiatives promoting broadband expansion. Technological advancements, such as the rollout of FTTP networks and the exploration of technologies like L4S over PON, are transforming the market landscape. Competition is intense, with providers continually innovating to improve network speeds, reliability, and service offerings. The market exhibits a Compound Annual Growth Rate (CAGR) of xx% during the forecast period (2025-2033), with market penetration expected to reach xx% by 2033. Consumer preferences are shifting towards higher bandwidth, more reliable connectivity, and bundled services, impacting provider strategies.
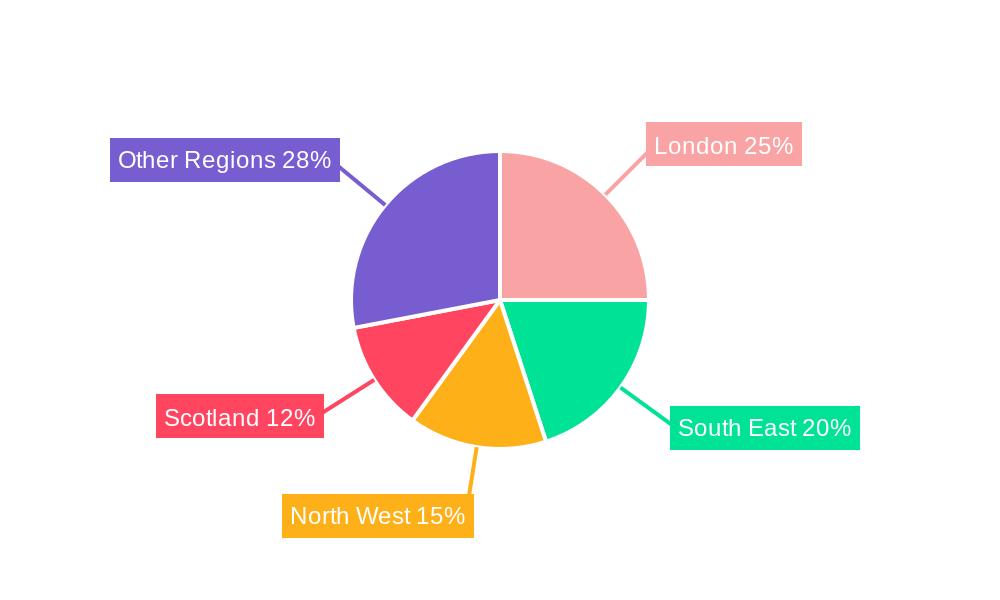
Dominant Regions & Segments in UK B2B Fixed Connectivity Market
London and other major urban centers are the dominant regions, driven by high business density, strong economic activity, and advanced infrastructure. However, government initiatives focusing on bridging the digital divide are driving growth in rural and underserved areas. The segment analysis reveals that the enterprise segment is the largest contributor, followed by the SME segment.
- Key Drivers for London Dominance:
- High concentration of businesses and data centers.
- Advanced infrastructure and readily available fiber optic networks.
- Strong economic activity and high demand for high-bandwidth connectivity.
- Key Drivers for Growth in Rural Areas:
- Government initiatives to improve digital infrastructure.
- Increased demand from businesses and residents in previously underserved areas.
- Investment in rural broadband infrastructure projects.
UK B2B Fixed Connectivity Market Product Innovations
Recent product innovations include the introduction of higher-speed fiber optic connections (FTTP), enhanced network security features, and tailored solutions for specific industry needs. The market is witnessing a shift towards Software-Defined Networking (SDN) and Network Function Virtualization (NFV) to enhance network agility and flexibility. Providers are focusing on offering bundled services, integrating connectivity with other IT solutions to provide a comprehensive package for businesses.
Report Scope & Segmentation Analysis
This report segments the UK B2B fixed connectivity market based on several factors, including connection type (fiber, DSL, cable), bandwidth (gigabit, etc.), deployment type (leased line, Ethernet), and end-user (SMEs, large enterprises, government). Each segment is analyzed based on its current market size, growth projections, and competitive landscape. For example, the Fiber segment is expected to experience substantial growth due to the ongoing investment in FTTP infrastructure.
Key Drivers of UK B2B Fixed Connectivity Market Growth
Several factors are fueling the growth of the UK B2B fixed connectivity market. These include increasing digitalization across various industries, rising demand for cloud-based services, the proliferation of IoT devices, and government support for infrastructure development. The ongoing expansion of 5G infrastructure will indirectly boost demand for fixed connectivity, creating a need for robust backhaul networks. Furthermore, stringent data privacy regulations are driving businesses towards secure and reliable fixed connectivity solutions.
Challenges in the UK B2B Fixed Connectivity Market Sector
The market faces several challenges including the high cost of infrastructure development, particularly in rural areas. Competition is intense, putting pressure on pricing and profit margins. Securing skilled workforce and managing supply chain disruptions also pose ongoing hurdles. Furthermore, regulatory changes and evolving customer expectations necessitate continuous adaptation and innovation.
Emerging Opportunities in UK B2B Fixed Connectivity Market
Emerging opportunities lie in providing specialized connectivity solutions for specific sectors (e.g., healthcare, finance, manufacturing) and leveraging technologies like SDN and NFV to enhance network efficiency. The rising adoption of edge computing offers opportunities for providers to offer localized, low-latency connectivity solutions. Expansion into rural and underserved areas presents significant growth potential, alongside the development of next-generation network technologies beyond fiber.
Leading Players in the UK B2B Fixed Connectivity Market Market
- TalkTalk Business Direct Limited
- Sky UK
- Vodafone Limited
- BT Group
- Virgin Media Business Ltd
- bOnline Limited
- KCOM Group Limited
- Hyperoptic Ltd
- Gigaclear Ltd
- XLN Telecom Ltd
- Chess Lt
Key Developments in UK B2B Fixed Connectivity Market Industry
- May 2024: Openreach announced a GBP 15 billion (~USD 18.65 billion) investment to extend full-fiber broadband services to 517 new locations, adding 2.7 million FTTP connections. This significantly boosts the availability of high-speed broadband, especially in previously underserved areas.
- April 2024: Vodafone and Nokia successfully demonstrated L4S technology over PON, showcasing potential for significantly enhanced online experiences, particularly for video conferencing and gaming. This could drive demand for higher-bandwidth connectivity solutions.
Future Outlook for UK B2B Fixed Connectivity Market Market
The UK B2B fixed connectivity market is poised for continued growth, driven by ongoing technological advancements, increasing digitalization, and sustained investment in infrastructure. The rollout of FTTP networks, alongside innovations like L4S technology, will significantly enhance network capacity and performance, fueling demand for higher-bandwidth services. Strategic partnerships and acquisitions will continue to shape the market landscape, with providers focusing on delivering innovative and customized solutions to cater to the evolving needs of businesses across diverse sectors.
UK B2B Fixed Connectivity Market Segmentation
-
1. Type
- 1.1. Fixed Data
- 1.2. Fixed Voice
-
2. Size of Enterprises
- 2.1. Small and Medium-sized Enterprises (SMEs)
- 2.2. Large Enterprises
UK B2B Fixed Connectivity Market Segmentation By Geography
-
1. North America
- 1.1. United States
- 1.2. Canada
- 1.3. Mexico
-
2. South America
- 2.1. Brazil
- 2.2. Argentina
- 2.3. Rest of South America
-
3. Europe
- 3.1. United Kingdom
- 3.2. Germany
- 3.3. France
- 3.4. Italy
- 3.5. Spain
- 3.6. Russia
- 3.7. Benelux
- 3.8. Nordics
- 3.9. Rest of Europe
-
4. Middle East & Africa
- 4.1. Turkey
- 4.2. Israel
- 4.3. GCC
- 4.4. North Africa
- 4.5. South Africa
- 4.6. Rest of Middle East & Africa
-
5. Asia Pacific
- 5.1. China
- 5.2. India
- 5.3. Japan
- 5.4. South Korea
- 5.5. ASEAN
- 5.6. Oceania
- 5.7. Rest of Asia Pacific
UK B2B Fixed Connectivity Market Regional Market Share
Geographic Coverage of UK B2B Fixed Connectivity Market
UK B2B Fixed Connectivity Market REPORT HIGHLIGHTS
| Aspects | Details |
|---|---|
| Study Period | 2020-2034 |
| Base Year | 2025 |
| Estimated Year | 2026 |
| Forecast Period | 2026-2034 |
| Historical Period | 2020-2025 |
| Growth Rate | CAGR of 5.25% from 2020-2034 |
| Segmentation |
|
Table of Contents
- 1. Introduction
- 1.1. Research Scope
- 1.2. Market Segmentation
- 1.3. Research Objective
- 1.4. Definitions and Assumptions
- 2. Executive Summary
- 2.1. Market Snapshot
- 3. Market Dynamics
- 3.1. Market Drivers
- 3.2. Market Restrains
- 3.3. Market Trends
- 3.4. Market Opportunities
- 4. Market Factor Analysis
- 4.1. Porters Five Forces
- 4.1.1. Bargaining Power of Suppliers
- 4.1.2. Bargaining Power of Buyers
- 4.1.3. Threat of New Entrants
- 4.1.4. Threat of Substitutes
- 4.1.5. Competitive Rivalry
- 4.2. PESTEL analysis
- 4.3. BCG Analysis
- 4.3.1. Stars (High Growth, High Market Share)
- 4.3.2. Cash Cows (Low Growth, High Market Share)
- 4.3.3. Question Mark (High Growth, Low Market Share)
- 4.3.4. Dogs (Low Growth, Low Market Share)
- 4.4. Ansoff Matrix Analysis
- 4.5. Supply Chain Analysis
- 4.6. Regulatory Landscape
- 4.7. Current Market Potential and Opportunity Assessment (TAM–SAM–SOM Framework)
- 4.8. PRI Analyst Note
- 4.1. Porters Five Forces
- 5. Market Analysis, Insights and Forecast 2021-2033
- 5.1. Market Analysis, Insights and Forecast - by Type
- 5.1.1. Fixed Data
- 5.1.2. Fixed Voice
- 5.2. Market Analysis, Insights and Forecast - by Size of Enterprises
- 5.2.1. Small and Medium-sized Enterprises (SMEs)
- 5.2.2. Large Enterprises
- 5.3. Market Analysis, Insights and Forecast - by Region
- 5.3.1. North America
- 5.3.2. South America
- 5.3.3. Europe
- 5.3.4. Middle East & Africa
- 5.3.5. Asia Pacific
- 5.1. Market Analysis, Insights and Forecast - by Type
- 6. Global UK B2B Fixed Connectivity Market Analysis, Insights and Forecast, 2021-2033
- 6.1. Market Analysis, Insights and Forecast - by Type
- 6.1.1. Fixed Data
- 6.1.2. Fixed Voice
- 6.2. Market Analysis, Insights and Forecast - by Size of Enterprises
- 6.2.1. Small and Medium-sized Enterprises (SMEs)
- 6.2.2. Large Enterprises
- 6.1. Market Analysis, Insights and Forecast - by Type
- 7. North America UK B2B Fixed Connectivity Market Analysis, Insights and Forecast, 2020-2032
- 7.1. Market Analysis, Insights and Forecast - by Type
- 7.1.1. Fixed Data
- 7.1.2. Fixed Voice
- 7.2. Market Analysis, Insights and Forecast - by Size of Enterprises
- 7.2.1. Small and Medium-sized Enterprises (SMEs)
- 7.2.2. Large Enterprises
- 7.1. Market Analysis, Insights and Forecast - by Type
- 8. South America UK B2B Fixed Connectivity Market Analysis, Insights and Forecast, 2020-2032
- 8.1. Market Analysis, Insights and Forecast - by Type
- 8.1.1. Fixed Data
- 8.1.2. Fixed Voice
- 8.2. Market Analysis, Insights and Forecast - by Size of Enterprises
- 8.2.1. Small and Medium-sized Enterprises (SMEs)
- 8.2.2. Large Enterprises
- 8.1. Market Analysis, Insights and Forecast - by Type
- 9. Europe UK B2B Fixed Connectivity Market Analysis, Insights and Forecast, 2020-2032
- 9.1. Market Analysis, Insights and Forecast - by Type
- 9.1.1. Fixed Data
- 9.1.2. Fixed Voice
- 9.2. Market Analysis, Insights and Forecast - by Size of Enterprises
- 9.2.1. Small and Medium-sized Enterprises (SMEs)
- 9.2.2. Large Enterprises
- 9.1. Market Analysis, Insights and Forecast - by Type
- 10. Middle East & Africa UK B2B Fixed Connectivity Market Analysis, Insights and Forecast, 2020-2032
- 10.1. Market Analysis, Insights and Forecast - by Type
- 10.1.1. Fixed Data
- 10.1.2. Fixed Voice
- 10.2. Market Analysis, Insights and Forecast - by Size of Enterprises
- 10.2.1. Small and Medium-sized Enterprises (SMEs)
- 10.2.2. Large Enterprises
- 10.1. Market Analysis, Insights and Forecast - by Type
- 11. Asia Pacific UK B2B Fixed Connectivity Market Analysis, Insights and Forecast, 2020-2032
- 11.1. Market Analysis, Insights and Forecast - by Type
- 11.1.1. Fixed Data
- 11.1.2. Fixed Voice
- 11.2. Market Analysis, Insights and Forecast - by Size of Enterprises
- 11.2.1. Small and Medium-sized Enterprises (SMEs)
- 11.2.2. Large Enterprises
- 11.1. Market Analysis, Insights and Forecast - by Type
- 12. Competitive Analysis
- 12.1. Company Profiles
- 12.1.1 TalkTalk Business Direct Limited
- 12.1.1.1. Company Overview
- 12.1.1.2. Products
- 12.1.1.3. Company Financials
- 12.1.1.4. SWOT Analysis
- 12.1.2 Sky UK
- 12.1.2.1. Company Overview
- 12.1.2.2. Products
- 12.1.2.3. Company Financials
- 12.1.2.4. SWOT Analysis
- 12.1.3 Vodafone Limited
- 12.1.3.1. Company Overview
- 12.1.3.2. Products
- 12.1.3.3. Company Financials
- 12.1.3.4. SWOT Analysis
- 12.1.4 BT Group
- 12.1.4.1. Company Overview
- 12.1.4.2. Products
- 12.1.4.3. Company Financials
- 12.1.4.4. SWOT Analysis
- 12.1.5 Virgin Media Business Ltd
- 12.1.5.1. Company Overview
- 12.1.5.2. Products
- 12.1.5.3. Company Financials
- 12.1.5.4. SWOT Analysis
- 12.1.6 bOnline Limited
- 12.1.6.1. Company Overview
- 12.1.6.2. Products
- 12.1.6.3. Company Financials
- 12.1.6.4. SWOT Analysis
- 12.1.7 KCOM Group Limited
- 12.1.7.1. Company Overview
- 12.1.7.2. Products
- 12.1.7.3. Company Financials
- 12.1.7.4. SWOT Analysis
- 12.1.8 Hyperoptic Ltd
- 12.1.8.1. Company Overview
- 12.1.8.2. Products
- 12.1.8.3. Company Financials
- 12.1.8.4. SWOT Analysis
- 12.1.9 Gigaclear Ltd
- 12.1.9.1. Company Overview
- 12.1.9.2. Products
- 12.1.9.3. Company Financials
- 12.1.9.4. SWOT Analysis
- 12.1.10 XLN Telecom Ltd
- 12.1.10.1. Company Overview
- 12.1.10.2. Products
- 12.1.10.3. Company Financials
- 12.1.10.4. SWOT Analysis
- 12.1.11 Chess Lt
- 12.1.11.1. Company Overview
- 12.1.11.2. Products
- 12.1.11.3. Company Financials
- 12.1.11.4. SWOT Analysis
- 12.1.1 TalkTalk Business Direct Limited
- 12.2. Market Entropy
- 12.2.1 Company's Key Areas Served
- 12.2.2 Recent Developments
- 12.3. Company Market Share Analysis 2025
- 12.3.1 Top 5 Companies Market Share Analysis
- 12.3.2 Top 3 Companies Market Share Analysis
- 12.4. List of Potential Customers
- 13. Research Methodology
List of Figures
- Figure 1: Global UK B2B Fixed Connectivity Market Revenue Breakdown (Million, %) by Region 2025 & 2033
- Figure 2: Global UK B2B Fixed Connectivity Market Volume Breakdown (Billion, %) by Region 2025 & 2033
- Figure 3: North America UK B2B Fixed Connectivity Market Revenue (Million), by Type 2025 & 2033
- Figure 4: North America UK B2B Fixed Connectivity Market Volume (Billion), by Type 2025 & 2033
- Figure 5: North America UK B2B Fixed Connectivity Market Revenue Share (%), by Type 2025 & 2033
- Figure 6: North America UK B2B Fixed Connectivity Market Volume Share (%), by Type 2025 & 2033
- Figure 7: North America UK B2B Fixed Connectivity Market Revenue (Million), by Size of Enterprises 2025 & 2033
- Figure 8: North America UK B2B Fixed Connectivity Market Volume (Billion), by Size of Enterprises 2025 & 2033
- Figure 9: North America UK B2B Fixed Connectivity Market Revenue Share (%), by Size of Enterprises 2025 & 2033
- Figure 10: North America UK B2B Fixed Connectivity Market Volume Share (%), by Size of Enterprises 2025 & 2033
- Figure 11: North America UK B2B Fixed Connectivity Market Revenue (Million), by Country 2025 & 2033
- Figure 12: North America UK B2B Fixed Connectivity Market Volume (Billion), by Country 2025 & 2033
- Figure 13: North America UK B2B Fixed Connectivity Market Revenue Share (%), by Country 2025 & 2033
- Figure 14: North America UK B2B Fixed Connectivity Market Volume Share (%), by Country 2025 & 2033
- Figure 15: South America UK B2B Fixed Connectivity Market Revenue (Million), by Type 2025 & 2033
- Figure 16: South America UK B2B Fixed Connectivity Market Volume (Billion), by Type 2025 & 2033
- Figure 17: South America UK B2B Fixed Connectivity Market Revenue Share (%), by Type 2025 & 2033
- Figure 18: South America UK B2B Fixed Connectivity Market Volume Share (%), by Type 2025 & 2033
- Figure 19: South America UK B2B Fixed Connectivity Market Revenue (Million), by Size of Enterprises 2025 & 2033
- Figure 20: South America UK B2B Fixed Connectivity Market Volume (Billion), by Size of Enterprises 2025 & 2033
- Figure 21: South America UK B2B Fixed Connectivity Market Revenue Share (%), by Size of Enterprises 2025 & 2033
- Figure 22: South America UK B2B Fixed Connectivity Market Volume Share (%), by Size of Enterprises 2025 & 2033
- Figure 23: South America UK B2B Fixed Connectivity Market Revenue (Million), by Country 2025 & 2033
- Figure 24: South America UK B2B Fixed Connectivity Market Volume (Billion), by Country 2025 & 2033
- Figure 25: South America UK B2B Fixed Connectivity Market Revenue Share (%), by Country 2025 & 2033
- Figure 26: South America UK B2B Fixed Connectivity Market Volume Share (%), by Country 2025 & 2033
- Figure 27: Europe UK B2B Fixed Connectivity Market Revenue (Million), by Type 2025 & 2033
- Figure 28: Europe UK B2B Fixed Connectivity Market Volume (Billion), by Type 2025 & 2033
- Figure 29: Europe UK B2B Fixed Connectivity Market Revenue Share (%), by Type 2025 & 2033
- Figure 30: Europe UK B2B Fixed Connectivity Market Volume Share (%), by Type 2025 & 2033
- Figure 31: Europe UK B2B Fixed Connectivity Market Revenue (Million), by Size of Enterprises 2025 & 2033
- Figure 32: Europe UK B2B Fixed Connectivity Market Volume (Billion), by Size of Enterprises 2025 & 2033
- Figure 33: Europe UK B2B Fixed Connectivity Market Revenue Share (%), by Size of Enterprises 2025 & 2033
- Figure 34: Europe UK B2B Fixed Connectivity Market Volume Share (%), by Size of Enterprises 2025 & 2033
- Figure 35: Europe UK B2B Fixed Connectivity Market Revenue (Million), by Country 2025 & 2033
- Figure 36: Europe UK B2B Fixed Connectivity Market Volume (Billion), by Country 2025 & 2033
- Figure 37: Europe UK B2B Fixed Connectivity Market Revenue Share (%), by Country 2025 & 2033
- Figure 38: Europe UK B2B Fixed Connectivity Market Volume Share (%), by Country 2025 & 2033
- Figure 39: Middle East & Africa UK B2B Fixed Connectivity Market Revenue (Million), by Type 2025 & 2033
- Figure 40: Middle East & Africa UK B2B Fixed Connectivity Market Volume (Billion), by Type 2025 & 2033
- Figure 41: Middle East & Africa UK B2B Fixed Connectivity Market Revenue Share (%), by Type 2025 & 2033
- Figure 42: Middle East & Africa UK B2B Fixed Connectivity Market Volume Share (%), by Type 2025 & 2033
- Figure 43: Middle East & Africa UK B2B Fixed Connectivity Market Revenue (Million), by Size of Enterprises 2025 & 2033
- Figure 44: Middle East & Africa UK B2B Fixed Connectivity Market Volume (Billion), by Size of Enterprises 2025 & 2033
- Figure 45: Middle East & Africa UK B2B Fixed Connectivity Market Revenue Share (%), by Size of Enterprises 2025 & 2033
- Figure 46: Middle East & Africa UK B2B Fixed Connectivity Market Volume Share (%), by Size of Enterprises 2025 & 2033
- Figure 47: Middle East & Africa UK B2B Fixed Connectivity Market Revenue (Million), by Country 2025 & 2033
- Figure 48: Middle East & Africa UK B2B Fixed Connectivity Market Volume (Billion), by Country 2025 & 2033
- Figure 49: Middle East & Africa UK B2B Fixed Connectivity Market Revenue Share (%), by Country 2025 & 2033
- Figure 50: Middle East & Africa UK B2B Fixed Connectivity Market Volume Share (%), by Country 2025 & 2033
- Figure 51: Asia Pacific UK B2B Fixed Connectivity Market Revenue (Million), by Type 2025 & 2033
- Figure 52: Asia Pacific UK B2B Fixed Connectivity Market Volume (Billion), by Type 2025 & 2033
- Figure 53: Asia Pacific UK B2B Fixed Connectivity Market Revenue Share (%), by Type 2025 & 2033
- Figure 54: Asia Pacific UK B2B Fixed Connectivity Market Volume Share (%), by Type 2025 & 2033
- Figure 55: Asia Pacific UK B2B Fixed Connectivity Market Revenue (Million), by Size of Enterprises 2025 & 2033
- Figure 56: Asia Pacific UK B2B Fixed Connectivity Market Volume (Billion), by Size of Enterprises 2025 & 2033
- Figure 57: Asia Pacific UK B2B Fixed Connectivity Market Revenue Share (%), by Size of Enterprises 2025 & 2033
- Figure 58: Asia Pacific UK B2B Fixed Connectivity Market Volume Share (%), by Size of Enterprises 2025 & 2033
- Figure 59: Asia Pacific UK B2B Fixed Connectivity Market Revenue (Million), by Country 2025 & 2033
- Figure 60: Asia Pacific UK B2B Fixed Connectivity Market Volume (Billion), by Country 2025 & 2033
- Figure 61: Asia Pacific UK B2B Fixed Connectivity Market Revenue Share (%), by Country 2025 & 2033
- Figure 62: Asia Pacific UK B2B Fixed Connectivity Market Volume Share (%), by Country 2025 & 2033
List of Tables
- Table 1: Global UK B2B Fixed Connectivity Market Revenue Million Forecast, by Type 2020 & 2033
- Table 2: Global UK B2B Fixed Connectivity Market Volume Billion Forecast, by Type 2020 & 2033
- Table 3: Global UK B2B Fixed Connectivity Market Revenue Million Forecast, by Size of Enterprises 2020 & 2033
- Table 4: Global UK B2B Fixed Connectivity Market Volume Billion Forecast, by Size of Enterprises 2020 & 2033
- Table 5: Global UK B2B Fixed Connectivity Market Revenue Million Forecast, by Region 2020 & 2033
- Table 6: Global UK B2B Fixed Connectivity Market Volume Billion Forecast, by Region 2020 & 2033
- Table 7: Global UK B2B Fixed Connectivity Market Revenue Million Forecast, by Type 2020 & 2033
- Table 8: Global UK B2B Fixed Connectivity Market Volume Billion Forecast, by Type 2020 & 2033
- Table 9: Global UK B2B Fixed Connectivity Market Revenue Million Forecast, by Size of Enterprises 2020 & 2033
- Table 10: Global UK B2B Fixed Connectivity Market Volume Billion Forecast, by Size of Enterprises 2020 & 2033
- Table 11: Global UK B2B Fixed Connectivity Market Revenue Million Forecast, by Country 2020 & 2033
- Table 12: Global UK B2B Fixed Connectivity Market Volume Billion Forecast, by Country 2020 & 2033
- Table 13: United States UK B2B Fixed Connectivity Market Revenue (Million) Forecast, by Application 2020 & 2033
- Table 14: United States UK B2B Fixed Connectivity Market Volume (Billion) Forecast, by Application 2020 & 2033
- Table 15: Canada UK B2B Fixed Connectivity Market Revenue (Million) Forecast, by Application 2020 & 2033
- Table 16: Canada UK B2B Fixed Connectivity Market Volume (Billion) Forecast, by Application 2020 & 2033
- Table 17: Mexico UK B2B Fixed Connectivity Market Revenue (Million) Forecast, by Application 2020 & 2033
- Table 18: Mexico UK B2B Fixed Connectivity Market Volume (Billion) Forecast, by Application 2020 & 2033
- Table 19: Global UK B2B Fixed Connectivity Market Revenue Million Forecast, by Type 2020 & 2033
- Table 20: Global UK B2B Fixed Connectivity Market Volume Billion Forecast, by Type 2020 & 2033
- Table 21: Global UK B2B Fixed Connectivity Market Revenue Million Forecast, by Size of Enterprises 2020 & 2033
- Table 22: Global UK B2B Fixed Connectivity Market Volume Billion Forecast, by Size of Enterprises 2020 & 2033
- Table 23: Global UK B2B Fixed Connectivity Market Revenue Million Forecast, by Country 2020 & 2033
- Table 24: Global UK B2B Fixed Connectivity Market Volume Billion Forecast, by Country 2020 & 2033
- Table 25: Brazil UK B2B Fixed Connectivity Market Revenue (Million) Forecast, by Application 2020 & 2033
- Table 26: Brazil UK B2B Fixed Connectivity Market Volume (Billion) Forecast, by Application 2020 & 2033
- Table 27: Argentina UK B2B Fixed Connectivity Market Revenue (Million) Forecast, by Application 2020 & 2033
- Table 28: Argentina UK B2B Fixed Connectivity Market Volume (Billion) Forecast, by Application 2020 & 2033
- Table 29: Rest of South America UK B2B Fixed Connectivity Market Revenue (Million) Forecast, by Application 2020 & 2033
- Table 30: Rest of South America UK B2B Fixed Connectivity Market Volume (Billion) Forecast, by Application 2020 & 2033
- Table 31: Global UK B2B Fixed Connectivity Market Revenue Million Forecast, by Type 2020 & 2033
- Table 32: Global UK B2B Fixed Connectivity Market Volume Billion Forecast, by Type 2020 & 2033
- Table 33: Global UK B2B Fixed Connectivity Market Revenue Million Forecast, by Size of Enterprises 2020 & 2033
- Table 34: Global UK B2B Fixed Connectivity Market Volume Billion Forecast, by Size of Enterprises 2020 & 2033
- Table 35: Global UK B2B Fixed Connectivity Market Revenue Million Forecast, by Country 2020 & 2033
- Table 36: Global UK B2B Fixed Connectivity Market Volume Billion Forecast, by Country 2020 & 2033
- Table 37: United Kingdom UK B2B Fixed Connectivity Market Revenue (Million) Forecast, by Application 2020 & 2033
- Table 38: United Kingdom UK B2B Fixed Connectivity Market Volume (Billion) Forecast, by Application 2020 & 2033
- Table 39: Germany UK B2B Fixed Connectivity Market Revenue (Million) Forecast, by Application 2020 & 2033
- Table 40: Germany UK B2B Fixed Connectivity Market Volume (Billion) Forecast, by Application 2020 & 2033
- Table 41: France UK B2B Fixed Connectivity Market Revenue (Million) Forecast, by Application 2020 & 2033
- Table 42: France UK B2B Fixed Connectivity Market Volume (Billion) Forecast, by Application 2020 & 2033
- Table 43: Italy UK B2B Fixed Connectivity Market Revenue (Million) Forecast, by Application 2020 & 2033
- Table 44: Italy UK B2B Fixed Connectivity Market Volume (Billion) Forecast, by Application 2020 & 2033
- Table 45: Spain UK B2B Fixed Connectivity Market Revenue (Million) Forecast, by Application 2020 & 2033
- Table 46: Spain UK B2B Fixed Connectivity Market Volume (Billion) Forecast, by Application 2020 & 2033
- Table 47: Russia UK B2B Fixed Connectivity Market Revenue (Million) Forecast, by Application 2020 & 2033
- Table 48: Russia UK B2B Fixed Connectivity Market Volume (Billion) Forecast, by Application 2020 & 2033
- Table 49: Benelux UK B2B Fixed Connectivity Market Revenue (Million) Forecast, by Application 2020 & 2033
- Table 50: Benelux UK B2B Fixed Connectivity Market Volume (Billion) Forecast, by Application 2020 & 2033
- Table 51: Nordics UK B2B Fixed Connectivity Market Revenue (Million) Forecast, by Application 2020 & 2033
- Table 52: Nordics UK B2B Fixed Connectivity Market Volume (Billion) Forecast, by Application 2020 & 2033
- Table 53: Rest of Europe UK B2B Fixed Connectivity Market Revenue (Million) Forecast, by Application 2020 & 2033
- Table 54: Rest of Europe UK B2B Fixed Connectivity Market Volume (Billion) Forecast, by Application 2020 & 2033
- Table 55: Global UK B2B Fixed Connectivity Market Revenue Million Forecast, by Type 2020 & 2033
- Table 56: Global UK B2B Fixed Connectivity Market Volume Billion Forecast, by Type 2020 & 2033
- Table 57: Global UK B2B Fixed Connectivity Market Revenue Million Forecast, by Size of Enterprises 2020 & 2033
- Table 58: Global UK B2B Fixed Connectivity Market Volume Billion Forecast, by Size of Enterprises 2020 & 2033
- Table 59: Global UK B2B Fixed Connectivity Market Revenue Million Forecast, by Country 2020 & 2033
- Table 60: Global UK B2B Fixed Connectivity Market Volume Billion Forecast, by Country 2020 & 2033
- Table 61: Turkey UK B2B Fixed Connectivity Market Revenue (Million) Forecast, by Application 2020 & 2033
- Table 62: Turkey UK B2B Fixed Connectivity Market Volume (Billion) Forecast, by Application 2020 & 2033
- Table 63: Israel UK B2B Fixed Connectivity Market Revenue (Million) Forecast, by Application 2020 & 2033
- Table 64: Israel UK B2B Fixed Connectivity Market Volume (Billion) Forecast, by Application 2020 & 2033
- Table 65: GCC UK B2B Fixed Connectivity Market Revenue (Million) Forecast, by Application 2020 & 2033
- Table 66: GCC UK B2B Fixed Connectivity Market Volume (Billion) Forecast, by Application 2020 & 2033
- Table 67: North Africa UK B2B Fixed Connectivity Market Revenue (Million) Forecast, by Application 2020 & 2033
- Table 68: North Africa UK B2B Fixed Connectivity Market Volume (Billion) Forecast, by Application 2020 & 2033
- Table 69: South Africa UK B2B Fixed Connectivity Market Revenue (Million) Forecast, by Application 2020 & 2033
- Table 70: South Africa UK B2B Fixed Connectivity Market Volume (Billion) Forecast, by Application 2020 & 2033
- Table 71: Rest of Middle East & Africa UK B2B Fixed Connectivity Market Revenue (Million) Forecast, by Application 2020 & 2033
- Table 72: Rest of Middle East & Africa UK B2B Fixed Connectivity Market Volume (Billion) Forecast, by Application 2020 & 2033
- Table 73: Global UK B2B Fixed Connectivity Market Revenue Million Forecast, by Type 2020 & 2033
- Table 74: Global UK B2B Fixed Connectivity Market Volume Billion Forecast, by Type 2020 & 2033
- Table 75: Global UK B2B Fixed Connectivity Market Revenue Million Forecast, by Size of Enterprises 2020 & 2033
- Table 76: Global UK B2B Fixed Connectivity Market Volume Billion Forecast, by Size of Enterprises 2020 & 2033
- Table 77: Global UK B2B Fixed Connectivity Market Revenue Million Forecast, by Country 2020 & 2033
- Table 78: Global UK B2B Fixed Connectivity Market Volume Billion Forecast, by Country 2020 & 2033
- Table 79: China UK B2B Fixed Connectivity Market Revenue (Million) Forecast, by Application 2020 & 2033
- Table 80: China UK B2B Fixed Connectivity Market Volume (Billion) Forecast, by Application 2020 & 2033
- Table 81: India UK B2B Fixed Connectivity Market Revenue (Million) Forecast, by Application 2020 & 2033
- Table 82: India UK B2B Fixed Connectivity Market Volume (Billion) Forecast, by Application 2020 & 2033
- Table 83: Japan UK B2B Fixed Connectivity Market Revenue (Million) Forecast, by Application 2020 & 2033
- Table 84: Japan UK B2B Fixed Connectivity Market Volume (Billion) Forecast, by Application 2020 & 2033
- Table 85: South Korea UK B2B Fixed Connectivity Market Revenue (Million) Forecast, by Application 2020 & 2033
- Table 86: South Korea UK B2B Fixed Connectivity Market Volume (Billion) Forecast, by Application 2020 & 2033
- Table 87: ASEAN UK B2B Fixed Connectivity Market Revenue (Million) Forecast, by Application 2020 & 2033
- Table 88: ASEAN UK B2B Fixed Connectivity Market Volume (Billion) Forecast, by Application 2020 & 2033
- Table 89: Oceania UK B2B Fixed Connectivity Market Revenue (Million) Forecast, by Application 2020 & 2033
- Table 90: Oceania UK B2B Fixed Connectivity Market Volume (Billion) Forecast, by Application 2020 & 2033
- Table 91: Rest of Asia Pacific UK B2B Fixed Connectivity Market Revenue (Million) Forecast, by Application 2020 & 2033
- Table 92: Rest of Asia Pacific UK B2B Fixed Connectivity Market Volume (Billion) Forecast, by Application 2020 & 2033
Frequently Asked Questions
1. What is the projected Compound Annual Growth Rate (CAGR) of the UK B2B Fixed Connectivity Market?
The projected CAGR is approximately 5.25%.
2. Which companies are prominent players in the UK B2B Fixed Connectivity Market?
Key companies in the market include TalkTalk Business Direct Limited, Sky UK, Vodafone Limited, BT Group, Virgin Media Business Ltd, bOnline Limited, KCOM Group Limited, Hyperoptic Ltd, Gigaclear Ltd, XLN Telecom Ltd, Chess Lt.
3. What are the main segments of the UK B2B Fixed Connectivity Market?
The market segments include Type, Size of Enterprises .
4. Can you provide details about the market size?
The market size is estimated to be USD 2.74 Million as of 2022.
5. What are some drivers contributing to market growth?
Huge Demand for High-speed Connectivity; Rising Digital Transformation in the Industries.
6. What are the notable trends driving market growth?
Fixed Data is Expected to Grow at a Rapid Pace.
7. Are there any restraints impacting market growth?
Huge Demand for High-speed Connectivity; Rising Digital Transformation in the Industries.
8. Can you provide examples of recent developments in the market?
May 2024: Openreach, a leading broadband infrastructure provider, announced its ambitious strategy. The plan entails extending full-fiber broadband services to 517 new locations across the United Kingdom, thereby introducing fiber-to-the-premise (FTTP) connections to an additional 2.7 million homes and businesses. Openreach's overarching goal is to ensure that 25 million properties in the country have access to gigabit-capable broadband by the close of 2026. This initiative, which includes reaching 6.2 million homes and businesses in rural and remote areas, comes with a hefty price tag of GBP 15 billion (~USD 18.65 billion).
9. What pricing options are available for accessing the report?
Pricing options include single-user, multi-user, and enterprise licenses priced at USD 3800, USD 4500, and USD 5800 respectively.
10. Is the market size provided in terms of value or volume?
The market size is provided in terms of value, measured in Million and volume, measured in Billion.
11. Are there any specific market keywords associated with the report?
Yes, the market keyword associated with the report is "UK B2B Fixed Connectivity Market," which aids in identifying and referencing the specific market segment covered.
12. How do I determine which pricing option suits my needs best?
The pricing options vary based on user requirements and access needs. Individual users may opt for single-user licenses, while businesses requiring broader access may choose multi-user or enterprise licenses for cost-effective access to the report.
13. Are there any additional resources or data provided in the UK B2B Fixed Connectivity Market report?
While the report offers comprehensive insights, it's advisable to review the specific contents or supplementary materials provided to ascertain if additional resources or data are available.
14. How can I stay updated on further developments or reports in the UK B2B Fixed Connectivity Market?
To stay informed about further developments, trends, and reports in the UK B2B Fixed Connectivity Market, consider subscribing to industry newsletters, following relevant companies and organizations, or regularly checking reputable industry news sources and publications.
Methodology
Step 1 - Identification of Relevant Samples Size from Population Database


Step 2 - Approaches for Defining Global Market Size (Value, Volume* & Price*)

Note*: In applicable scenarios
Step 3 - Data Sources
Primary Research
- Web Analytics
- Survey Reports
- Research Institute
- Latest Research Reports
- Opinion Leaders
Secondary Research
- Annual Reports
- White Paper
- Latest Press Release
- Industry Association
- Paid Database
- Investor Presentations

Step 4 - Data Triangulation
Involves using different sources of information in order to increase the validity of a study
These sources are likely to be stakeholders in a program - participants, other researchers, program staff, other community members, and so on.
Then we put all data in single framework & apply various statistical tools to find out the dynamic on the market.
During the analysis stage, feedback from the stakeholder groups would be compared to determine areas of agreement as well as areas of divergence