

Key Insights
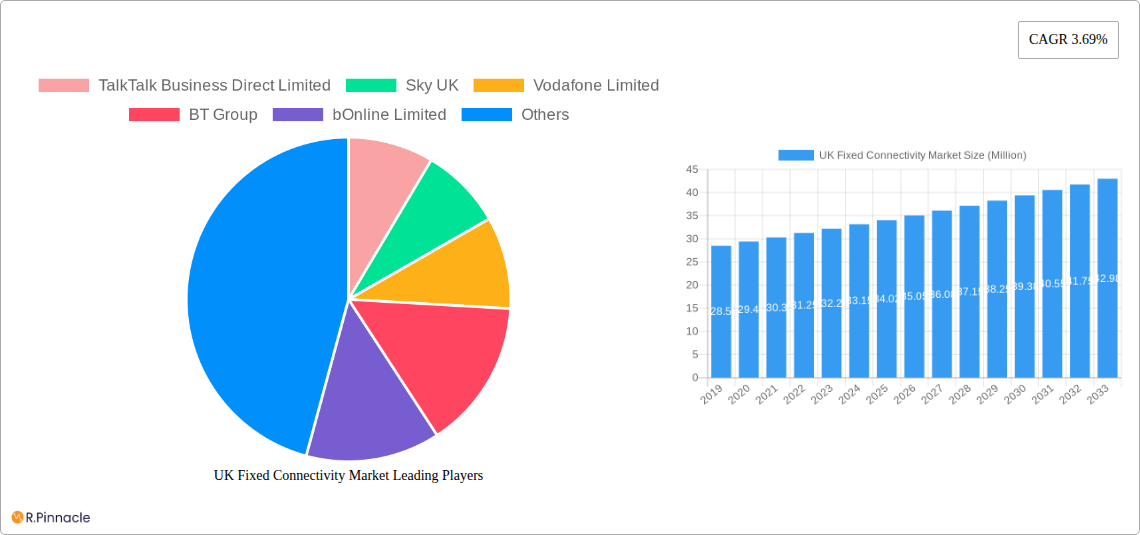
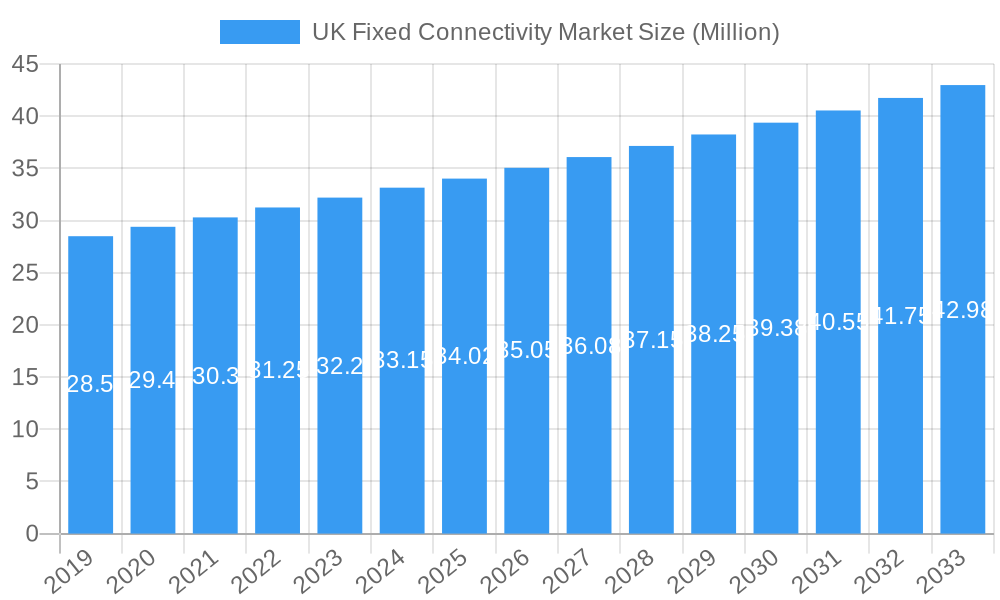
The UK Fixed Connectivity Market is poised for robust growth, projected to reach £34.02 billion by 2025, with a Compound Annual Growth Rate (CAGR) of 3.69% extending through to 2033. This expansion is fueled by an increasing demand for reliable and high-speed internet services across both consumer and enterprise segments. Key drivers include the ongoing digital transformation initiatives by businesses, necessitating enhanced network infrastructure for cloud computing, data analytics, and remote work capabilities. Furthermore, the growing adoption of smart home devices and the increasing reliance on streaming services and online entertainment by consumers are creating a perpetual need for greater bandwidth and stable connections. The market's segmentation into Fixed Data and Fixed Voice services highlights a clear shift towards data-centric connectivity, with Fixed Data solutions becoming increasingly dominant due to the proliferation of data-intensive applications.
UK Fixed Connectivity Market Market Size (In Million)
This dynamic market landscape is characterized by several significant trends. The accelerated deployment of fiber-to-the-home (FTTH) and fiber-to-the-premises (FTTP) networks is a pivotal trend, promising significantly higher speeds and lower latency, thereby enhancing user experience. Simultaneously, the ongoing transition from traditional copper-based infrastructure to these advanced fiber optics is a major undertaking supported by both government initiatives and private investment. Emerging technologies like 5G Fixed Wireless Access (FWA) are also beginning to complement fixed lines, offering flexible connectivity solutions in areas where fiber deployment might be challenging. However, the market also faces certain restraints. The substantial capital investment required for widespread fiber network rollout, coupled with regulatory hurdles and the complexities of site acquisition, can impede rapid expansion. Additionally, the increasing competition among service providers, while beneficial for consumers, can lead to price pressures and impact profit margins for some players. The significant presence of established telecommunications giants like BT Group and Vodafone, alongside agile challenger brands such as TalkTalk Business Direct and Virgin Media Business, signifies a competitive yet opportunity-rich environment.
UK Fixed Connectivity Market Company Market Share
UK Fixed Connectivity Market: Comprehensive Analysis and Future Outlook
This in-depth report provides a detailed analysis of the UK Fixed Connectivity Market, offering actionable insights for industry professionals, investors, and policymakers. Leveraging extensive data and a robust forecast period (2025-2033), this study delves into market structure, dynamics, regional dominance, product innovations, and key growth drivers. We examine the competitive landscape, regulatory environment, and emerging opportunities, providing a clear roadmap for navigating the evolving UK fixed broadband and voice services sector.
UK Fixed Connectivity Market Market Structure & Innovation Trends
The UK Fixed Connectivity Market exhibits a dynamic structure characterized by both established giants and agile new entrants. Market concentration is influenced by significant infrastructure investments and regulatory policies. Innovation is primarily driven by the relentless pursuit of higher speeds, lower latency, and enhanced reliability, fueled by advancements in fibre-to-the-home (FTTH) and 5G convergence. Regulatory frameworks, such as Ofcom's initiatives to promote competition and infrastructure deployment, play a pivotal role in shaping market dynamics. Product substitutes, though evolving, primarily involve mobile broadband and satellite services, but the dedicated nature and superior performance of fixed connectivity continue to solidify its market position. End-user demographics demonstrate a growing demand for high-capacity, dependable connections across both consumer and enterprise segments. Mergers and acquisitions (M&A) activity remains a key strategy for consolidating market share and expanding service offerings, with recent M&A deal values reaching hundreds of millions of pounds. Key players are investing heavily in network upgrades and the expansion of their fibre footprint.
- Market Concentration: Dominated by a few major players with extensive infrastructure, alongside a growing number of challenger ISPs focusing on specific niches or regions.
- Innovation Drivers: Fibre deployment (FTTH/FTTP), network virtualization, increased bandwidth demand, and the integration of fixed and mobile services.
- Regulatory Frameworks: Ofcom's role in promoting competition, overseeing pricing, and facilitating infrastructure access is critical.
- Product Substitutes: Mobile broadband (4G/5G), satellite internet.
- End-User Demographics: A growing demand for high-speed internet for streaming, gaming, remote work, and business operations.
- M&A Activities: Ongoing consolidation to achieve economies of scale and expand service portfolios.
UK Fixed Connectivity Market Market Dynamics & Trends
The UK Fixed Connectivity Market is experiencing robust growth, propelled by a confluence of technological advancements, shifting consumer preferences, and a burgeoning digital economy. The estimated market size is projected to reach tens of billions of pounds by 2025, with a projected Compound Annual Growth Rate (CAGR) of approximately 6-8% over the forecast period. This upward trajectory is underpinned by the increasing demand for high-speed, reliable internet services for a wide array of applications, including entertainment, remote work, cloud computing, and the Internet of Things (IoT). Technological disruptions, such as the ongoing rollout of fibre-to-the-home (FTTH) networks and the increasing sophistication of Wi-Fi technologies, are fundamentally reshaping the connectivity landscape, enabling significantly higher speeds and lower latency. Consumer preferences are demonstrably shifting towards superior bandwidth and service quality, with bundled offerings encompassing broadband, TV, and mobile services gaining traction. Competitive dynamics are intense, with established telecommunications giants vying for market share against a growing wave of agile, fibre-focused providers and mobile network operators expanding their fixed offerings. Market penetration for high-speed broadband continues to rise, particularly in urban and suburban areas, driven by government initiatives and private sector investment in infrastructure upgrades. The transition from legacy copper networks to full-fibre infrastructure is a significant ongoing trend, creating both opportunities and challenges for network operators. The development of new services, such as ultra-low latency connections for gaming and virtual reality, is also a key trend shaping future market demand.
Dominant Regions & Segments in UK Fixed Connectivity Market
The UK Fixed Connectivity Market demonstrates significant dominance within specific regions and segments, driven by varying economic, demographic, and infrastructural factors. The Fixed Data segment, encompassing broadband internet services, is the most dominant. This is primarily attributed to the pervasive integration of digital technologies into daily life and business operations.
Leading Segment: Fixed Data commands the largest market share due to the insatiable demand for high-speed internet.
- Drivers: Proliferation of streaming services, cloud adoption by enterprises, remote working trends, and the increasing use of bandwidth-intensive applications.
- Infrastructure Investment: Continuous investment in fibre-optic networks directly fuels the growth of this segment.
- Market Penetration: High and continually increasing market penetration, especially in urban and suburban areas.
Leading End User: Consumers represent a substantial portion of the market, driven by the ubiquitous need for internet access for entertainment, communication, and education.
- Drivers: Growing adoption of smart home devices, online gaming, and a shift towards digital consumption of media.
- Disposable Income: Higher disposable incomes in certain regions correlate with greater adoption of premium fixed connectivity packages.
- Bundling Strategies: Service providers effectively leverage bundling of services to attract and retain consumer subscriptions.
Dominant Regions: Major metropolitan areas and economically developed regions within the United Kingdom tend to exhibit higher market penetration and average revenue per user.
- Economic Policies: Government initiatives promoting digital infrastructure and competition in these regions have spurred growth.
- Infrastructure Development: Concentrated investment in fibre rollouts in densely populated areas.
- Consumer Affluence: Regions with higher average incomes often see increased uptake of premium broadband services.
While Fixed Voice services are gradually being superseded by Voice over IP (VoIP) and mobile communication, they still maintain a significant presence, particularly within enterprise segments and for specific demographic groups requiring traditional landline services. However, the long-term trend indicates a decline in standalone fixed voice as the market transitions towards integrated digital communication solutions. The Enterprises segment, while smaller in number of connections compared to consumers, contributes significantly to revenue through demand for high-bandwidth, secure, and reliable business-grade connectivity solutions.
UK Fixed Connectivity Market Product Innovations
Product innovation in the UK Fixed Connectivity Market is centered on enhancing speed, reliability, and user experience. The primary focus is on the deployment and optimization of Fibre-to-the-X (FTTx) technologies, including Fibre-to-the-Home (FTTH) and Fibre-to-the-Premises (FTTP), offering symmetrical download and upload speeds far exceeding traditional copper-based infrastructure. Advancements in Wi-Fi standards, such as Wi-Fi 6 and Wi-Fi 6E, are enabling seamless and robust wireless connectivity within homes and businesses, complementing the high-speed fixed backhaul. Furthermore, innovations in network management software and intelligent routing are improving service quality and reducing latency. The competitive advantage lies in offering a superior, future-proof connectivity solution that supports an ever-increasing array of digital services, from high-definition streaming and immersive gaming to critical business applications and the burgeoning Internet of Things (IoT) ecosystem.
Report Scope & Segmentation Analysis
This report meticulously segments the UK Fixed Connectivity Market based on key parameters to provide a granular understanding of its various facets. The primary segmentation includes Type: Fixed Data and Fixed Voice, and End Users: Consumers and Enterprises.
- Fixed Data: This segment encompasses all broadband internet services delivered via fixed infrastructure. It is projected to experience the highest growth due to increasing data consumption. Market sizes are estimated in the billions of pounds with strong growth prospects.
- Fixed Voice: This segment covers traditional landline telephone services. While experiencing a gradual decline, it remains significant for certain user groups and as part of bundled offerings. Growth projections are modest to negative.
- Consumers: This end-user segment represents individual households and personal use. It is characterized by high volume and increasing demand for speed and entertainment. Market sizes are in the billions of pounds with sustained growth.
- Enterprises: This segment includes businesses of all sizes, requiring robust, secure, and high-capacity connectivity for operations. This segment contributes significantly to revenue through higher average revenue per user and demand for specialized services. Market sizes are in the billions of pounds with steady growth.
Key Drivers of UK Fixed Connectivity Market Growth
The UK Fixed Connectivity Market's growth is propelled by several interconnected factors. The relentless demand for faster and more reliable internet speeds, fueled by the proliferation of streaming services, online gaming, and remote work, is a primary driver. Significant government initiatives and private sector investments in expanding fibre optic infrastructure across the nation are crucial for upgrading network capabilities and increasing market penetration. The increasing adoption of digital technologies by enterprises for cloud computing, IoT, and digital transformation strategies necessitates higher bandwidth and lower latency connectivity solutions. Furthermore, the growing number of connected devices within households and businesses, collectively known as the Internet of Things (IoT), creates a sustained demand for robust fixed connectivity to support these devices.
Challenges in the UK Fixed Connectivity Market Sector
Despite its robust growth, the UK Fixed Connectivity Market faces several challenges. The high cost of deploying fibre optic infrastructure, particularly in rural and hard-to-reach areas, presents a significant barrier to universal coverage. Regulatory complexities and the need for multiple permits for infrastructure deployment can lead to delays and increased project costs. Intense competition among service providers, while beneficial for consumers, can put pressure on profit margins and necessitate aggressive pricing strategies. Supply chain disruptions for essential network components can also impact deployment timelines and operational efficiency. Furthermore, the ongoing transition from legacy copper networks to fibre requires substantial investment and careful management to avoid service interruptions for existing customers.
Emerging Opportunities in UK Fixed Connectivity Market
Emerging opportunities in the UK Fixed Connectivity Market are abundant, driven by technological advancements and evolving consumer needs. The continued rollout of full-fibre networks presents a significant opportunity for service providers to capture market share and offer premium, high-speed services. The growing demand for ultra-low latency connectivity for applications like virtual reality (VR), augmented reality (AR), and real-time gaming creates a niche for specialized, high-performance networks. The expansion of the Internet of Things (IoT) ecosystem offers new avenues for providing connectivity solutions for smart cities, smart homes, and industrial applications. Furthermore, the increasing focus on cybersecurity and network resilience opens doors for providers offering secure and reliable connectivity services with enhanced protection against cyber threats. The convergence of fixed and mobile technologies also presents opportunities for integrated service offerings.
Leading Players in the UK Fixed Connectivity Market Market
- TalkTalk Business Direct Limited
- Sky UK
- Vodafone Limited
- BT Group
- bOnline Limited
- Virgin Media Business Ltd
- TVNET Limited
- Eurocoms
- Full Fibre Limited
- ITS Technology Group Ltd
- RUCKUS (CommScope)
- Openreach Limited
Key Developments in UK Fixed Connectivity Market Industry
- May 2024: BT Group announced an updated timeline for transitioning all customers from the traditional Public Switched Telephone Network (PSTN) to digital landlines. This move, aimed at enhancing customer protection, particularly for vulnerable individuals, signifies a major shift towards digital-first communication infrastructure.
- February 2024: BT Group unveiled its advanced NB-IoT network, a multi-million-pound investment designed to accelerate smart city and industrial development across the UK. With 97% population coverage, this low-power network, powered by the EE mobile network, has the potential to revolutionize sectors like utilities, construction, and public services by enabling efficient data collection and communication for connected devices.
Future Outlook for UK Fixed Connectivity Market Market
The future outlook for the UK Fixed Connectivity Market is exceptionally bright, characterized by sustained growth and transformative innovation. The ongoing transition to full-fibre infrastructure will continue to be a primary growth accelerator, enabling significantly higher speeds and improved reliability, thereby supporting a burgeoning digital economy. The increasing adoption of cloud-based services, the expansion of the Internet of Things (IoT), and the demand for immersive digital experiences will further drive the need for robust and high-capacity fixed connectivity. Strategic opportunities lie in the development of niche markets such as ultra-low latency networks for gaming and industrial applications, as well as in providing secure and resilient connectivity solutions for enterprises. The convergence of fixed and mobile networks will also lead to integrated service offerings that cater to a wider range of consumer and business needs, solidifying the market's position as a critical enabler of digital progress.
UK Fixed Connectivity Market Segmentation
-
1. Type
- 1.1. Fixed Data
- 1.2. Fixed Voice
-
2. End Users
- 2.1. Consumers
- 2.2. Enterprises
UK Fixed Connectivity Market Segmentation By Geography
-
1. North America
- 1.1. United States
- 1.2. Canada
- 1.3. Mexico
-
2. South America
- 2.1. Brazil
- 2.2. Argentina
- 2.3. Rest of South America
-
3. Europe
- 3.1. United Kingdom
- 3.2. Germany
- 3.3. France
- 3.4. Italy
- 3.5. Spain
- 3.6. Russia
- 3.7. Benelux
- 3.8. Nordics
- 3.9. Rest of Europe
-
4. Middle East & Africa
- 4.1. Turkey
- 4.2. Israel
- 4.3. GCC
- 4.4. North Africa
- 4.5. South Africa
- 4.6. Rest of Middle East & Africa
-
5. Asia Pacific
- 5.1. China
- 5.2. India
- 5.3. Japan
- 5.4. South Korea
- 5.5. ASEAN
- 5.6. Oceania
- 5.7. Rest of Asia Pacific
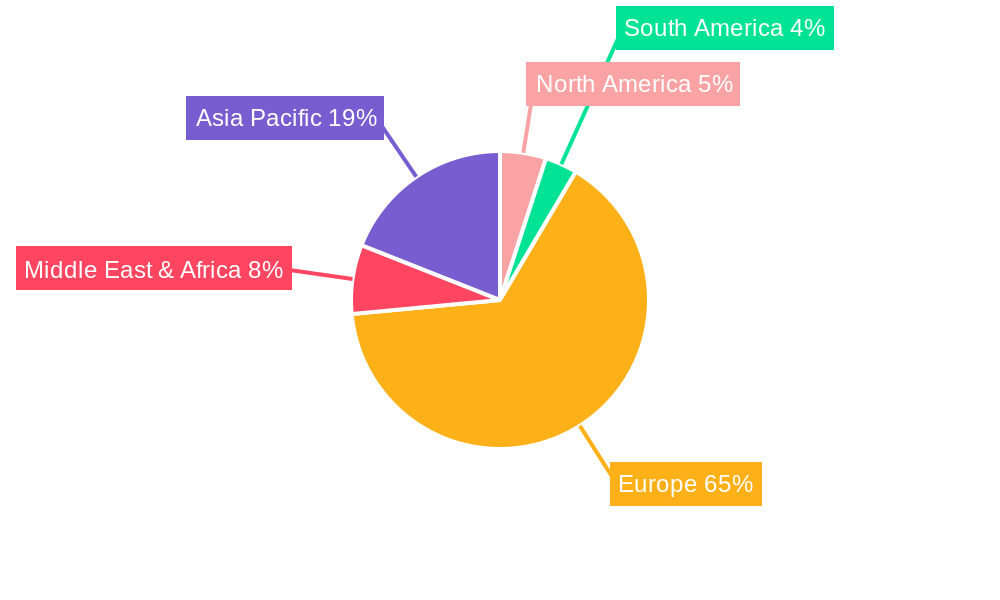
UK Fixed Connectivity Market Regional Market Share
Geographic Coverage of UK Fixed Connectivity Market
UK Fixed Connectivity Market REPORT HIGHLIGHTS
| Aspects | Details |
|---|---|
| Study Period | 2020-2034 |
| Base Year | 2025 |
| Estimated Year | 2026 |
| Forecast Period | 2026-2034 |
| Historical Period | 2020-2025 |
| Growth Rate | CAGR of 3.69% from 2020-2034 |
| Segmentation |
|
Table of Contents
- 1. Introduction
- 1.1. Research Scope
- 1.2. Market Segmentation
- 1.3. Research Objective
- 1.4. Definitions and Assumptions
- 2. Executive Summary
- 2.1. Market Snapshot
- 3. Market Dynamics
- 3.1. Market Drivers
- 3.2. Market Restrains
- 3.3. Market Trends
- 3.4. Market Opportunities
- 4. Market Factor Analysis
- 4.1. Porters Five Forces
- 4.1.1. Bargaining Power of Suppliers
- 4.1.2. Bargaining Power of Buyers
- 4.1.3. Threat of New Entrants
- 4.1.4. Threat of Substitutes
- 4.1.5. Competitive Rivalry
- 4.2. PESTEL analysis
- 4.3. BCG Analysis
- 4.3.1. Stars (High Growth, High Market Share)
- 4.3.2. Cash Cows (Low Growth, High Market Share)
- 4.3.3. Question Mark (High Growth, Low Market Share)
- 4.3.4. Dogs (Low Growth, Low Market Share)
- 4.4. Ansoff Matrix Analysis
- 4.5. Supply Chain Analysis
- 4.6. Regulatory Landscape
- 4.7. Current Market Potential and Opportunity Assessment (TAM–SAM–SOM Framework)
- 4.8. PRI Analyst Note
- 4.1. Porters Five Forces
- 5. Market Analysis, Insights and Forecast 2021-2033
- 5.1. Market Analysis, Insights and Forecast - by Type
- 5.1.1. Fixed Data
- 5.1.2. Fixed Voice
- 5.2. Market Analysis, Insights and Forecast - by End Users
- 5.2.1. Consumers
- 5.2.2. Enterprises
- 5.3. Market Analysis, Insights and Forecast - by Region
- 5.3.1. North America
- 5.3.2. South America
- 5.3.3. Europe
- 5.3.4. Middle East & Africa
- 5.3.5. Asia Pacific
- 5.1. Market Analysis, Insights and Forecast - by Type
- 6. Global UK Fixed Connectivity Market Analysis, Insights and Forecast, 2021-2033
- 6.1. Market Analysis, Insights and Forecast - by Type
- 6.1.1. Fixed Data
- 6.1.2. Fixed Voice
- 6.2. Market Analysis, Insights and Forecast - by End Users
- 6.2.1. Consumers
- 6.2.2. Enterprises
- 6.1. Market Analysis, Insights and Forecast - by Type
- 7. North America UK Fixed Connectivity Market Analysis, Insights and Forecast, 2020-2032
- 7.1. Market Analysis, Insights and Forecast - by Type
- 7.1.1. Fixed Data
- 7.1.2. Fixed Voice
- 7.2. Market Analysis, Insights and Forecast - by End Users
- 7.2.1. Consumers
- 7.2.2. Enterprises
- 7.1. Market Analysis, Insights and Forecast - by Type
- 8. South America UK Fixed Connectivity Market Analysis, Insights and Forecast, 2020-2032
- 8.1. Market Analysis, Insights and Forecast - by Type
- 8.1.1. Fixed Data
- 8.1.2. Fixed Voice
- 8.2. Market Analysis, Insights and Forecast - by End Users
- 8.2.1. Consumers
- 8.2.2. Enterprises
- 8.1. Market Analysis, Insights and Forecast - by Type
- 9. Europe UK Fixed Connectivity Market Analysis, Insights and Forecast, 2020-2032
- 9.1. Market Analysis, Insights and Forecast - by Type
- 9.1.1. Fixed Data
- 9.1.2. Fixed Voice
- 9.2. Market Analysis, Insights and Forecast - by End Users
- 9.2.1. Consumers
- 9.2.2. Enterprises
- 9.1. Market Analysis, Insights and Forecast - by Type
- 10. Middle East & Africa UK Fixed Connectivity Market Analysis, Insights and Forecast, 2020-2032
- 10.1. Market Analysis, Insights and Forecast - by Type
- 10.1.1. Fixed Data
- 10.1.2. Fixed Voice
- 10.2. Market Analysis, Insights and Forecast - by End Users
- 10.2.1. Consumers
- 10.2.2. Enterprises
- 10.1. Market Analysis, Insights and Forecast - by Type
- 11. Asia Pacific UK Fixed Connectivity Market Analysis, Insights and Forecast, 2020-2032
- 11.1. Market Analysis, Insights and Forecast - by Type
- 11.1.1. Fixed Data
- 11.1.2. Fixed Voice
- 11.2. Market Analysis, Insights and Forecast - by End Users
- 11.2.1. Consumers
- 11.2.2. Enterprises
- 11.1. Market Analysis, Insights and Forecast - by Type
- 12. Competitive Analysis
- 12.1. Company Profiles
- 12.1.1 TalkTalk Business Direct Limited
- 12.1.1.1. Company Overview
- 12.1.1.2. Products
- 12.1.1.3. Company Financials
- 12.1.1.4. SWOT Analysis
- 12.1.2 Sky UK
- 12.1.2.1. Company Overview
- 12.1.2.2. Products
- 12.1.2.3. Company Financials
- 12.1.2.4. SWOT Analysis
- 12.1.3 Vodafone Limited
- 12.1.3.1. Company Overview
- 12.1.3.2. Products
- 12.1.3.3. Company Financials
- 12.1.3.4. SWOT Analysis
- 12.1.4 BT Group
- 12.1.4.1. Company Overview
- 12.1.4.2. Products
- 12.1.4.3. Company Financials
- 12.1.4.4. SWOT Analysis
- 12.1.5 bOnline Limited
- 12.1.5.1. Company Overview
- 12.1.5.2. Products
- 12.1.5.3. Company Financials
- 12.1.5.4. SWOT Analysis
- 12.1.6 Virgin Media Business Ltd
- 12.1.6.1. Company Overview
- 12.1.6.2. Products
- 12.1.6.3. Company Financials
- 12.1.6.4. SWOT Analysis
- 12.1.7 TVNET Limited
- 12.1.7.1. Company Overview
- 12.1.7.2. Products
- 12.1.7.3. Company Financials
- 12.1.7.4. SWOT Analysis
- 12.1.8 Eurocoms
- 12.1.8.1. Company Overview
- 12.1.8.2. Products
- 12.1.8.3. Company Financials
- 12.1.8.4. SWOT Analysis
- 12.1.9 Full Fibre Limited
- 12.1.9.1. Company Overview
- 12.1.9.2. Products
- 12.1.9.3. Company Financials
- 12.1.9.4. SWOT Analysis
- 12.1.10 ITS Technology Group Ltd
- 12.1.10.1. Company Overview
- 12.1.10.2. Products
- 12.1.10.3. Company Financials
- 12.1.10.4. SWOT Analysis
- 12.1.11 RUCKUS (CommScope)
- 12.1.11.1. Company Overview
- 12.1.11.2. Products
- 12.1.11.3. Company Financials
- 12.1.11.4. SWOT Analysis
- 12.1.12 Openreach Limited*List Not Exhaustive
- 12.1.12.1. Company Overview
- 12.1.12.2. Products
- 12.1.12.3. Company Financials
- 12.1.12.4. SWOT Analysis
- 12.1.1 TalkTalk Business Direct Limited
- 12.2. Market Entropy
- 12.2.1 Company's Key Areas Served
- 12.2.2 Recent Developments
- 12.3. Company Market Share Analysis 2025
- 12.3.1 Top 5 Companies Market Share Analysis
- 12.3.2 Top 3 Companies Market Share Analysis
- 12.4. List of Potential Customers
- 13. Research Methodology
List of Figures
- Figure 1: Global UK Fixed Connectivity Market Revenue Breakdown (Million, %) by Region 2025 & 2033
- Figure 2: Global UK Fixed Connectivity Market Volume Breakdown (Billion, %) by Region 2025 & 2033
- Figure 3: North America UK Fixed Connectivity Market Revenue (Million), by Type 2025 & 2033
- Figure 4: North America UK Fixed Connectivity Market Volume (Billion), by Type 2025 & 2033
- Figure 5: North America UK Fixed Connectivity Market Revenue Share (%), by Type 2025 & 2033
- Figure 6: North America UK Fixed Connectivity Market Volume Share (%), by Type 2025 & 2033
- Figure 7: North America UK Fixed Connectivity Market Revenue (Million), by End Users 2025 & 2033
- Figure 8: North America UK Fixed Connectivity Market Volume (Billion), by End Users 2025 & 2033
- Figure 9: North America UK Fixed Connectivity Market Revenue Share (%), by End Users 2025 & 2033
- Figure 10: North America UK Fixed Connectivity Market Volume Share (%), by End Users 2025 & 2033
- Figure 11: North America UK Fixed Connectivity Market Revenue (Million), by Country 2025 & 2033
- Figure 12: North America UK Fixed Connectivity Market Volume (Billion), by Country 2025 & 2033
- Figure 13: North America UK Fixed Connectivity Market Revenue Share (%), by Country 2025 & 2033
- Figure 14: North America UK Fixed Connectivity Market Volume Share (%), by Country 2025 & 2033
- Figure 15: South America UK Fixed Connectivity Market Revenue (Million), by Type 2025 & 2033
- Figure 16: South America UK Fixed Connectivity Market Volume (Billion), by Type 2025 & 2033
- Figure 17: South America UK Fixed Connectivity Market Revenue Share (%), by Type 2025 & 2033
- Figure 18: South America UK Fixed Connectivity Market Volume Share (%), by Type 2025 & 2033
- Figure 19: South America UK Fixed Connectivity Market Revenue (Million), by End Users 2025 & 2033
- Figure 20: South America UK Fixed Connectivity Market Volume (Billion), by End Users 2025 & 2033
- Figure 21: South America UK Fixed Connectivity Market Revenue Share (%), by End Users 2025 & 2033
- Figure 22: South America UK Fixed Connectivity Market Volume Share (%), by End Users 2025 & 2033
- Figure 23: South America UK Fixed Connectivity Market Revenue (Million), by Country 2025 & 2033
- Figure 24: South America UK Fixed Connectivity Market Volume (Billion), by Country 2025 & 2033
- Figure 25: South America UK Fixed Connectivity Market Revenue Share (%), by Country 2025 & 2033
- Figure 26: South America UK Fixed Connectivity Market Volume Share (%), by Country 2025 & 2033
- Figure 27: Europe UK Fixed Connectivity Market Revenue (Million), by Type 2025 & 2033
- Figure 28: Europe UK Fixed Connectivity Market Volume (Billion), by Type 2025 & 2033
- Figure 29: Europe UK Fixed Connectivity Market Revenue Share (%), by Type 2025 & 2033
- Figure 30: Europe UK Fixed Connectivity Market Volume Share (%), by Type 2025 & 2033
- Figure 31: Europe UK Fixed Connectivity Market Revenue (Million), by End Users 2025 & 2033
- Figure 32: Europe UK Fixed Connectivity Market Volume (Billion), by End Users 2025 & 2033
- Figure 33: Europe UK Fixed Connectivity Market Revenue Share (%), by End Users 2025 & 2033
- Figure 34: Europe UK Fixed Connectivity Market Volume Share (%), by End Users 2025 & 2033
- Figure 35: Europe UK Fixed Connectivity Market Revenue (Million), by Country 2025 & 2033
- Figure 36: Europe UK Fixed Connectivity Market Volume (Billion), by Country 2025 & 2033
- Figure 37: Europe UK Fixed Connectivity Market Revenue Share (%), by Country 2025 & 2033
- Figure 38: Europe UK Fixed Connectivity Market Volume Share (%), by Country 2025 & 2033
- Figure 39: Middle East & Africa UK Fixed Connectivity Market Revenue (Million), by Type 2025 & 2033
- Figure 40: Middle East & Africa UK Fixed Connectivity Market Volume (Billion), by Type 2025 & 2033
- Figure 41: Middle East & Africa UK Fixed Connectivity Market Revenue Share (%), by Type 2025 & 2033
- Figure 42: Middle East & Africa UK Fixed Connectivity Market Volume Share (%), by Type 2025 & 2033
- Figure 43: Middle East & Africa UK Fixed Connectivity Market Revenue (Million), by End Users 2025 & 2033
- Figure 44: Middle East & Africa UK Fixed Connectivity Market Volume (Billion), by End Users 2025 & 2033
- Figure 45: Middle East & Africa UK Fixed Connectivity Market Revenue Share (%), by End Users 2025 & 2033
- Figure 46: Middle East & Africa UK Fixed Connectivity Market Volume Share (%), by End Users 2025 & 2033
- Figure 47: Middle East & Africa UK Fixed Connectivity Market Revenue (Million), by Country 2025 & 2033
- Figure 48: Middle East & Africa UK Fixed Connectivity Market Volume (Billion), by Country 2025 & 2033
- Figure 49: Middle East & Africa UK Fixed Connectivity Market Revenue Share (%), by Country 2025 & 2033
- Figure 50: Middle East & Africa UK Fixed Connectivity Market Volume Share (%), by Country 2025 & 2033
- Figure 51: Asia Pacific UK Fixed Connectivity Market Revenue (Million), by Type 2025 & 2033
- Figure 52: Asia Pacific UK Fixed Connectivity Market Volume (Billion), by Type 2025 & 2033
- Figure 53: Asia Pacific UK Fixed Connectivity Market Revenue Share (%), by Type 2025 & 2033
- Figure 54: Asia Pacific UK Fixed Connectivity Market Volume Share (%), by Type 2025 & 2033
- Figure 55: Asia Pacific UK Fixed Connectivity Market Revenue (Million), by End Users 2025 & 2033
- Figure 56: Asia Pacific UK Fixed Connectivity Market Volume (Billion), by End Users 2025 & 2033
- Figure 57: Asia Pacific UK Fixed Connectivity Market Revenue Share (%), by End Users 2025 & 2033
- Figure 58: Asia Pacific UK Fixed Connectivity Market Volume Share (%), by End Users 2025 & 2033
- Figure 59: Asia Pacific UK Fixed Connectivity Market Revenue (Million), by Country 2025 & 2033
- Figure 60: Asia Pacific UK Fixed Connectivity Market Volume (Billion), by Country 2025 & 2033
- Figure 61: Asia Pacific UK Fixed Connectivity Market Revenue Share (%), by Country 2025 & 2033
- Figure 62: Asia Pacific UK Fixed Connectivity Market Volume Share (%), by Country 2025 & 2033
List of Tables
- Table 1: Global UK Fixed Connectivity Market Revenue Million Forecast, by Type 2020 & 2033
- Table 2: Global UK Fixed Connectivity Market Volume Billion Forecast, by Type 2020 & 2033
- Table 3: Global UK Fixed Connectivity Market Revenue Million Forecast, by End Users 2020 & 2033
- Table 4: Global UK Fixed Connectivity Market Volume Billion Forecast, by End Users 2020 & 2033
- Table 5: Global UK Fixed Connectivity Market Revenue Million Forecast, by Region 2020 & 2033
- Table 6: Global UK Fixed Connectivity Market Volume Billion Forecast, by Region 2020 & 2033
- Table 7: Global UK Fixed Connectivity Market Revenue Million Forecast, by Type 2020 & 2033
- Table 8: Global UK Fixed Connectivity Market Volume Billion Forecast, by Type 2020 & 2033
- Table 9: Global UK Fixed Connectivity Market Revenue Million Forecast, by End Users 2020 & 2033
- Table 10: Global UK Fixed Connectivity Market Volume Billion Forecast, by End Users 2020 & 2033
- Table 11: Global UK Fixed Connectivity Market Revenue Million Forecast, by Country 2020 & 2033
- Table 12: Global UK Fixed Connectivity Market Volume Billion Forecast, by Country 2020 & 2033
- Table 13: United States UK Fixed Connectivity Market Revenue (Million) Forecast, by Application 2020 & 2033
- Table 14: United States UK Fixed Connectivity Market Volume (Billion) Forecast, by Application 2020 & 2033
- Table 15: Canada UK Fixed Connectivity Market Revenue (Million) Forecast, by Application 2020 & 2033
- Table 16: Canada UK Fixed Connectivity Market Volume (Billion) Forecast, by Application 2020 & 2033
- Table 17: Mexico UK Fixed Connectivity Market Revenue (Million) Forecast, by Application 2020 & 2033
- Table 18: Mexico UK Fixed Connectivity Market Volume (Billion) Forecast, by Application 2020 & 2033
- Table 19: Global UK Fixed Connectivity Market Revenue Million Forecast, by Type 2020 & 2033
- Table 20: Global UK Fixed Connectivity Market Volume Billion Forecast, by Type 2020 & 2033
- Table 21: Global UK Fixed Connectivity Market Revenue Million Forecast, by End Users 2020 & 2033
- Table 22: Global UK Fixed Connectivity Market Volume Billion Forecast, by End Users 2020 & 2033
- Table 23: Global UK Fixed Connectivity Market Revenue Million Forecast, by Country 2020 & 2033
- Table 24: Global UK Fixed Connectivity Market Volume Billion Forecast, by Country 2020 & 2033
- Table 25: Brazil UK Fixed Connectivity Market Revenue (Million) Forecast, by Application 2020 & 2033
- Table 26: Brazil UK Fixed Connectivity Market Volume (Billion) Forecast, by Application 2020 & 2033
- Table 27: Argentina UK Fixed Connectivity Market Revenue (Million) Forecast, by Application 2020 & 2033
- Table 28: Argentina UK Fixed Connectivity Market Volume (Billion) Forecast, by Application 2020 & 2033
- Table 29: Rest of South America UK Fixed Connectivity Market Revenue (Million) Forecast, by Application 2020 & 2033
- Table 30: Rest of South America UK Fixed Connectivity Market Volume (Billion) Forecast, by Application 2020 & 2033
- Table 31: Global UK Fixed Connectivity Market Revenue Million Forecast, by Type 2020 & 2033
- Table 32: Global UK Fixed Connectivity Market Volume Billion Forecast, by Type 2020 & 2033
- Table 33: Global UK Fixed Connectivity Market Revenue Million Forecast, by End Users 2020 & 2033
- Table 34: Global UK Fixed Connectivity Market Volume Billion Forecast, by End Users 2020 & 2033
- Table 35: Global UK Fixed Connectivity Market Revenue Million Forecast, by Country 2020 & 2033
- Table 36: Global UK Fixed Connectivity Market Volume Billion Forecast, by Country 2020 & 2033
- Table 37: United Kingdom UK Fixed Connectivity Market Revenue (Million) Forecast, by Application 2020 & 2033
- Table 38: United Kingdom UK Fixed Connectivity Market Volume (Billion) Forecast, by Application 2020 & 2033
- Table 39: Germany UK Fixed Connectivity Market Revenue (Million) Forecast, by Application 2020 & 2033
- Table 40: Germany UK Fixed Connectivity Market Volume (Billion) Forecast, by Application 2020 & 2033
- Table 41: France UK Fixed Connectivity Market Revenue (Million) Forecast, by Application 2020 & 2033
- Table 42: France UK Fixed Connectivity Market Volume (Billion) Forecast, by Application 2020 & 2033
- Table 43: Italy UK Fixed Connectivity Market Revenue (Million) Forecast, by Application 2020 & 2033
- Table 44: Italy UK Fixed Connectivity Market Volume (Billion) Forecast, by Application 2020 & 2033
- Table 45: Spain UK Fixed Connectivity Market Revenue (Million) Forecast, by Application 2020 & 2033
- Table 46: Spain UK Fixed Connectivity Market Volume (Billion) Forecast, by Application 2020 & 2033
- Table 47: Russia UK Fixed Connectivity Market Revenue (Million) Forecast, by Application 2020 & 2033
- Table 48: Russia UK Fixed Connectivity Market Volume (Billion) Forecast, by Application 2020 & 2033
- Table 49: Benelux UK Fixed Connectivity Market Revenue (Million) Forecast, by Application 2020 & 2033
- Table 50: Benelux UK Fixed Connectivity Market Volume (Billion) Forecast, by Application 2020 & 2033
- Table 51: Nordics UK Fixed Connectivity Market Revenue (Million) Forecast, by Application 2020 & 2033
- Table 52: Nordics UK Fixed Connectivity Market Volume (Billion) Forecast, by Application 2020 & 2033
- Table 53: Rest of Europe UK Fixed Connectivity Market Revenue (Million) Forecast, by Application 2020 & 2033
- Table 54: Rest of Europe UK Fixed Connectivity Market Volume (Billion) Forecast, by Application 2020 & 2033
- Table 55: Global UK Fixed Connectivity Market Revenue Million Forecast, by Type 2020 & 2033
- Table 56: Global UK Fixed Connectivity Market Volume Billion Forecast, by Type 2020 & 2033
- Table 57: Global UK Fixed Connectivity Market Revenue Million Forecast, by End Users 2020 & 2033
- Table 58: Global UK Fixed Connectivity Market Volume Billion Forecast, by End Users 2020 & 2033
- Table 59: Global UK Fixed Connectivity Market Revenue Million Forecast, by Country 2020 & 2033
- Table 60: Global UK Fixed Connectivity Market Volume Billion Forecast, by Country 2020 & 2033
- Table 61: Turkey UK Fixed Connectivity Market Revenue (Million) Forecast, by Application 2020 & 2033
- Table 62: Turkey UK Fixed Connectivity Market Volume (Billion) Forecast, by Application 2020 & 2033
- Table 63: Israel UK Fixed Connectivity Market Revenue (Million) Forecast, by Application 2020 & 2033
- Table 64: Israel UK Fixed Connectivity Market Volume (Billion) Forecast, by Application 2020 & 2033
- Table 65: GCC UK Fixed Connectivity Market Revenue (Million) Forecast, by Application 2020 & 2033
- Table 66: GCC UK Fixed Connectivity Market Volume (Billion) Forecast, by Application 2020 & 2033
- Table 67: North Africa UK Fixed Connectivity Market Revenue (Million) Forecast, by Application 2020 & 2033
- Table 68: North Africa UK Fixed Connectivity Market Volume (Billion) Forecast, by Application 2020 & 2033
- Table 69: South Africa UK Fixed Connectivity Market Revenue (Million) Forecast, by Application 2020 & 2033
- Table 70: South Africa UK Fixed Connectivity Market Volume (Billion) Forecast, by Application 2020 & 2033
- Table 71: Rest of Middle East & Africa UK Fixed Connectivity Market Revenue (Million) Forecast, by Application 2020 & 2033
- Table 72: Rest of Middle East & Africa UK Fixed Connectivity Market Volume (Billion) Forecast, by Application 2020 & 2033
- Table 73: Global UK Fixed Connectivity Market Revenue Million Forecast, by Type 2020 & 2033
- Table 74: Global UK Fixed Connectivity Market Volume Billion Forecast, by Type 2020 & 2033
- Table 75: Global UK Fixed Connectivity Market Revenue Million Forecast, by End Users 2020 & 2033
- Table 76: Global UK Fixed Connectivity Market Volume Billion Forecast, by End Users 2020 & 2033
- Table 77: Global UK Fixed Connectivity Market Revenue Million Forecast, by Country 2020 & 2033
- Table 78: Global UK Fixed Connectivity Market Volume Billion Forecast, by Country 2020 & 2033
- Table 79: China UK Fixed Connectivity Market Revenue (Million) Forecast, by Application 2020 & 2033
- Table 80: China UK Fixed Connectivity Market Volume (Billion) Forecast, by Application 2020 & 2033
- Table 81: India UK Fixed Connectivity Market Revenue (Million) Forecast, by Application 2020 & 2033
- Table 82: India UK Fixed Connectivity Market Volume (Billion) Forecast, by Application 2020 & 2033
- Table 83: Japan UK Fixed Connectivity Market Revenue (Million) Forecast, by Application 2020 & 2033
- Table 84: Japan UK Fixed Connectivity Market Volume (Billion) Forecast, by Application 2020 & 2033
- Table 85: South Korea UK Fixed Connectivity Market Revenue (Million) Forecast, by Application 2020 & 2033
- Table 86: South Korea UK Fixed Connectivity Market Volume (Billion) Forecast, by Application 2020 & 2033
- Table 87: ASEAN UK Fixed Connectivity Market Revenue (Million) Forecast, by Application 2020 & 2033
- Table 88: ASEAN UK Fixed Connectivity Market Volume (Billion) Forecast, by Application 2020 & 2033
- Table 89: Oceania UK Fixed Connectivity Market Revenue (Million) Forecast, by Application 2020 & 2033
- Table 90: Oceania UK Fixed Connectivity Market Volume (Billion) Forecast, by Application 2020 & 2033
- Table 91: Rest of Asia Pacific UK Fixed Connectivity Market Revenue (Million) Forecast, by Application 2020 & 2033
- Table 92: Rest of Asia Pacific UK Fixed Connectivity Market Volume (Billion) Forecast, by Application 2020 & 2033
Frequently Asked Questions
1. What is the projected Compound Annual Growth Rate (CAGR) of the UK Fixed Connectivity Market?
The projected CAGR is approximately 3.69%.
2. Which companies are prominent players in the UK Fixed Connectivity Market?
Key companies in the market include TalkTalk Business Direct Limited, Sky UK, Vodafone Limited, BT Group, bOnline Limited, Virgin Media Business Ltd, TVNET Limited, Eurocoms, Full Fibre Limited, ITS Technology Group Ltd, RUCKUS (CommScope), Openreach Limited*List Not Exhaustive.
3. What are the main segments of the UK Fixed Connectivity Market?
The market segments include Type, End Users.
4. Can you provide details about the market size?
The market size is estimated to be USD 34.02 Million as of 2022.
5. What are some drivers contributing to market growth?
Huge demand for high-speed connectivity; Rising digital transformation in the industries.
6. What are the notable trends driving market growth?
Digital Transformation is Increasing Across the Industries.
7. Are there any restraints impacting market growth?
Huge demand for high-speed connectivity; Rising digital transformation in the industries.
8. Can you provide examples of recent developments in the market?
May 2024: BT Group, the UK's provider of fixed and mobile telecommunications, along with a suite of secure digital offerings, unveiled an updated timeline for transitioning all its customers, spanning both individual consumers and businesses from the traditional Public Switched Telephone Network (PSTN) to digital landlines. The move followed the introduction of a series of program enhancements aimed at better protecting vulnerable customers, especially those with additional needs, such as telecare users.February 2024: BT Group, the provider of fixed and mobile telecommunications in the United Kingdom, unveiled its advanced NB-IoT network. This multi-million-pound investment is poised to catalyze the development of smart cities and industries across the UK, boasting an overall 97% population coverage. Powered by the EE mobile network, NB-IoT is a low-power network, holding the potential to transform sectors like utilities, construction, and the public domain.
9. What pricing options are available for accessing the report?
Pricing options include single-user, multi-user, and enterprise licenses priced at USD 3800, USD 4500, and USD 5800 respectively.
10. Is the market size provided in terms of value or volume?
The market size is provided in terms of value, measured in Million and volume, measured in Billion.
11. Are there any specific market keywords associated with the report?
Yes, the market keyword associated with the report is "UK Fixed Connectivity Market," which aids in identifying and referencing the specific market segment covered.
12. How do I determine which pricing option suits my needs best?
The pricing options vary based on user requirements and access needs. Individual users may opt for single-user licenses, while businesses requiring broader access may choose multi-user or enterprise licenses for cost-effective access to the report.
13. Are there any additional resources or data provided in the UK Fixed Connectivity Market report?
While the report offers comprehensive insights, it's advisable to review the specific contents or supplementary materials provided to ascertain if additional resources or data are available.
14. How can I stay updated on further developments or reports in the UK Fixed Connectivity Market?
To stay informed about further developments, trends, and reports in the UK Fixed Connectivity Market, consider subscribing to industry newsletters, following relevant companies and organizations, or regularly checking reputable industry news sources and publications.
Methodology
Step 1 - Identification of Relevant Samples Size from Population Database


Step 2 - Approaches for Defining Global Market Size (Value, Volume* & Price*)

Note*: In applicable scenarios
Step 3 - Data Sources
Primary Research
- Web Analytics
- Survey Reports
- Research Institute
- Latest Research Reports
- Opinion Leaders
Secondary Research
- Annual Reports
- White Paper
- Latest Press Release
- Industry Association
- Paid Database
- Investor Presentations

Step 4 - Data Triangulation
Involves using different sources of information in order to increase the validity of a study
These sources are likely to be stakeholders in a program - participants, other researchers, program staff, other community members, and so on.
Then we put all data in single framework & apply various statistical tools to find out the dynamic on the market.
During the analysis stage, feedback from the stakeholder groups would be compared to determine areas of agreement as well as areas of divergence