

Key Insights
The UK office real estate market, valued at £149.67 billion in 2024, is poised for significant expansion at a Compound Annual Growth Rate (CAGR) of 5.2% through 2033. Key growth drivers include rising demand for flexible workspaces driven by evolving work styles and employee wellbeing, alongside technological advancements enhancing communication and collaboration. Urban regeneration and infrastructure development in major cities like London, Birmingham, and Manchester further bolster the sector. The proliferation of co-working and serviced offices also contributes to market diversification.
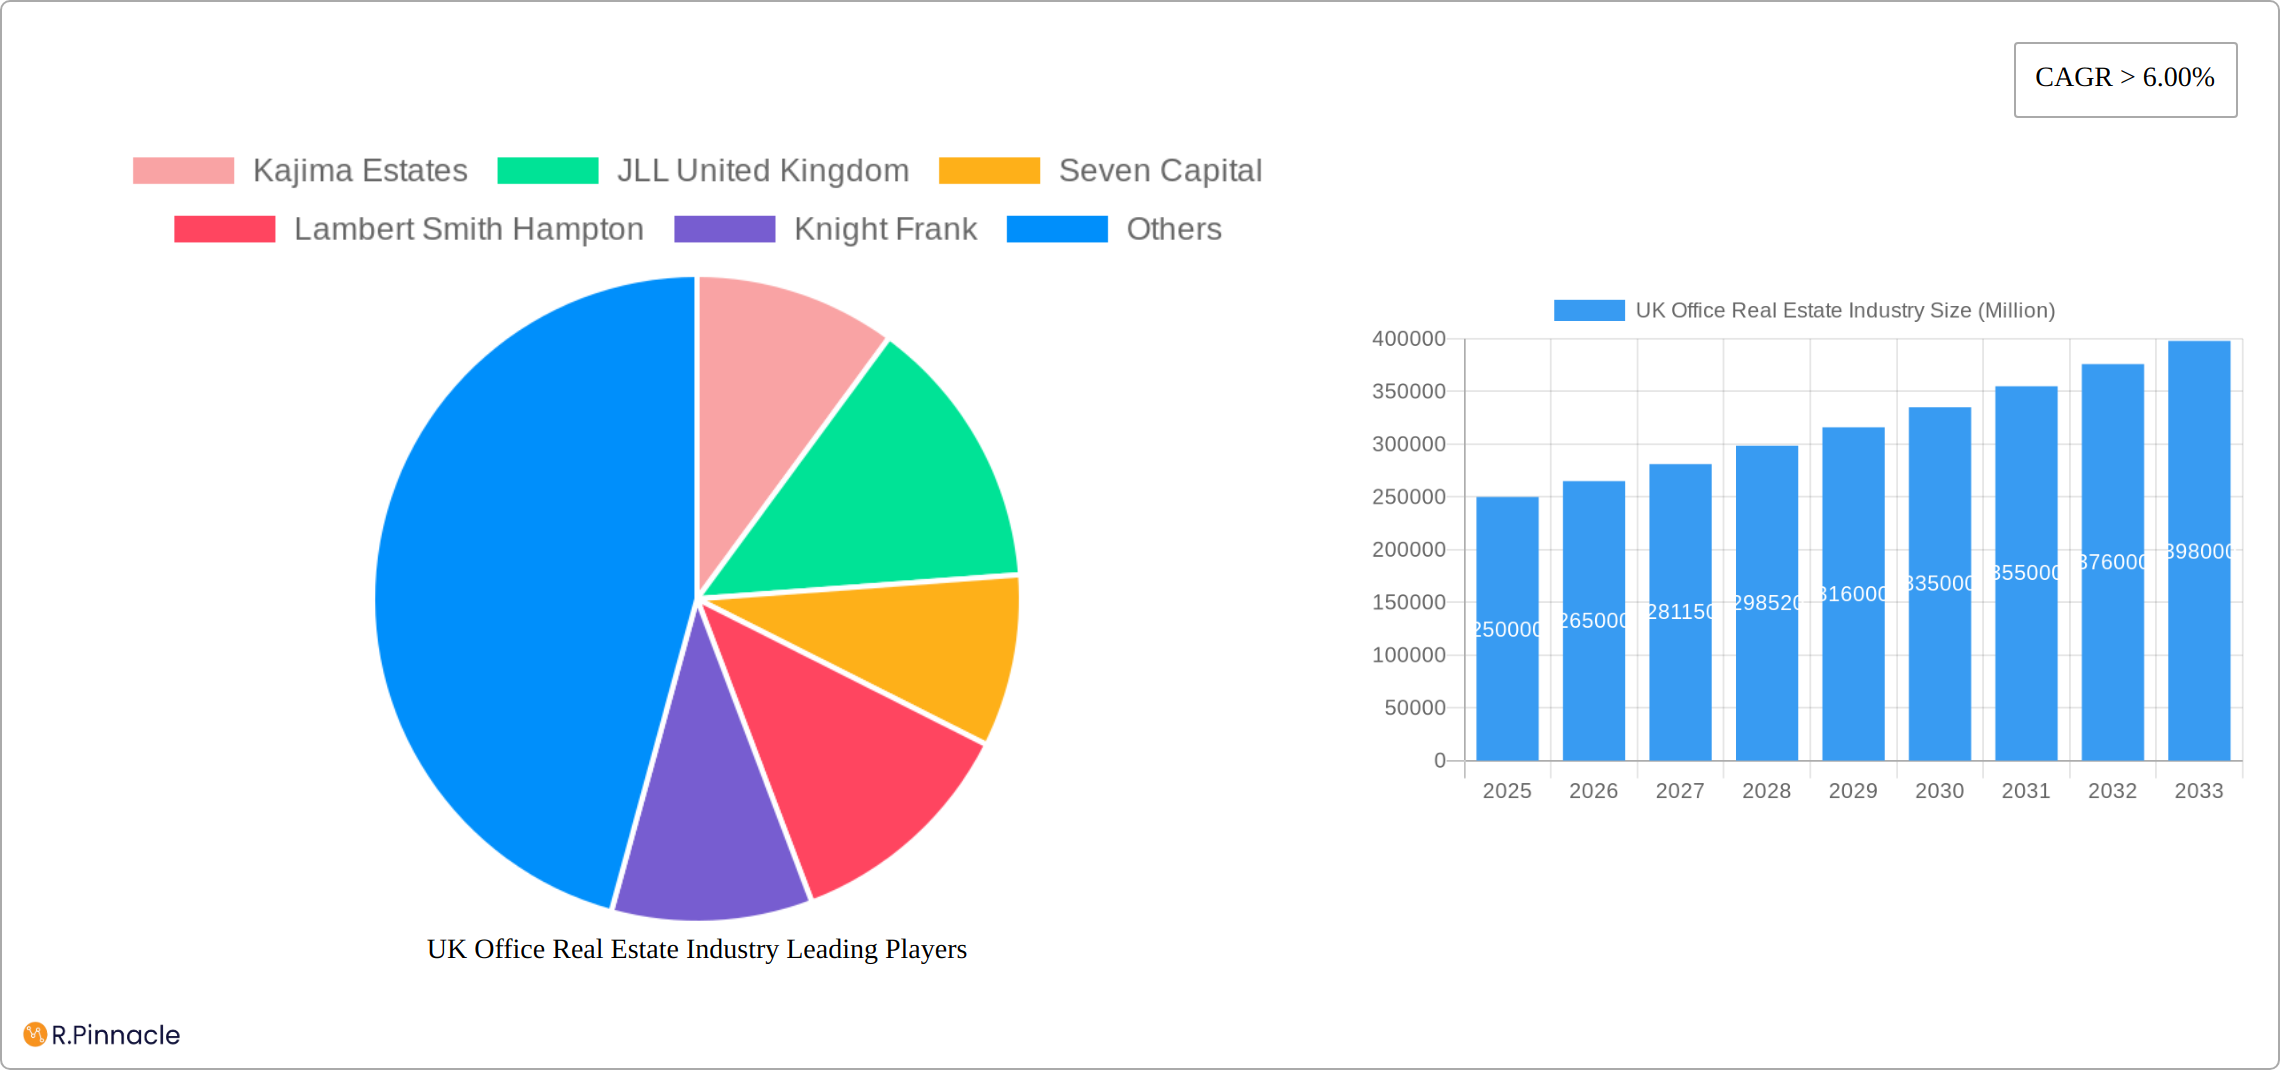
UK Office Real Estate Industry Market Size (In Billion)
Despite positive trends, market growth faces restraints from economic uncertainty, fluctuating interest rates, and geopolitical events influencing investment. The continued adoption of remote and hybrid working models challenges traditional leasing. Furthermore, land scarcity and escalating construction costs in prime areas impede development. To navigate these challenges, stakeholders are increasingly emphasizing sustainable, innovative, and technologically advanced building designs, prioritizing tenant experience. This strategic pivot towards adaptability and sustainability will shape the future of the UK office real estate market, characterized by competition among key players such as Kajima Estates and JLL United Kingdom.

UK Office Real Estate Industry Company Market Share
UK Office Real Estate Industry Report: 2019-2033 Forecast
Unlocking Growth Opportunities in the UK's Dynamic Office Market
This comprehensive report provides an in-depth analysis of the UK office real estate industry, offering invaluable insights for investors, developers, and industry professionals. Covering the period from 2019 to 2033, with a focus on 2025, this study unveils market trends, dominant players, and future growth prospects. Benefit from detailed segmentation by key cities (London, Birmingham, Manchester, and other cities), uncovering lucrative investment opportunities and understanding the evolving landscape of the UK's office sector.
UK Office Real Estate Industry Market Structure & Innovation Trends
This section analyzes the UK office real estate market's structure, identifying key players and their market share, innovation drivers, and regulatory influences. We examine mergers and acquisitions (M&A) activity, quantifying deal values and their impact on market concentration.
- Market Concentration: The UK office market exhibits a moderately concentrated structure, with major players like CBRE, Knight Frank, and JLL United Kingdom holding significant market share (estimated at xx%). Smaller players, such as Salboy Ltd and Seven Capital, focus on niche segments and regional markets.
- Innovation Drivers: Technological advancements, like smart building technologies and flexible workspace solutions, are driving innovation. Sustainability initiatives and evolving workplace strategies are reshaping office design and demand.
- Regulatory Framework: Government policies on planning permissions, environmental regulations, and taxation significantly influence market dynamics. Changes in these regulations are likely to impact development costs and investment decisions.
- Product Substitutes: The rise of co-working spaces and remote work options presents a challenge to traditional office spaces, impacting demand in certain segments.
- End-User Demographics: Shifting demographic trends, particularly the growth of the millennial and Gen Z workforce, influence demand for flexible and amenity-rich office spaces.
- M&A Activity: The historical period (2019-2024) witnessed significant M&A activity, with deal values totaling approximately £xx Million. This consolidation trend is expected to continue, further shaping market concentration in the forecast period. Key examples include [insert specific M&A examples if available, otherwise state "xx major deals"].
UK Office Real Estate Industry Market Dynamics & Trends
The UK office real estate market is undergoing a period of significant transformation, driven by a complex interplay of economic factors, technological advancements, and evolving workplace preferences. While the sector faces challenges, opportunities abound for those who can adapt to the changing landscape. Our analysis projects a Compound Annual Growth Rate (CAGR) of [Insert Projected CAGR]% during the forecast period (2025-2033), although this figure is subject to macroeconomic volatility and unforeseen events.
Several key drivers are shaping this growth. Sustained (albeit fluctuating) economic growth, coupled with ongoing urbanization and large-scale infrastructure projects like HS2, continue to fuel demand for office space, particularly in key metropolitan areas. However, the post-pandemic shift towards hybrid and remote work models has significantly impacted demand, leading to a decrease in demand for traditional, large-scale office spaces. This shift is reflected in the increasing popularity of flexible workspaces, such as co-working spaces and serviced offices, which offer greater agility and cost-effectiveness. Market penetration for flexible workspaces is estimated at [Insert Percentage]% in 2023, projected to rise to [Insert Projected Percentage]% by 2033. The increasing focus on sustainability, driven by both environmental concerns and corporate social responsibility initiatives, is also reshaping the market, with a growing preference for green buildings and energy-efficient technologies. The market penetration of smart building technologies, crucial for achieving sustainability goals and enhancing workplace experience, is projected to reach [Insert Percentage]% by 2033, driven by increased demand for energy efficiency and improved building performance. This trend is further amplified by stringent government regulations and incentives promoting sustainable development. Furthermore, the competitive landscape is becoming increasingly dynamic, with both consolidation amongst larger players and the emergence of innovative PropTech companies disrupting traditional business models. Competition is also intensifying within specific segments, particularly in the flexible workspace sector. Finally, population shifts within and between regions of the UK are influencing local market conditions, creating both opportunities and challenges in different localities.
Dominant Regions & Segments in UK Office Real Estate Industry
This section analyzes the dominance of specific regions and segments within the UK office real estate market, with a particular focus on London, Birmingham, Manchester, and other cities.
London:
- Key Drivers: Strong economic activity, established financial sector, excellent transport infrastructure, and a large pool of skilled labor.
- Dominance Analysis: London remains the dominant market, attracting significant investment and high rental values due to its strong concentration of businesses and high demand.
Birmingham:
- Key Drivers: Significant regeneration projects, improving infrastructure, and a growing tech sector.
- Dominance Analysis: Birmingham is experiencing strong growth, driven by investment in infrastructure and a diversification of its economy.
Manchester:
- Key Drivers: A thriving digital economy, a growing population, and significant investment in regeneration projects.
- Dominance Analysis: Manchester is attracting significant attention as a hub for technology and innovation.
Other Cities:
- Key Drivers: Regional economic growth, improving connectivity, and government initiatives to decentralize economic activity.
- Dominance Analysis: These cities are seeing increased investment, although at a slower pace than London, Birmingham, and Manchester.
[Insert a paragraph providing a detailed comparative analysis of these four city markets' dominance, supporting it with data on rental values, occupancy rates, investment volumes, and other relevant metrics.]
UK Office Real Estate Industry Product Innovations
The UK office real estate sector is witnessing a wave of innovation, driven by the need to cater to the evolving needs of businesses and tenants. Smart building technologies are at the forefront of this transformation, offering enhanced energy efficiency, improved security, and optimized building management. Flexible workspace designs are becoming increasingly prevalent, with modular layouts and adaptable spaces allowing businesses to easily adjust their office footprint to meet changing requirements. The integration of wellness features, such as improved air quality, natural light, and access to amenities, is gaining traction as businesses prioritize employee wellbeing. Sustainable building practices, including the use of renewable energy sources and eco-friendly materials, are becoming the norm, driven by both environmental concerns and regulatory pressures. The rise of co-working spaces and serviced offices continues to disrupt the traditional office market, providing flexible and cost-effective solutions for businesses of all sizes.
Report Scope & Segmentation Analysis
This report segments the UK office real estate market by key cities: London, Birmingham, Manchester, and other cities. Each segment is analyzed based on market size, growth projections, and competitive dynamics.
London: The London market is characterized by high rental values and strong competition among major players. We project xx Million in market size for 2025, with a CAGR of xx% during the forecast period.
Birmingham: The Birmingham market exhibits moderate growth potential, with increasing demand from businesses seeking lower rental costs compared to London. The 2025 market size is estimated at xx Million.
Manchester: The Manchester market is experiencing rapid growth, driven by its thriving digital economy and infrastructure development. The 2025 market size is estimated at xx Million.
Other Cities: This segment comprises a diverse range of markets with varying growth prospects. Aggregate market size is estimated at xx Million for 2025.
Key Drivers of UK Office Real Estate Industry Growth
The sustained growth of the UK office real estate industry is underpinned by several key factors. Continued economic expansion, albeit with potential periods of slowdown, underpins the demand for office space. The ongoing process of urbanization, particularly in major cities, continues to create pressure on office space availability. Large-scale infrastructure projects, such as HS2, are transforming regional connectivity and driving investment in surrounding areas. Government initiatives promoting regeneration and sustainable development are creating new opportunities for office development and redevelopment. Technological advancements, including the development of sophisticated building management systems and innovative workplace technologies, are improving efficiency and attracting tenants to modern spaces. Finally, the increasing focus on creating attractive and productive workplaces that meet the needs of a modern workforce is driving innovation and investment in the sector.
Challenges in the UK Office Real Estate Industry Sector
Challenges include Brexit's lingering economic uncertainties, fluctuations in interest rates impacting financing costs, and competition from alternative workspace solutions (e.g., co-working spaces, remote work). Supply chain disruptions and rising construction costs also pose significant challenges. The impact of these factors is estimated to reduce overall market growth by approximately xx% during the forecast period.
Emerging Opportunities in UK Office Real Estate Industry
Significant opportunities exist for businesses and investors who can capitalize on the evolving demands of the market. The rising demand for sustainable and energy-efficient office spaces presents a clear opportunity, with incentives and regulations further driving this trend. The adoption of smart building technologies provides avenues for enhanced operational efficiency and improved tenant experience, leading to higher occupancy rates and rental income. The expansion of flexible workspace models, catering to the growing demand for agile and adaptable workspaces, remains a significant growth area. Investors can find opportunities in developing innovative workplace solutions, targeting specific niche markets, such as the life sciences or technology sectors, and focusing on particular geographic areas experiencing rapid growth or transformation. Furthermore, opportunities exist in providing value-added services beyond traditional leasing, such as workplace consultancy and property technology solutions.
Leading Players in the UK Office Real Estate Industry Market
- Kajima Estates
- JLL United Kingdom
- Seven Capital
- Lambert Smith Hampton
- Knight Frank
- LBS Properties
- Hines United Kingdom
- Salboy Ltd
- CBRE
Key Developments in UK Office Real Estate Industry Industry
- 2022 Q4: Increased investment in sustainable building technologies.
- 2023 Q1: Launch of several new co-working spaces in major cities.
- 2023 Q3: Significant M&A activity amongst mid-sized firms.
- [Add further developments with year/month and a brief description of their impact]
Future Outlook for UK Office Real Estate Industry Market
The UK office real estate market is poised for continued growth, driven by long-term economic trends and technological innovation. Strategic investments in sustainable and flexible workspace solutions will be crucial for success. While challenges remain, the long-term outlook remains positive, with considerable potential for growth and diversification within the sector. The market is expected to experience a significant increase in value, reaching approximately £xx Million by 2033.
UK Office Real Estate Industry Segmentation
-
1. Key Cities
- 1.1. London
- 1.2. Birmingham
- 1.3. Manchester
- 1.4. Other Cities
UK Office Real Estate Industry Segmentation By Geography
-
1. North America
- 1.1. United States
- 1.2. Canada
- 1.3. Mexico
-
2. South America
- 2.1. Brazil
- 2.2. Argentina
- 2.3. Rest of South America
-
3. Europe
- 3.1. United Kingdom
- 3.2. Germany
- 3.3. France
- 3.4. Italy
- 3.5. Spain
- 3.6. Russia
- 3.7. Benelux
- 3.8. Nordics
- 3.9. Rest of Europe
-
4. Middle East & Africa
- 4.1. Turkey
- 4.2. Israel
- 4.3. GCC
- 4.4. North Africa
- 4.5. South Africa
- 4.6. Rest of Middle East & Africa
-
5. Asia Pacific
- 5.1. China
- 5.2. India
- 5.3. Japan
- 5.4. South Korea
- 5.5. ASEAN
- 5.6. Oceania
- 5.7. Rest of Asia Pacific
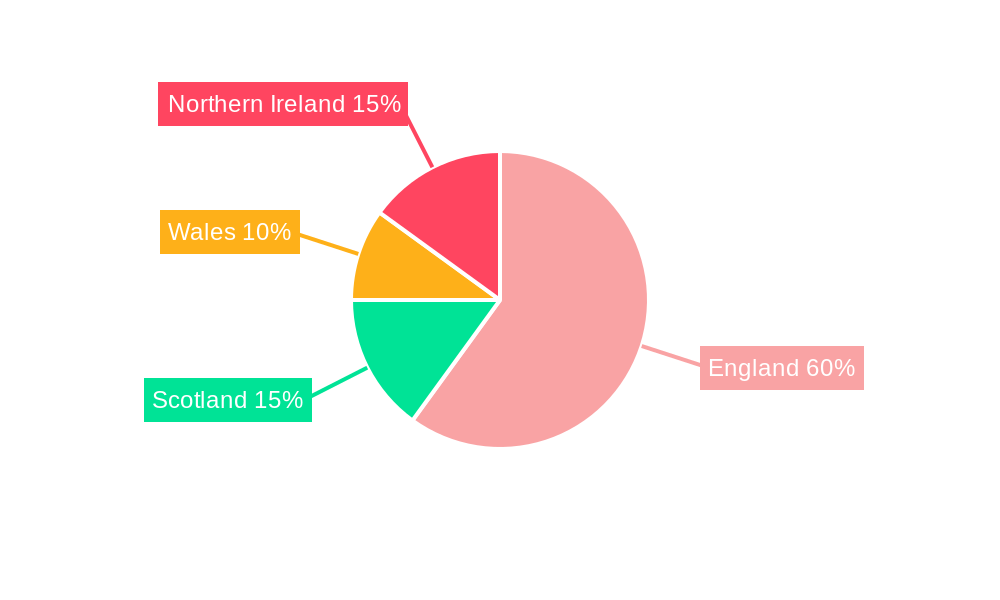
UK Office Real Estate Industry Regional Market Share
Geographic Coverage of UK Office Real Estate Industry
UK Office Real Estate Industry REPORT HIGHLIGHTS
| Aspects | Details |
|---|---|
| Study Period | 2020-2034 |
| Base Year | 2025 |
| Estimated Year | 2026 |
| Forecast Period | 2026-2034 |
| Historical Period | 2020-2025 |
| Growth Rate | CAGR of 5.2% from 2020-2034 |
| Segmentation |
|
Table of Contents
- 1. Introduction
- 1.1. Research Scope
- 1.2. Market Segmentation
- 1.3. Research Methodology
- 1.4. Definitions and Assumptions
- 2. Executive Summary
- 2.1. Introduction
- 3. Market Dynamics
- 3.1. Introduction
- 3.2. Market Drivers
- 3.2.1. 4.; Increase in Number of Startups4.; The Development of Sustainable Co-working Spaces
- 3.3. Market Restrains
- 3.3.1 4.; A Rise in Remote Work4.; Traditional Work Culture in India
- 3.3.2 Which May Not Align Well With the Open and Collaborative Environment of Co-working Spaces
- 3.4. Market Trends
- 3.4.1. Declining Vacancy Rates and Increasing Rents of Office Spaces in London
- 4. Market Factor Analysis
- 4.1. Porters Five Forces
- 4.2. Supply/Value Chain
- 4.3. PESTEL analysis
- 4.4. Market Entropy
- 4.5. Patent/Trademark Analysis
- 5. Global UK Office Real Estate Industry Analysis, Insights and Forecast, 2020-2032
- 5.1. Market Analysis, Insights and Forecast - by Key Cities
- 5.1.1. London
- 5.1.2. Birmingham
- 5.1.3. Manchester
- 5.1.4. Other Cities
- 5.2. Market Analysis, Insights and Forecast - by Region
- 5.2.1. North America
- 5.2.2. South America
- 5.2.3. Europe
- 5.2.4. Middle East & Africa
- 5.2.5. Asia Pacific
- 5.1. Market Analysis, Insights and Forecast - by Key Cities
- 6. North America UK Office Real Estate Industry Analysis, Insights and Forecast, 2020-2032
- 6.1. Market Analysis, Insights and Forecast - by Key Cities
- 6.1.1. London
- 6.1.2. Birmingham
- 6.1.3. Manchester
- 6.1.4. Other Cities
- 6.1. Market Analysis, Insights and Forecast - by Key Cities
- 7. South America UK Office Real Estate Industry Analysis, Insights and Forecast, 2020-2032
- 7.1. Market Analysis, Insights and Forecast - by Key Cities
- 7.1.1. London
- 7.1.2. Birmingham
- 7.1.3. Manchester
- 7.1.4. Other Cities
- 7.1. Market Analysis, Insights and Forecast - by Key Cities
- 8. Europe UK Office Real Estate Industry Analysis, Insights and Forecast, 2020-2032
- 8.1. Market Analysis, Insights and Forecast - by Key Cities
- 8.1.1. London
- 8.1.2. Birmingham
- 8.1.3. Manchester
- 8.1.4. Other Cities
- 8.1. Market Analysis, Insights and Forecast - by Key Cities
- 9. Middle East & Africa UK Office Real Estate Industry Analysis, Insights and Forecast, 2020-2032
- 9.1. Market Analysis, Insights and Forecast - by Key Cities
- 9.1.1. London
- 9.1.2. Birmingham
- 9.1.3. Manchester
- 9.1.4. Other Cities
- 9.1. Market Analysis, Insights and Forecast - by Key Cities
- 10. Asia Pacific UK Office Real Estate Industry Analysis, Insights and Forecast, 2020-2032
- 10.1. Market Analysis, Insights and Forecast - by Key Cities
- 10.1.1. London
- 10.1.2. Birmingham
- 10.1.3. Manchester
- 10.1.4. Other Cities
- 10.1. Market Analysis, Insights and Forecast - by Key Cities
- 11. Competitive Analysis
- 11.1. Global Market Share Analysis 2025
- 11.2. Company Profiles
- 11.2.1 Kajima Estates
- 11.2.1.1. Overview
- 11.2.1.2. Products
- 11.2.1.3. SWOT Analysis
- 11.2.1.4. Recent Developments
- 11.2.1.5. Financials (Based on Availability)
- 11.2.2 JLL United Kingdom
- 11.2.2.1. Overview
- 11.2.2.2. Products
- 11.2.2.3. SWOT Analysis
- 11.2.2.4. Recent Developments
- 11.2.2.5. Financials (Based on Availability)
- 11.2.3 Seven Capital
- 11.2.3.1. Overview
- 11.2.3.2. Products
- 11.2.3.3. SWOT Analysis
- 11.2.3.4. Recent Developments
- 11.2.3.5. Financials (Based on Availability)
- 11.2.4 Lambert Smith Hampton
- 11.2.4.1. Overview
- 11.2.4.2. Products
- 11.2.4.3. SWOT Analysis
- 11.2.4.4. Recent Developments
- 11.2.4.5. Financials (Based on Availability)
- 11.2.5 Knight Frank
- 11.2.5.1. Overview
- 11.2.5.2. Products
- 11.2.5.3. SWOT Analysis
- 11.2.5.4. Recent Developments
- 11.2.5.5. Financials (Based on Availability)
- 11.2.6 LBS Properties
- 11.2.6.1. Overview
- 11.2.6.2. Products
- 11.2.6.3. SWOT Analysis
- 11.2.6.4. Recent Developments
- 11.2.6.5. Financials (Based on Availability)
- 11.2.7 Hines United Kingdom
- 11.2.7.1. Overview
- 11.2.7.2. Products
- 11.2.7.3. SWOT Analysis
- 11.2.7.4. Recent Developments
- 11.2.7.5. Financials (Based on Availability)
- 11.2.8 Salboy Ltd
- 11.2.8.1. Overview
- 11.2.8.2. Products
- 11.2.8.3. SWOT Analysis
- 11.2.8.4. Recent Developments
- 11.2.8.5. Financials (Based on Availability)
- 11.2.9 CBRE
- 11.2.9.1. Overview
- 11.2.9.2. Products
- 11.2.9.3. SWOT Analysis
- 11.2.9.4. Recent Developments
- 11.2.9.5. Financials (Based on Availability)
- 11.2.1 Kajima Estates
List of Figures
- Figure 1: Global UK Office Real Estate Industry Revenue Breakdown (billion, %) by Region 2025 & 2033
- Figure 2: North America UK Office Real Estate Industry Revenue (billion), by Key Cities 2025 & 2033
- Figure 3: North America UK Office Real Estate Industry Revenue Share (%), by Key Cities 2025 & 2033
- Figure 4: North America UK Office Real Estate Industry Revenue (billion), by Country 2025 & 2033
- Figure 5: North America UK Office Real Estate Industry Revenue Share (%), by Country 2025 & 2033
- Figure 6: South America UK Office Real Estate Industry Revenue (billion), by Key Cities 2025 & 2033
- Figure 7: South America UK Office Real Estate Industry Revenue Share (%), by Key Cities 2025 & 2033
- Figure 8: South America UK Office Real Estate Industry Revenue (billion), by Country 2025 & 2033
- Figure 9: South America UK Office Real Estate Industry Revenue Share (%), by Country 2025 & 2033
- Figure 10: Europe UK Office Real Estate Industry Revenue (billion), by Key Cities 2025 & 2033
- Figure 11: Europe UK Office Real Estate Industry Revenue Share (%), by Key Cities 2025 & 2033
- Figure 12: Europe UK Office Real Estate Industry Revenue (billion), by Country 2025 & 2033
- Figure 13: Europe UK Office Real Estate Industry Revenue Share (%), by Country 2025 & 2033
- Figure 14: Middle East & Africa UK Office Real Estate Industry Revenue (billion), by Key Cities 2025 & 2033
- Figure 15: Middle East & Africa UK Office Real Estate Industry Revenue Share (%), by Key Cities 2025 & 2033
- Figure 16: Middle East & Africa UK Office Real Estate Industry Revenue (billion), by Country 2025 & 2033
- Figure 17: Middle East & Africa UK Office Real Estate Industry Revenue Share (%), by Country 2025 & 2033
- Figure 18: Asia Pacific UK Office Real Estate Industry Revenue (billion), by Key Cities 2025 & 2033
- Figure 19: Asia Pacific UK Office Real Estate Industry Revenue Share (%), by Key Cities 2025 & 2033
- Figure 20: Asia Pacific UK Office Real Estate Industry Revenue (billion), by Country 2025 & 2033
- Figure 21: Asia Pacific UK Office Real Estate Industry Revenue Share (%), by Country 2025 & 2033
List of Tables
- Table 1: Global UK Office Real Estate Industry Revenue billion Forecast, by Key Cities 2020 & 2033
- Table 2: Global UK Office Real Estate Industry Revenue billion Forecast, by Region 2020 & 2033
- Table 3: Global UK Office Real Estate Industry Revenue billion Forecast, by Key Cities 2020 & 2033
- Table 4: Global UK Office Real Estate Industry Revenue billion Forecast, by Country 2020 & 2033
- Table 5: United States UK Office Real Estate Industry Revenue (billion) Forecast, by Application 2020 & 2033
- Table 6: Canada UK Office Real Estate Industry Revenue (billion) Forecast, by Application 2020 & 2033
- Table 7: Mexico UK Office Real Estate Industry Revenue (billion) Forecast, by Application 2020 & 2033
- Table 8: Global UK Office Real Estate Industry Revenue billion Forecast, by Key Cities 2020 & 2033
- Table 9: Global UK Office Real Estate Industry Revenue billion Forecast, by Country 2020 & 2033
- Table 10: Brazil UK Office Real Estate Industry Revenue (billion) Forecast, by Application 2020 & 2033
- Table 11: Argentina UK Office Real Estate Industry Revenue (billion) Forecast, by Application 2020 & 2033
- Table 12: Rest of South America UK Office Real Estate Industry Revenue (billion) Forecast, by Application 2020 & 2033
- Table 13: Global UK Office Real Estate Industry Revenue billion Forecast, by Key Cities 2020 & 2033
- Table 14: Global UK Office Real Estate Industry Revenue billion Forecast, by Country 2020 & 2033
- Table 15: United Kingdom UK Office Real Estate Industry Revenue (billion) Forecast, by Application 2020 & 2033
- Table 16: Germany UK Office Real Estate Industry Revenue (billion) Forecast, by Application 2020 & 2033
- Table 17: France UK Office Real Estate Industry Revenue (billion) Forecast, by Application 2020 & 2033
- Table 18: Italy UK Office Real Estate Industry Revenue (billion) Forecast, by Application 2020 & 2033
- Table 19: Spain UK Office Real Estate Industry Revenue (billion) Forecast, by Application 2020 & 2033
- Table 20: Russia UK Office Real Estate Industry Revenue (billion) Forecast, by Application 2020 & 2033
- Table 21: Benelux UK Office Real Estate Industry Revenue (billion) Forecast, by Application 2020 & 2033
- Table 22: Nordics UK Office Real Estate Industry Revenue (billion) Forecast, by Application 2020 & 2033
- Table 23: Rest of Europe UK Office Real Estate Industry Revenue (billion) Forecast, by Application 2020 & 2033
- Table 24: Global UK Office Real Estate Industry Revenue billion Forecast, by Key Cities 2020 & 2033
- Table 25: Global UK Office Real Estate Industry Revenue billion Forecast, by Country 2020 & 2033
- Table 26: Turkey UK Office Real Estate Industry Revenue (billion) Forecast, by Application 2020 & 2033
- Table 27: Israel UK Office Real Estate Industry Revenue (billion) Forecast, by Application 2020 & 2033
- Table 28: GCC UK Office Real Estate Industry Revenue (billion) Forecast, by Application 2020 & 2033
- Table 29: North Africa UK Office Real Estate Industry Revenue (billion) Forecast, by Application 2020 & 2033
- Table 30: South Africa UK Office Real Estate Industry Revenue (billion) Forecast, by Application 2020 & 2033
- Table 31: Rest of Middle East & Africa UK Office Real Estate Industry Revenue (billion) Forecast, by Application 2020 & 2033
- Table 32: Global UK Office Real Estate Industry Revenue billion Forecast, by Key Cities 2020 & 2033
- Table 33: Global UK Office Real Estate Industry Revenue billion Forecast, by Country 2020 & 2033
- Table 34: China UK Office Real Estate Industry Revenue (billion) Forecast, by Application 2020 & 2033
- Table 35: India UK Office Real Estate Industry Revenue (billion) Forecast, by Application 2020 & 2033
- Table 36: Japan UK Office Real Estate Industry Revenue (billion) Forecast, by Application 2020 & 2033
- Table 37: South Korea UK Office Real Estate Industry Revenue (billion) Forecast, by Application 2020 & 2033
- Table 38: ASEAN UK Office Real Estate Industry Revenue (billion) Forecast, by Application 2020 & 2033
- Table 39: Oceania UK Office Real Estate Industry Revenue (billion) Forecast, by Application 2020 & 2033
- Table 40: Rest of Asia Pacific UK Office Real Estate Industry Revenue (billion) Forecast, by Application 2020 & 2033
Frequently Asked Questions
1. What is the projected Compound Annual Growth Rate (CAGR) of the UK Office Real Estate Industry?
The projected CAGR is approximately 5.2%.
2. Which companies are prominent players in the UK Office Real Estate Industry?
Key companies in the market include Kajima Estates, JLL United Kingdom, Seven Capital, Lambert Smith Hampton, Knight Frank, LBS Properties, Hines United Kingdom, Salboy Ltd, CBRE.
3. What are the main segments of the UK Office Real Estate Industry?
The market segments include Key Cities.
4. Can you provide details about the market size?
The market size is estimated to be USD 149.67 billion as of 2022.
5. What are some drivers contributing to market growth?
4.; Increase in Number of Startups4.; The Development of Sustainable Co-working Spaces.
6. What are the notable trends driving market growth?
Declining Vacancy Rates and Increasing Rents of Office Spaces in London.
7. Are there any restraints impacting market growth?
4.; A Rise in Remote Work4.; Traditional Work Culture in India. Which May Not Align Well With the Open and Collaborative Environment of Co-working Spaces.
8. Can you provide examples of recent developments in the market?
N/A
9. What pricing options are available for accessing the report?
Pricing options include single-user, multi-user, and enterprise licenses priced at USD 3800, USD 4500, and USD 5800 respectively.
10. Is the market size provided in terms of value or volume?
The market size is provided in terms of value, measured in billion.
11. Are there any specific market keywords associated with the report?
Yes, the market keyword associated with the report is "UK Office Real Estate Industry," which aids in identifying and referencing the specific market segment covered.
12. How do I determine which pricing option suits my needs best?
The pricing options vary based on user requirements and access needs. Individual users may opt for single-user licenses, while businesses requiring broader access may choose multi-user or enterprise licenses for cost-effective access to the report.
13. Are there any additional resources or data provided in the UK Office Real Estate Industry report?
While the report offers comprehensive insights, it's advisable to review the specific contents or supplementary materials provided to ascertain if additional resources or data are available.
14. How can I stay updated on further developments or reports in the UK Office Real Estate Industry?
To stay informed about further developments, trends, and reports in the UK Office Real Estate Industry, consider subscribing to industry newsletters, following relevant companies and organizations, or regularly checking reputable industry news sources and publications.
Methodology
Step 1 - Identification of Relevant Samples Size from Population Database


Step 2 - Approaches for Defining Global Market Size (Value, Volume* & Price*)

Note*: In applicable scenarios
Step 3 - Data Sources
Primary Research
- Web Analytics
- Survey Reports
- Research Institute
- Latest Research Reports
- Opinion Leaders
Secondary Research
- Annual Reports
- White Paper
- Latest Press Release
- Industry Association
- Paid Database
- Investor Presentations

Step 4 - Data Triangulation
Involves using different sources of information in order to increase the validity of a study
These sources are likely to be stakeholders in a program - participants, other researchers, program staff, other community members, and so on.
Then we put all data in single framework & apply various statistical tools to find out the dynamic on the market.
During the analysis stage, feedback from the stakeholder groups would be compared to determine areas of agreement as well as areas of divergence