

Key Insights
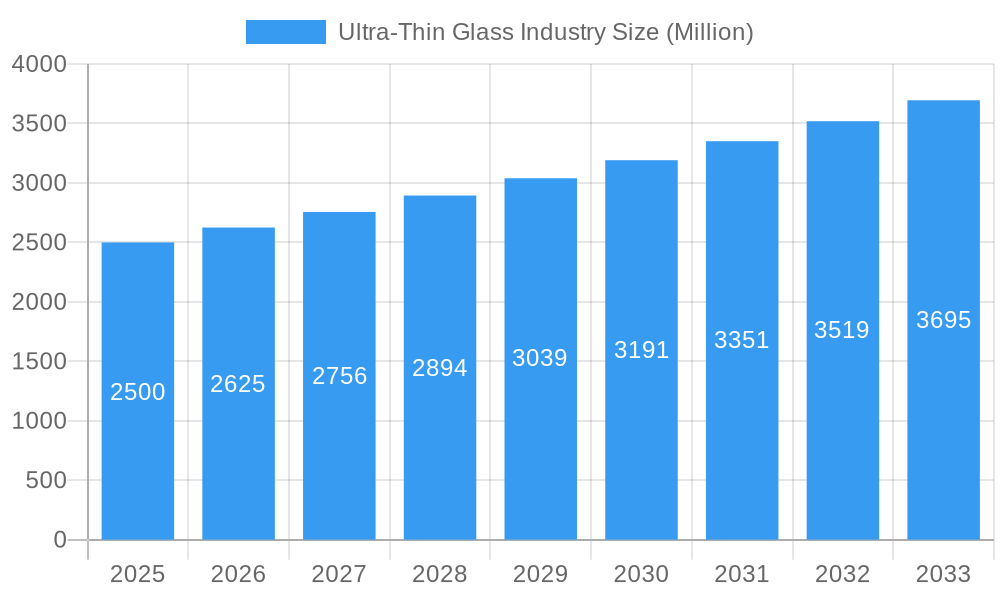
The ultra-thin glass market is experiencing robust growth, driven by increasing demand across diverse sectors. A compound annual growth rate (CAGR) exceeding 5% indicates a significant expansion projected through 2033. Key application segments like semiconductor substrates, touch panel displays, and fingerprint sensors are fueling this expansion, alongside the burgeoning automotive industry's adoption of ultra-thin glass for glazing. The Asia-Pacific region, particularly China and South Korea, holds a substantial market share due to the concentration of electronics manufacturing and a rapidly growing automotive sector. Consumer electronics remain a dominant end-user industry, although the biotechnology sector is emerging as a notable driver, with applications in advanced medical devices and lab-on-a-chip technologies. While challenges like stringent quality control and manufacturing complexities exist, continuous technological advancements and the pursuit of lighter, more durable materials are mitigating these restraints, further bolstering market growth.
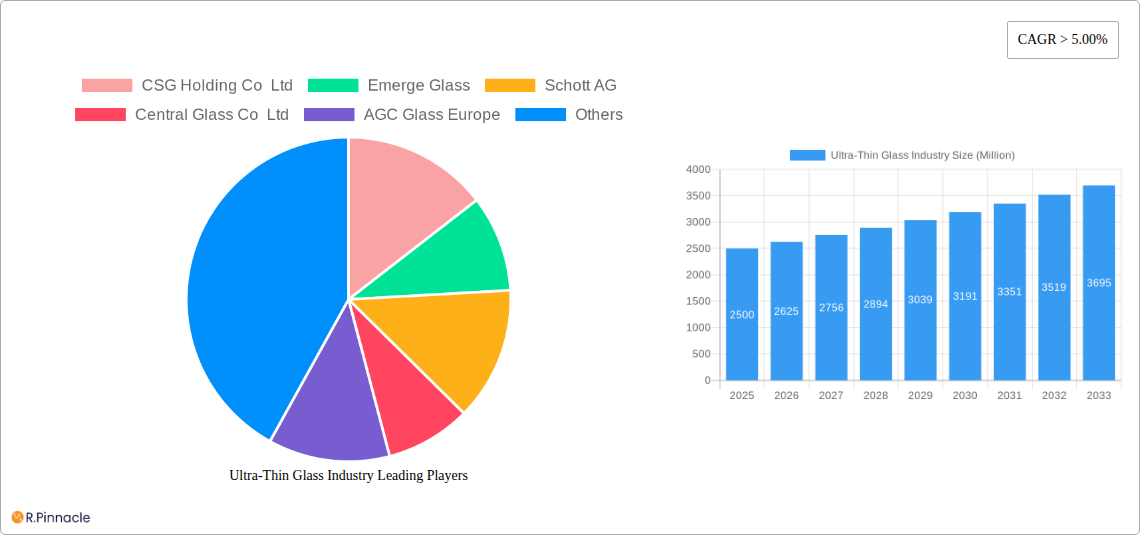
Ultra-Thin Glass Industry Market Size (In Billion)
The competitive landscape is characterized by both established players like Corning Incorporated, Schott AG, and AGC Glass Europe, and emerging companies focusing on specialized applications. Innovation in glass composition and manufacturing processes is crucial for maintaining a competitive edge. Future growth is projected to be propelled by advancements in flexible electronics, foldable displays, and the increasing integration of smart technologies in automobiles and other consumer products. The market's expansion is expected to be consistent, with the CAGR of 5% suggesting a steady increase in demand over the forecast period, influenced by sustained technological advancements and the expanding applications of ultra-thin glass across various industries. Regional variations in growth rates will depend upon the pace of technological adoption and economic development within each region.
Ultra-Thin Glass Industry Company Market Share
Ultra-Thin Glass Industry Market Report: 2019-2033
This comprehensive report provides a detailed analysis of the ultra-thin glass industry, offering invaluable insights for industry professionals, investors, and strategic decision-makers. The study period spans 2019-2033, with a base year of 2025 and a forecast period of 2025-2033. The report leverages extensive primary and secondary research to deliver a precise understanding of market dynamics, competitive landscape, and future growth trajectories. The market is estimated to reach xx Million by 2025 and is projected to experience significant growth over the forecast period.
Ultra-Thin Glass Industry Market Structure & Innovation Trends
This section analyzes the ultra-thin glass market structure, identifying key players and their market share. The report examines innovation drivers such as advancements in manufacturing techniques and the rising demand for flexible and durable glass in various applications. The influence of regulatory frameworks, the presence of substitute products, and end-user demographics are also thoroughly investigated. Furthermore, the report delves into M&A activities within the industry, analyzing deal values and their impact on market consolidation.
- Market Concentration: The ultra-thin glass market is moderately concentrated, with key players such as Corning Incorporated, AGC Glass Europe, and Schott AG holding significant market share. However, several smaller players also contribute to the overall market dynamics. The precise market share of each company is detailed in the full report.
- Innovation Drivers: Key drivers include advancements in chemical strengthening techniques (e.g., ion-exchange), the development of flexible glass, and the exploration of new materials for enhanced optical properties and durability.
- M&A Activity: Over the historical period (2019-2024), the total value of M&A deals within the ultra-thin glass sector is estimated at xx Million. These transactions have primarily focused on expanding production capacity, acquiring specialized technologies, and broadening market access.
Ultra-Thin Glass Industry Market Dynamics & Trends
This section provides a detailed analysis of the factors driving market growth, technological disruptions, evolving consumer preferences, and competitive dynamics within the ultra-thin glass industry. The report highlights significant trends such as the increasing adoption of ultra-thin glass in consumer electronics, automotive, and biotechnology applications, as well as the challenges posed by emerging technologies and competitive pressures. The CAGR for the forecast period (2025-2033) is projected to be xx%. Market penetration rates are analyzed across various segments and regions.
Dominant Regions & Segments in Ultra-Thin Glass Industry
This section identifies the leading regions and segments within the ultra-thin glass market. It provides a detailed analysis of the factors driving market dominance in each region and segment.
Dominant Regions: Asia-Pacific is anticipated to be the leading region due to its high concentration of consumer electronics and automotive manufacturing. (Further regional breakdown is available in the full report)
Dominant Segments:
Application: Semiconductor substrate is predicted to be the largest segment, driven by the growing demand for advanced semiconductor devices. Touch panel displays and automotive glazing are also significant segments, reflecting the industry's widespread adoption across numerous applications.
End-User Industry: Consumer electronics is a key driver, fuelled by the increasing demand for smartphones, tablets, and other portable devices incorporating ultra-thin glass. The automotive industry is also a major segment, driven by the growing demand for advanced driver-assistance systems and enhanced vehicle aesthetics.
Key Drivers (Examples):
- Asia-Pacific: Rapid economic growth, expansion of the consumer electronics and automotive industries, and favorable government policies supporting technological advancements.
- Semiconductor Substrate Segment: Growing demand for high-performance semiconductors, miniaturization trends in electronics, and investments in advanced manufacturing facilities.
Ultra-Thin Glass Industry Product Innovations
Recent advancements in ultra-thin glass technology have focused on enhancing flexibility, durability, and optical properties. Innovations include the development of new manufacturing processes for creating thinner and more robust glass, as well as the integration of features like self-healing and improved scratch resistance. These developments cater to the increasing demands for lighter, more efficient, and aesthetically pleasing devices across diverse applications. The market is witnessing a growing adoption of flexible ultra-thin glass, driving significant growth and innovation in areas such as foldable smartphones and flexible displays.
Report Scope & Segmentation Analysis
This report comprehensively segments the ultra-thin glass market based on application (Semiconductor Substrate, Touch Panel Displays, Fingerprint Sensors, Automotive Glazing, Other Applications) and end-user industry (Consumer Electronics, Automotive, Biotechnology, Other End-user Industries). Each segment's growth projections, market size, and competitive dynamics are thoroughly analyzed. The report provides detailed market size data for each segment for the historical period (2019-2024), the estimated year (2025), and the forecast period (2025-2033).
Key Drivers of Ultra-Thin Glass Industry Growth
The ultra-thin glass market is propelled by several factors: the increasing demand for lightweight and durable materials in consumer electronics, the growth of the automotive industry and its demand for advanced glazing technologies, and advancements in manufacturing processes enabling the production of thinner and more flexible glass. Stringent environmental regulations are also pushing the adoption of energy-efficient glass solutions.
Challenges in the Ultra-Thin Glass Industry Sector
The ultra-thin glass industry faces challenges such as the high cost of production, the complexities of handling extremely fragile materials, and the need for specialized equipment and expertise. Supply chain disruptions and the intense competition among key players also impact profitability and market share. Moreover, fluctuations in raw material prices pose significant challenges to the sector.
Emerging Opportunities in Ultra-Thin Glass Industry
Significant opportunities exist in emerging applications of ultra-thin glass, including flexible displays, foldable electronics, and advanced sensor technologies. The increasing demand for energy-efficient buildings and vehicles opens up avenues for energy-saving glass solutions. Furthermore, exploring novel materials and manufacturing techniques promises further market expansion and innovation.
Leading Players in the Ultra-Thin Glass Industry Market
- CSG Holding Co Ltd
- Emerge Glass
- Schott AG
- Central Glass Co Ltd
- AGC Glass Europe
- Taiwan Glass Industry Corporation
- Novalglass
- Fraunhofer FEP
- Nitto Boseki Co Ltd
- Changzhou Almaden Co Ltd
- Nippon Electric Glass Co Ltd
- Corning Incorporated
Key Developments in Ultra-Thin Glass Industry
- 2022 Q4: AGC Glass Europe launched a new range of ultra-thin glass designed for foldable smartphones.
- 2023 Q1: Corning Incorporated announced a significant investment in its ultra-thin glass production facilities. (Further developments are detailed in the full report)
Future Outlook for Ultra-Thin Glass Industry Market
The ultra-thin glass market is poised for robust growth, driven by technological advancements, increasing demand from diverse sectors, and the development of new applications. Strategic investments in research and development, coupled with partnerships and collaborations across the value chain, will be crucial for companies to capitalize on the substantial market potential and secure a competitive advantage.
Ultra-Thin Glass Industry Segmentation
-
1. Application
- 1.1. Semiconductor Substrate
- 1.2. Touch Panel Displays
- 1.3. Fingerprint Sensors
- 1.4. Automotive Glazing
- 1.5. Other Applications
-
2. End-user Industry
- 2.1. Consumer Electronics
- 2.2. Automotive
- 2.3. Biotechnology
- 2.4. Other End-user Industries
Ultra-Thin Glass Industry Segmentation By Geography
-
1. Asia Pacific
- 1.1. China
- 1.2. India
- 1.3. Japan
- 1.4. South Korea
- 1.5. Rest of Asia Pacific
-
2. North America
- 2.1. United States
- 2.2. Canada
- 2.3. Mexico
-
3. Europe
- 3.1. Germany
- 3.2. United Kingdom
- 3.3. France
- 3.4. Italy
- 3.5. Rest of Europe
-
4. South America
- 4.1. Brazil
- 4.2. Argentina
- 4.3. Rest of South America
-
5. Middle East and Africa
- 5.1. Saudi Arabia
- 5.2. South Africa
- 5.3. Rest of Middle East and Africa
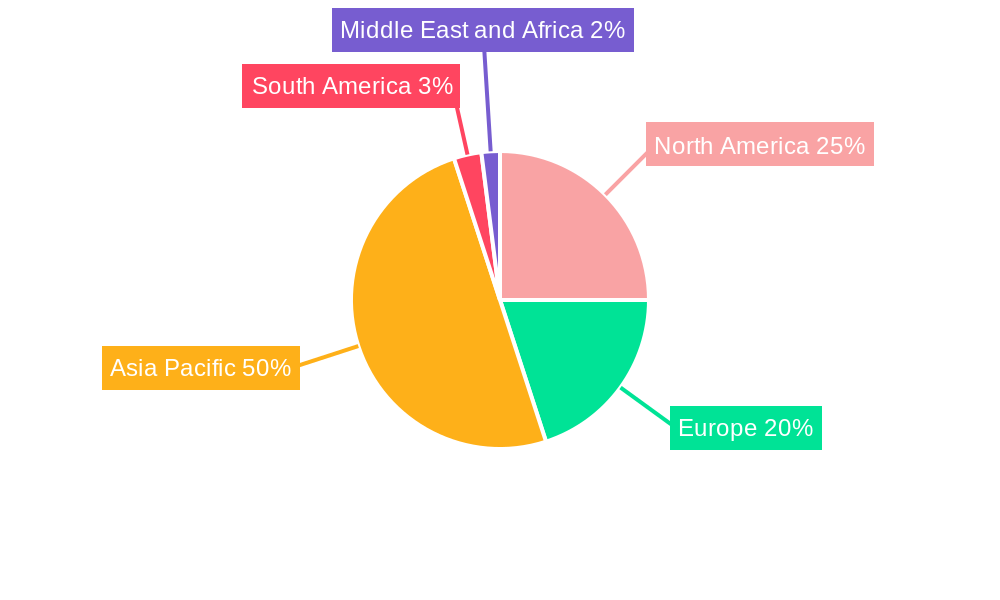
Ultra-Thin Glass Industry Regional Market Share
Geographic Coverage of Ultra-Thin Glass Industry
Ultra-Thin Glass Industry REPORT HIGHLIGHTS
| Aspects | Details |
|---|---|
| Study Period | 2020-2034 |
| Base Year | 2025 |
| Estimated Year | 2026 |
| Forecast Period | 2026-2034 |
| Historical Period | 2020-2025 |
| Growth Rate | CAGR of 9.7% from 2020-2034 |
| Segmentation |
|
Table of Contents
- 1. Introduction
- 1.1. Research Scope
- 1.2. Market Segmentation
- 1.3. Research Objective
- 1.4. Definitions and Assumptions
- 2. Executive Summary
- 2.1. Market Snapshot
- 3. Market Dynamics
- 3.1. Market Drivers
- 3.2. Market Restrains
- 3.3. Market Trends
- 3.4. Market Opportunities
- 4. Market Factor Analysis
- 4.1. Porters Five Forces
- 4.1.1. Bargaining Power of Suppliers
- 4.1.2. Bargaining Power of Buyers
- 4.1.3. Threat of New Entrants
- 4.1.4. Threat of Substitutes
- 4.1.5. Competitive Rivalry
- 4.2. PESTEL analysis
- 4.3. BCG Analysis
- 4.3.1. Stars (High Growth, High Market Share)
- 4.3.2. Cash Cows (Low Growth, High Market Share)
- 4.3.3. Question Mark (High Growth, Low Market Share)
- 4.3.4. Dogs (Low Growth, Low Market Share)
- 4.4. Ansoff Matrix Analysis
- 4.5. Supply Chain Analysis
- 4.6. Regulatory Landscape
- 4.7. Current Market Potential and Opportunity Assessment (TAM–SAM–SOM Framework)
- 4.8. PRI Analyst Note
- 4.1. Porters Five Forces
- 5. Market Analysis, Insights and Forecast 2021-2033
- 5.1. Market Analysis, Insights and Forecast - by Application
- 5.1.1. Semiconductor Substrate
- 5.1.2. Touch Panel Displays
- 5.1.3. Fingerprint Sensors
- 5.1.4. Automotive Glazing
- 5.1.5. Other Applications
- 5.2. Market Analysis, Insights and Forecast - by End-user Industry
- 5.2.1. Consumer Electronics
- 5.2.2. Automotive
- 5.2.3. Biotechnology
- 5.2.4. Other End-user Industries
- 5.3. Market Analysis, Insights and Forecast - by Region
- 5.3.1. Asia Pacific
- 5.3.2. North America
- 5.3.3. Europe
- 5.3.4. South America
- 5.3.5. Middle East and Africa
- 5.1. Market Analysis, Insights and Forecast - by Application
- 6. Global Ultra-Thin Glass Industry Analysis, Insights and Forecast, 2021-2033
- 6.1. Market Analysis, Insights and Forecast - by Application
- 6.1.1. Semiconductor Substrate
- 6.1.2. Touch Panel Displays
- 6.1.3. Fingerprint Sensors
- 6.1.4. Automotive Glazing
- 6.1.5. Other Applications
- 6.2. Market Analysis, Insights and Forecast - by End-user Industry
- 6.2.1. Consumer Electronics
- 6.2.2. Automotive
- 6.2.3. Biotechnology
- 6.2.4. Other End-user Industries
- 6.1. Market Analysis, Insights and Forecast - by Application
- 7. Asia Pacific Ultra-Thin Glass Industry Analysis, Insights and Forecast, 2020-2032
- 7.1. Market Analysis, Insights and Forecast - by Application
- 7.1.1. Semiconductor Substrate
- 7.1.2. Touch Panel Displays
- 7.1.3. Fingerprint Sensors
- 7.1.4. Automotive Glazing
- 7.1.5. Other Applications
- 7.2. Market Analysis, Insights and Forecast - by End-user Industry
- 7.2.1. Consumer Electronics
- 7.2.2. Automotive
- 7.2.3. Biotechnology
- 7.2.4. Other End-user Industries
- 7.1. Market Analysis, Insights and Forecast - by Application
- 8. North America Ultra-Thin Glass Industry Analysis, Insights and Forecast, 2020-2032
- 8.1. Market Analysis, Insights and Forecast - by Application
- 8.1.1. Semiconductor Substrate
- 8.1.2. Touch Panel Displays
- 8.1.3. Fingerprint Sensors
- 8.1.4. Automotive Glazing
- 8.1.5. Other Applications
- 8.2. Market Analysis, Insights and Forecast - by End-user Industry
- 8.2.1. Consumer Electronics
- 8.2.2. Automotive
- 8.2.3. Biotechnology
- 8.2.4. Other End-user Industries
- 8.1. Market Analysis, Insights and Forecast - by Application
- 9. Europe Ultra-Thin Glass Industry Analysis, Insights and Forecast, 2020-2032
- 9.1. Market Analysis, Insights and Forecast - by Application
- 9.1.1. Semiconductor Substrate
- 9.1.2. Touch Panel Displays
- 9.1.3. Fingerprint Sensors
- 9.1.4. Automotive Glazing
- 9.1.5. Other Applications
- 9.2. Market Analysis, Insights and Forecast - by End-user Industry
- 9.2.1. Consumer Electronics
- 9.2.2. Automotive
- 9.2.3. Biotechnology
- 9.2.4. Other End-user Industries
- 9.1. Market Analysis, Insights and Forecast - by Application
- 10. South America Ultra-Thin Glass Industry Analysis, Insights and Forecast, 2020-2032
- 10.1. Market Analysis, Insights and Forecast - by Application
- 10.1.1. Semiconductor Substrate
- 10.1.2. Touch Panel Displays
- 10.1.3. Fingerprint Sensors
- 10.1.4. Automotive Glazing
- 10.1.5. Other Applications
- 10.2. Market Analysis, Insights and Forecast - by End-user Industry
- 10.2.1. Consumer Electronics
- 10.2.2. Automotive
- 10.2.3. Biotechnology
- 10.2.4. Other End-user Industries
- 10.1. Market Analysis, Insights and Forecast - by Application
- 11. Middle East and Africa Ultra-Thin Glass Industry Analysis, Insights and Forecast, 2020-2032
- 11.1. Market Analysis, Insights and Forecast - by Application
- 11.1.1. Semiconductor Substrate
- 11.1.2. Touch Panel Displays
- 11.1.3. Fingerprint Sensors
- 11.1.4. Automotive Glazing
- 11.1.5. Other Applications
- 11.2. Market Analysis, Insights and Forecast - by End-user Industry
- 11.2.1. Consumer Electronics
- 11.2.2. Automotive
- 11.2.3. Biotechnology
- 11.2.4. Other End-user Industries
- 11.1. Market Analysis, Insights and Forecast - by Application
- 12. Competitive Analysis
- 12.1. Company Profiles
- 12.1.1 CSG Holding Co Ltd
- 12.1.1.1. Company Overview
- 12.1.1.2. Products
- 12.1.1.3. Company Financials
- 12.1.1.4. SWOT Analysis
- 12.1.2 Emerge Glass
- 12.1.2.1. Company Overview
- 12.1.2.2. Products
- 12.1.2.3. Company Financials
- 12.1.2.4. SWOT Analysis
- 12.1.3 Schott AG
- 12.1.3.1. Company Overview
- 12.1.3.2. Products
- 12.1.3.3. Company Financials
- 12.1.3.4. SWOT Analysis
- 12.1.4 Central Glass Co Ltd
- 12.1.4.1. Company Overview
- 12.1.4.2. Products
- 12.1.4.3. Company Financials
- 12.1.4.4. SWOT Analysis
- 12.1.5 AGC Glass Europe
- 12.1.5.1. Company Overview
- 12.1.5.2. Products
- 12.1.5.3. Company Financials
- 12.1.5.4. SWOT Analysis
- 12.1.6 Taiwan Glass Industry Corporation*List Not Exhaustive
- 12.1.6.1. Company Overview
- 12.1.6.2. Products
- 12.1.6.3. Company Financials
- 12.1.6.4. SWOT Analysis
- 12.1.7 Novalglass
- 12.1.7.1. Company Overview
- 12.1.7.2. Products
- 12.1.7.3. Company Financials
- 12.1.7.4. SWOT Analysis
- 12.1.8 Fraunhofer FEP
- 12.1.8.1. Company Overview
- 12.1.8.2. Products
- 12.1.8.3. Company Financials
- 12.1.8.4. SWOT Analysis
- 12.1.9 Nitto Boseki Co Ltd
- 12.1.9.1. Company Overview
- 12.1.9.2. Products
- 12.1.9.3. Company Financials
- 12.1.9.4. SWOT Analysis
- 12.1.10 Changzhou Almaden Co Ltd
- 12.1.10.1. Company Overview
- 12.1.10.2. Products
- 12.1.10.3. Company Financials
- 12.1.10.4. SWOT Analysis
- 12.1.11 Nippon Electric Glass Co Ltd
- 12.1.11.1. Company Overview
- 12.1.11.2. Products
- 12.1.11.3. Company Financials
- 12.1.11.4. SWOT Analysis
- 12.1.12 Corning Incorporated
- 12.1.12.1. Company Overview
- 12.1.12.2. Products
- 12.1.12.3. Company Financials
- 12.1.12.4. SWOT Analysis
- 12.1.1 CSG Holding Co Ltd
- 12.2. Market Entropy
- 12.2.1 Company's Key Areas Served
- 12.2.2 Recent Developments
- 12.3. Company Market Share Analysis 2025
- 12.3.1 Top 5 Companies Market Share Analysis
- 12.3.2 Top 3 Companies Market Share Analysis
- 12.4. List of Potential Customers
- 13. Research Methodology
List of Figures
- Figure 1: Global Ultra-Thin Glass Industry Revenue Breakdown (billion, %) by Region 2025 & 2033
- Figure 2: Asia Pacific Ultra-Thin Glass Industry Revenue (billion), by Application 2025 & 2033
- Figure 3: Asia Pacific Ultra-Thin Glass Industry Revenue Share (%), by Application 2025 & 2033
- Figure 4: Asia Pacific Ultra-Thin Glass Industry Revenue (billion), by End-user Industry 2025 & 2033
- Figure 5: Asia Pacific Ultra-Thin Glass Industry Revenue Share (%), by End-user Industry 2025 & 2033
- Figure 6: Asia Pacific Ultra-Thin Glass Industry Revenue (billion), by Country 2025 & 2033
- Figure 7: Asia Pacific Ultra-Thin Glass Industry Revenue Share (%), by Country 2025 & 2033
- Figure 8: North America Ultra-Thin Glass Industry Revenue (billion), by Application 2025 & 2033
- Figure 9: North America Ultra-Thin Glass Industry Revenue Share (%), by Application 2025 & 2033
- Figure 10: North America Ultra-Thin Glass Industry Revenue (billion), by End-user Industry 2025 & 2033
- Figure 11: North America Ultra-Thin Glass Industry Revenue Share (%), by End-user Industry 2025 & 2033
- Figure 12: North America Ultra-Thin Glass Industry Revenue (billion), by Country 2025 & 2033
- Figure 13: North America Ultra-Thin Glass Industry Revenue Share (%), by Country 2025 & 2033
- Figure 14: Europe Ultra-Thin Glass Industry Revenue (billion), by Application 2025 & 2033
- Figure 15: Europe Ultra-Thin Glass Industry Revenue Share (%), by Application 2025 & 2033
- Figure 16: Europe Ultra-Thin Glass Industry Revenue (billion), by End-user Industry 2025 & 2033
- Figure 17: Europe Ultra-Thin Glass Industry Revenue Share (%), by End-user Industry 2025 & 2033
- Figure 18: Europe Ultra-Thin Glass Industry Revenue (billion), by Country 2025 & 2033
- Figure 19: Europe Ultra-Thin Glass Industry Revenue Share (%), by Country 2025 & 2033
- Figure 20: South America Ultra-Thin Glass Industry Revenue (billion), by Application 2025 & 2033
- Figure 21: South America Ultra-Thin Glass Industry Revenue Share (%), by Application 2025 & 2033
- Figure 22: South America Ultra-Thin Glass Industry Revenue (billion), by End-user Industry 2025 & 2033
- Figure 23: South America Ultra-Thin Glass Industry Revenue Share (%), by End-user Industry 2025 & 2033
- Figure 24: South America Ultra-Thin Glass Industry Revenue (billion), by Country 2025 & 2033
- Figure 25: South America Ultra-Thin Glass Industry Revenue Share (%), by Country 2025 & 2033
- Figure 26: Middle East and Africa Ultra-Thin Glass Industry Revenue (billion), by Application 2025 & 2033
- Figure 27: Middle East and Africa Ultra-Thin Glass Industry Revenue Share (%), by Application 2025 & 2033
- Figure 28: Middle East and Africa Ultra-Thin Glass Industry Revenue (billion), by End-user Industry 2025 & 2033
- Figure 29: Middle East and Africa Ultra-Thin Glass Industry Revenue Share (%), by End-user Industry 2025 & 2033
- Figure 30: Middle East and Africa Ultra-Thin Glass Industry Revenue (billion), by Country 2025 & 2033
- Figure 31: Middle East and Africa Ultra-Thin Glass Industry Revenue Share (%), by Country 2025 & 2033
List of Tables
- Table 1: Global Ultra-Thin Glass Industry Revenue billion Forecast, by Application 2020 & 2033
- Table 2: Global Ultra-Thin Glass Industry Revenue billion Forecast, by End-user Industry 2020 & 2033
- Table 3: Global Ultra-Thin Glass Industry Revenue billion Forecast, by Region 2020 & 2033
- Table 4: Global Ultra-Thin Glass Industry Revenue billion Forecast, by Application 2020 & 2033
- Table 5: Global Ultra-Thin Glass Industry Revenue billion Forecast, by End-user Industry 2020 & 2033
- Table 6: Global Ultra-Thin Glass Industry Revenue billion Forecast, by Country 2020 & 2033
- Table 7: China Ultra-Thin Glass Industry Revenue (billion) Forecast, by Application 2020 & 2033
- Table 8: India Ultra-Thin Glass Industry Revenue (billion) Forecast, by Application 2020 & 2033
- Table 9: Japan Ultra-Thin Glass Industry Revenue (billion) Forecast, by Application 2020 & 2033
- Table 10: South Korea Ultra-Thin Glass Industry Revenue (billion) Forecast, by Application 2020 & 2033
- Table 11: Rest of Asia Pacific Ultra-Thin Glass Industry Revenue (billion) Forecast, by Application 2020 & 2033
- Table 12: Global Ultra-Thin Glass Industry Revenue billion Forecast, by Application 2020 & 2033
- Table 13: Global Ultra-Thin Glass Industry Revenue billion Forecast, by End-user Industry 2020 & 2033
- Table 14: Global Ultra-Thin Glass Industry Revenue billion Forecast, by Country 2020 & 2033
- Table 15: United States Ultra-Thin Glass Industry Revenue (billion) Forecast, by Application 2020 & 2033
- Table 16: Canada Ultra-Thin Glass Industry Revenue (billion) Forecast, by Application 2020 & 2033
- Table 17: Mexico Ultra-Thin Glass Industry Revenue (billion) Forecast, by Application 2020 & 2033
- Table 18: Global Ultra-Thin Glass Industry Revenue billion Forecast, by Application 2020 & 2033
- Table 19: Global Ultra-Thin Glass Industry Revenue billion Forecast, by End-user Industry 2020 & 2033
- Table 20: Global Ultra-Thin Glass Industry Revenue billion Forecast, by Country 2020 & 2033
- Table 21: Germany Ultra-Thin Glass Industry Revenue (billion) Forecast, by Application 2020 & 2033
- Table 22: United Kingdom Ultra-Thin Glass Industry Revenue (billion) Forecast, by Application 2020 & 2033
- Table 23: France Ultra-Thin Glass Industry Revenue (billion) Forecast, by Application 2020 & 2033
- Table 24: Italy Ultra-Thin Glass Industry Revenue (billion) Forecast, by Application 2020 & 2033
- Table 25: Rest of Europe Ultra-Thin Glass Industry Revenue (billion) Forecast, by Application 2020 & 2033
- Table 26: Global Ultra-Thin Glass Industry Revenue billion Forecast, by Application 2020 & 2033
- Table 27: Global Ultra-Thin Glass Industry Revenue billion Forecast, by End-user Industry 2020 & 2033
- Table 28: Global Ultra-Thin Glass Industry Revenue billion Forecast, by Country 2020 & 2033
- Table 29: Brazil Ultra-Thin Glass Industry Revenue (billion) Forecast, by Application 2020 & 2033
- Table 30: Argentina Ultra-Thin Glass Industry Revenue (billion) Forecast, by Application 2020 & 2033
- Table 31: Rest of South America Ultra-Thin Glass Industry Revenue (billion) Forecast, by Application 2020 & 2033
- Table 32: Global Ultra-Thin Glass Industry Revenue billion Forecast, by Application 2020 & 2033
- Table 33: Global Ultra-Thin Glass Industry Revenue billion Forecast, by End-user Industry 2020 & 2033
- Table 34: Global Ultra-Thin Glass Industry Revenue billion Forecast, by Country 2020 & 2033
- Table 35: Saudi Arabia Ultra-Thin Glass Industry Revenue (billion) Forecast, by Application 2020 & 2033
- Table 36: South Africa Ultra-Thin Glass Industry Revenue (billion) Forecast, by Application 2020 & 2033
- Table 37: Rest of Middle East and Africa Ultra-Thin Glass Industry Revenue (billion) Forecast, by Application 2020 & 2033
Frequently Asked Questions
1. What is the projected Compound Annual Growth Rate (CAGR) of the Ultra-Thin Glass Industry?
The projected CAGR is approximately 9.7%.
2. Which companies are prominent players in the Ultra-Thin Glass Industry?
Key companies in the market include CSG Holding Co Ltd, Emerge Glass, Schott AG, Central Glass Co Ltd, AGC Glass Europe, Taiwan Glass Industry Corporation*List Not Exhaustive, Novalglass, Fraunhofer FEP, Nitto Boseki Co Ltd, Changzhou Almaden Co Ltd, Nippon Electric Glass Co Ltd, Corning Incorporated.
3. What are the main segments of the Ultra-Thin Glass Industry?
The market segments include Application, End-user Industry.
4. Can you provide details about the market size?
The market size is estimated to be USD 21.7 billion as of 2022.
5. What are some drivers contributing to market growth?
; Growing Demand from Consumer Electronics; Other Drivers.
6. What are the notable trends driving market growth?
Growing Demand from Consumer Electronics.
7. Are there any restraints impacting market growth?
; High Cost of Raw Materials; Other Restraints.
8. Can you provide examples of recent developments in the market?
N/A
9. What pricing options are available for accessing the report?
Pricing options include single-user, multi-user, and enterprise licenses priced at USD 4750, USD 5250, and USD 8750 respectively.
10. Is the market size provided in terms of value or volume?
The market size is provided in terms of value, measured in billion.
11. Are there any specific market keywords associated with the report?
Yes, the market keyword associated with the report is "Ultra-Thin Glass Industry," which aids in identifying and referencing the specific market segment covered.
12. How do I determine which pricing option suits my needs best?
The pricing options vary based on user requirements and access needs. Individual users may opt for single-user licenses, while businesses requiring broader access may choose multi-user or enterprise licenses for cost-effective access to the report.
13. Are there any additional resources or data provided in the Ultra-Thin Glass Industry report?
While the report offers comprehensive insights, it's advisable to review the specific contents or supplementary materials provided to ascertain if additional resources or data are available.
14. How can I stay updated on further developments or reports in the Ultra-Thin Glass Industry?
To stay informed about further developments, trends, and reports in the Ultra-Thin Glass Industry, consider subscribing to industry newsletters, following relevant companies and organizations, or regularly checking reputable industry news sources and publications.
Methodology
Step 1 - Identification of Relevant Samples Size from Population Database


Step 2 - Approaches for Defining Global Market Size (Value, Volume* & Price*)

Note*: In applicable scenarios
Step 3 - Data Sources
Primary Research
- Web Analytics
- Survey Reports
- Research Institute
- Latest Research Reports
- Opinion Leaders
Secondary Research
- Annual Reports
- White Paper
- Latest Press Release
- Industry Association
- Paid Database
- Investor Presentations

Step 4 - Data Triangulation
Involves using different sources of information in order to increase the validity of a study
These sources are likely to be stakeholders in a program - participants, other researchers, program staff, other community members, and so on.
Then we put all data in single framework & apply various statistical tools to find out the dynamic on the market.
During the analysis stage, feedback from the stakeholder groups would be compared to determine areas of agreement as well as areas of divergence