

Key Insights
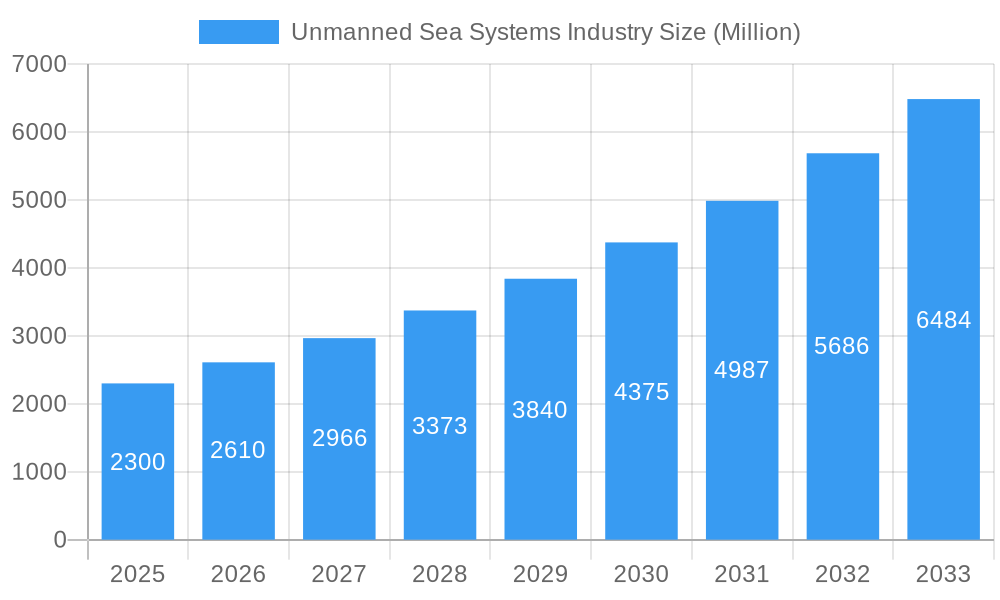
The Unmanned Sea Systems (USS) industry is experiencing robust growth, projected to reach a market size of $2.3 billion in 2025 and maintain a Compound Annual Growth Rate (CAGR) of 13.78% from 2025 to 2033. This expansion is driven by several key factors. Increased demand for maritime surveillance and security, particularly in coastal regions and exclusive economic zones (EEZs), fuels the adoption of autonomous underwater vehicles (AUVs) and unmanned surface vessels (USVs). Furthermore, the rising need for efficient and cost-effective solutions for tasks such as underwater inspection, oceanographic research, and mine countermeasures (MCM) is boosting market growth. Technological advancements, including improved sensor technology, enhanced autonomy, and more sophisticated communication systems, are also contributing to this expansion. The industry is seeing increasing diversification of applications, from defense and security to commercial applications like offshore energy exploration and environmental monitoring. This broader adoption contributes to the overall market expansion.
Unmanned Sea Systems Industry Market Size (In Billion)
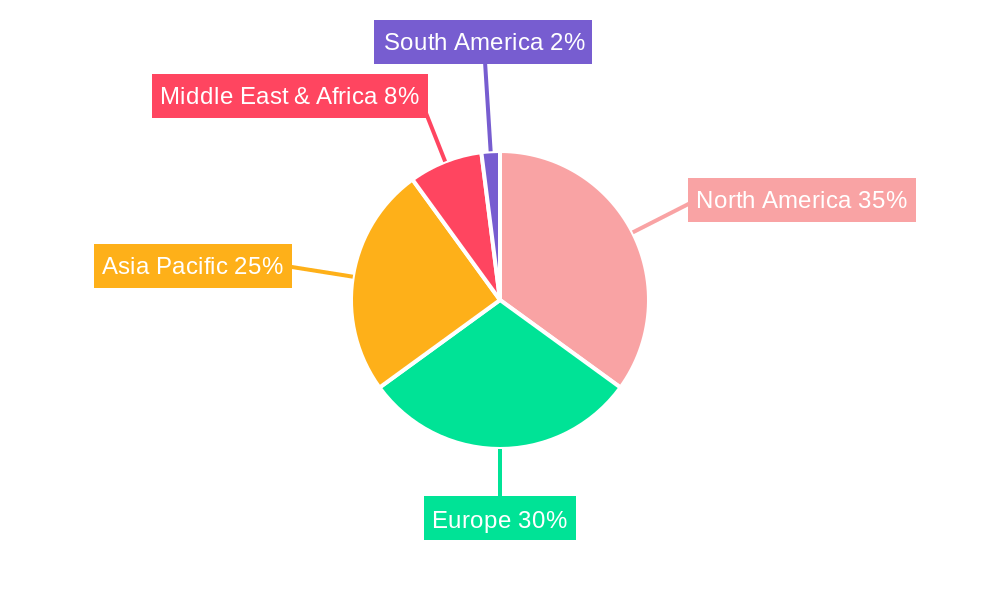
The geographical distribution of the USS market reflects global maritime security concerns and technological development hubs. North America and Europe currently hold significant market shares, driven by robust defense budgets and advanced technological capabilities. However, the Asia-Pacific region is witnessing rapid growth, fueled by increasing investments in maritime infrastructure and security in countries like China, India, and Japan. The competitive landscape is characterized by a mix of large multinational defense contractors and specialized technology companies. Companies like L3Harris Technologies, General Dynamics, and Boeing are major players, alongside specialized firms focusing on specific segments of the USS market. The ongoing integration of artificial intelligence (AI) and machine learning (ML) into USS systems promises further advancements in autonomy, operational efficiency, and data analysis capabilities, paving the way for continued market expansion in the coming years.
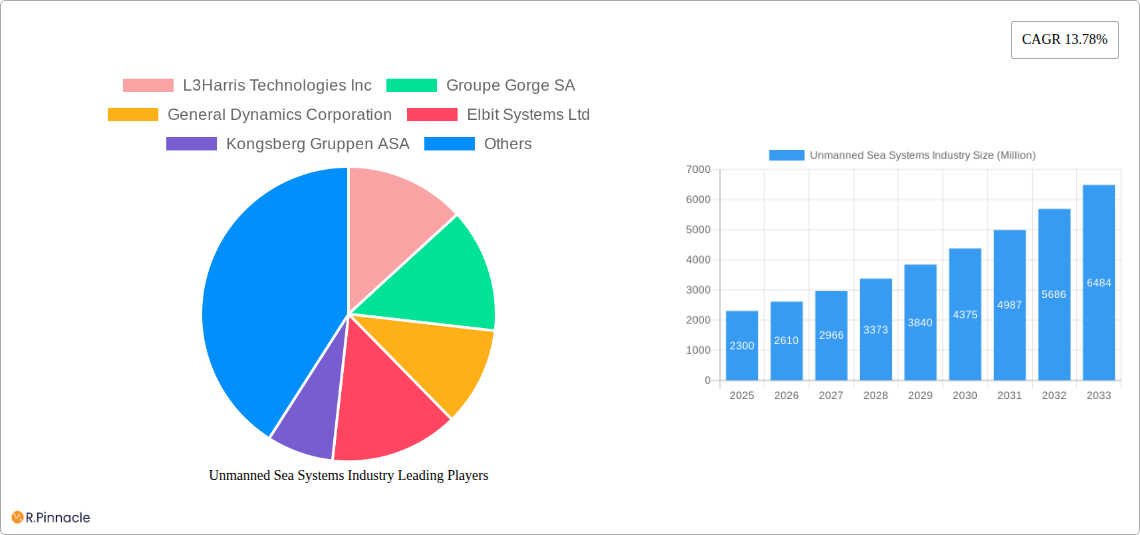
Unmanned Sea Systems Industry Company Market Share
Unmanned Sea Systems Industry Market Report: 2019-2033
This comprehensive report provides an in-depth analysis of the Unmanned Sea Systems (USS) industry, offering valuable insights for industry professionals, investors, and strategic decision-makers. Covering the period from 2019 to 2033, with a base year of 2025 and a forecast period of 2025-2033, this report meticulously examines market dynamics, technological advancements, and competitive landscapes to provide a holistic understanding of this rapidly evolving sector. The report projects a market size exceeding XX Million by 2033, fueled by significant technological breakthroughs and increasing defense budgets globally.
Unmanned Sea Systems Industry Market Structure & Innovation Trends
The Unmanned Sea Systems market exhibits a moderately concentrated structure, with key players like L3Harris Technologies Inc, Groupe Gorge SA, General Dynamics Corporation, Elbit Systems Ltd, Kongsberg Gruppen ASA, Lockheed Martin Corporation, Maritime Robotics AS, Teledyne Technologies Incorporated, thyssenkrupp AG, BAE Systems plc, Saab AB, and The Boeing Company holding significant market share. Precise market share data for each company will be detailed in the full report. Innovation is driven by advancements in autonomous navigation, sensor technologies, and underwater communication systems. Stringent regulatory frameworks concerning data security and operational safety influence market dynamics. Product substitutes, such as traditional manned vessels, are gradually losing market share due to the cost-effectiveness and operational advantages of USS. End-user demographics include military forces, research institutions, and commercial entities across various sectors such as offshore energy, maritime surveillance, and oceanographic research. M&A activity in this space has been notable, with deal values exceeding XX Million in recent years. Several examples of these transactions, along with their financial implications, are fully detailed in the report.
- Market Concentration: Moderate, with top players holding significant but not dominant shares.
- Innovation Drivers: Autonomous navigation, advanced sensor technology, improved underwater communication.
- Regulatory Landscape: Stringent regulations regarding data security and operational safety.
- M&A Activity: Significant activity observed in recent years, with transaction values in the XX Million range.
Unmanned Sea Systems Industry Market Dynamics & Trends
The Unmanned Sea Systems market is experiencing robust growth, driven by escalating demand for cost-effective and efficient maritime operations, coupled with technological advancements that enhance capabilities and reduce operational risks. The market’s Compound Annual Growth Rate (CAGR) is projected to be XX% during the forecast period (2025-2033). This growth is fuelled by increasing government investments in defense and security, coupled with the growing adoption of USS in commercial sectors such as offshore oil & gas exploration and maritime surveillance. Technological disruptions, including the introduction of AI-powered systems and enhanced sensor technologies, further propel market growth. Consumer preferences are shifting towards more sophisticated systems with enhanced autonomy, payload capacity, and operational range. Competitive dynamics are characterized by intense R&D investment and strategic partnerships among key players, driving innovation and market penetration. Market penetration is expected to reach XX% by 2033.
Dominant Regions & Segments in Unmanned Sea Systems Industry
The full report will detail regional and segment dominance through in-depth analysis of production, consumption, import/export data (value and volume), and price trends. However, preliminary findings suggest North America and Europe are currently leading the market due to strong government support, high technological capabilities, and robust defense budgets. Key drivers contributing to regional dominance include favorable economic policies, well-developed infrastructure for research and development, and a high concentration of key players. Specific segment dominance, pertaining to types of unmanned sea systems (e.g., UUVs, AUVs, USVs), will be analyzed extensively in the full report.
- Leading Region: North America and Europe.
- Key Regional Drivers: Robust defense budgets, supportive government policies, strong R&D infrastructure, high concentration of leading players.
Unmanned Sea Systems Industry Product Innovations
Recent advancements in unmanned sea systems include the development of more autonomous, AI-powered systems with increased endurance and payload capacity. These innovations cater to diverse applications across military and commercial sectors, enhancing operational efficiency, reducing risks, and enabling the exploration of previously inaccessible environments. This leads to a competitive advantage based on performance, reliability, and technological superiority.
Report Scope & Segmentation Analysis
This report comprehensively segments the Unmanned Sea Systems market by product type (e.g., AUVs, UUVs, USVs), application (e.g., military, commercial), and geography (North America, Europe, Asia-Pacific, etc.). Growth projections, market sizes, and competitive dynamics will be meticulously analyzed for each segment. Further granular segmentations will be explored based on payload capacity, range, and endurance. The full report includes detailed growth projections, market size estimates, and competitive dynamics for each segment.
Key Drivers of Unmanned Sea Systems Industry Growth
The USS industry’s growth is propelled by several key factors: Increased demand for maritime security and surveillance, the rising adoption of autonomous systems in various commercial applications, advancements in sensor and communication technologies, and supportive government policies promoting the development and adoption of unmanned systems. These factors are further supported by substantial investments in R&D by both governmental and commercial entities.
Challenges in the Unmanned Sea Systems Industry Sector
Despite significant growth potential, the USS sector faces challenges such as high initial investment costs, stringent regulatory requirements that can impede market entry, the complexity of integrating different technologies, and ongoing concerns about cybersecurity and data protection. Supply chain disruptions can significantly impact production and delivery timelines. Competition from established players and new entrants also intensifies. The overall impact of these challenges is a potential slowing of market growth if not addressed effectively.
Emerging Opportunities in Unmanned Sea Systems Industry
Emerging opportunities abound in the USS market, notably in the expanding commercial applications, particularly within offshore energy, underwater infrastructure inspection, and oceanographic research. The development of more sophisticated AI-powered systems, improved battery technology for extended endurance, and robust communication technologies provide fertile ground for market expansion. New markets are also expected to emerge in areas such as environmental monitoring and underwater archaeology.
Leading Players in the Unmanned Sea Systems Industry Market
- L3Harris Technologies Inc
- Groupe Gorge SA
- General Dynamics Corporation
- Elbit Systems Ltd
- Kongsberg Gruppen ASA
- Lockheed Martin Corporation
- Maritime Robotics AS
- Teledyne Technologies Incorporated
- thyssenkrupp AG
- BAE Systems plc
- Saab AB
- The Boeing Company
Key Developments in Unmanned Sea Systems Industry
- September 2023: HII received a FAR-based contract from the US Navy for USD 19 Million with a ceiling of USD 347 Million to begin shipments of the REMUS 300 to PMS 408 by September 2024, with ongoing technology advancements and deliveries through 2028.
- October 2023: The Naval Sea Systems Command, Washington, DC, signed a modification contract with Lockheed Martin Corporation to provide engineering support for Extra Large Unmanned Undersea Vehicle (UUV). The value of the contract was USD 11 Million, and it will be completed by September 2024.
These contracts highlight the significant investments being made in the development and deployment of advanced unmanned sea systems.
Future Outlook for Unmanned Sea Systems Industry Market
The future of the Unmanned Sea Systems market appears promising. Continued technological advancements, increasing defense budgets globally, and expanding commercial applications will drive significant market growth. Strategic partnerships, further R&D investments, and the development of innovative business models will create lucrative opportunities for industry players and investors alike. The market is poised for substantial expansion over the forecast period.
Unmanned Sea Systems Industry Segmentation
- 1. Production Analysis
- 2. Consumption Analysis
- 3. Import Market Analysis (Value & Volume)
- 4. Export Market Analysis (Value & Volume)
- 5. Price Trend Analysis
Unmanned Sea Systems Industry Segmentation By Geography
-
1. North America
- 1.1. United States
- 1.2. Canada
- 1.3. Mexico
-
2. South America
- 2.1. Brazil
- 2.2. Argentina
- 2.3. Rest of South America
-
3. Europe
- 3.1. United Kingdom
- 3.2. Germany
- 3.3. France
- 3.4. Italy
- 3.5. Spain
- 3.6. Russia
- 3.7. Benelux
- 3.8. Nordics
- 3.9. Rest of Europe
-
4. Middle East & Africa
- 4.1. Turkey
- 4.2. Israel
- 4.3. GCC
- 4.4. North Africa
- 4.5. South Africa
- 4.6. Rest of Middle East & Africa
-
5. Asia Pacific
- 5.1. China
- 5.2. India
- 5.3. Japan
- 5.4. South Korea
- 5.5. ASEAN
- 5.6. Oceania
- 5.7. Rest of Asia Pacific
Unmanned Sea Systems Industry Regional Market Share
Geographic Coverage of Unmanned Sea Systems Industry
Unmanned Sea Systems Industry REPORT HIGHLIGHTS
| Aspects | Details |
|---|---|
| Study Period | 2020-2034 |
| Base Year | 2025 |
| Estimated Year | 2026 |
| Forecast Period | 2026-2034 |
| Historical Period | 2020-2025 |
| Growth Rate | CAGR of 13.78% from 2020-2034 |
| Segmentation |
|
Table of Contents
- 1. Introduction
- 1.1. Research Scope
- 1.2. Market Segmentation
- 1.3. Research Objective
- 1.4. Definitions and Assumptions
- 2. Executive Summary
- 2.1. Market Snapshot
- 3. Market Dynamics
- 3.1. Market Drivers
- 3.2. Market Restrains
- 3.3. Market Trends
- 3.4. Market Opportunities
- 4. Market Factor Analysis
- 4.1. Porters Five Forces
- 4.1.1. Bargaining Power of Suppliers
- 4.1.2. Bargaining Power of Buyers
- 4.1.3. Threat of New Entrants
- 4.1.4. Threat of Substitutes
- 4.1.5. Competitive Rivalry
- 4.2. PESTEL analysis
- 4.3. BCG Analysis
- 4.3.1. Stars (High Growth, High Market Share)
- 4.3.2. Cash Cows (Low Growth, High Market Share)
- 4.3.3. Question Mark (High Growth, Low Market Share)
- 4.3.4. Dogs (Low Growth, Low Market Share)
- 4.4. Ansoff Matrix Analysis
- 4.5. Supply Chain Analysis
- 4.6. Regulatory Landscape
- 4.7. Current Market Potential and Opportunity Assessment (TAM–SAM–SOM Framework)
- 4.8. PRI Analyst Note
- 4.1. Porters Five Forces
- 5. Market Analysis, Insights and Forecast 2021-2033
- 5.1. Market Analysis, Insights and Forecast - by Production Analysis
- 5.2. Market Analysis, Insights and Forecast - by Consumption Analysis
- 5.3. Market Analysis, Insights and Forecast - by Import Market Analysis (Value & Volume)
- 5.4. Market Analysis, Insights and Forecast - by Export Market Analysis (Value & Volume)
- 5.5. Market Analysis, Insights and Forecast - by Price Trend Analysis
- 5.6. Market Analysis, Insights and Forecast - by Region
- 5.6.1. North America
- 5.6.2. South America
- 5.6.3. Europe
- 5.6.4. Middle East & Africa
- 5.6.5. Asia Pacific
- 6. Global Unmanned Sea Systems Industry Analysis, Insights and Forecast, 2021-2033
- 6.1. Market Analysis, Insights and Forecast - by Production Analysis
- 6.2. Market Analysis, Insights and Forecast - by Consumption Analysis
- 6.3. Market Analysis, Insights and Forecast - by Import Market Analysis (Value & Volume)
- 6.4. Market Analysis, Insights and Forecast - by Export Market Analysis (Value & Volume)
- 6.5. Market Analysis, Insights and Forecast - by Price Trend Analysis
- 7. North America Unmanned Sea Systems Industry Analysis, Insights and Forecast, 2020-2032
- 7.1. Market Analysis, Insights and Forecast - by Production Analysis
- 7.2. Market Analysis, Insights and Forecast - by Consumption Analysis
- 7.3. Market Analysis, Insights and Forecast - by Import Market Analysis (Value & Volume)
- 7.4. Market Analysis, Insights and Forecast - by Export Market Analysis (Value & Volume)
- 7.5. Market Analysis, Insights and Forecast - by Price Trend Analysis
- 8. South America Unmanned Sea Systems Industry Analysis, Insights and Forecast, 2020-2032
- 8.1. Market Analysis, Insights and Forecast - by Production Analysis
- 8.2. Market Analysis, Insights and Forecast - by Consumption Analysis
- 8.3. Market Analysis, Insights and Forecast - by Import Market Analysis (Value & Volume)
- 8.4. Market Analysis, Insights and Forecast - by Export Market Analysis (Value & Volume)
- 8.5. Market Analysis, Insights and Forecast - by Price Trend Analysis
- 9. Europe Unmanned Sea Systems Industry Analysis, Insights and Forecast, 2020-2032
- 9.1. Market Analysis, Insights and Forecast - by Production Analysis
- 9.2. Market Analysis, Insights and Forecast - by Consumption Analysis
- 9.3. Market Analysis, Insights and Forecast - by Import Market Analysis (Value & Volume)
- 9.4. Market Analysis, Insights and Forecast - by Export Market Analysis (Value & Volume)
- 9.5. Market Analysis, Insights and Forecast - by Price Trend Analysis
- 10. Middle East & Africa Unmanned Sea Systems Industry Analysis, Insights and Forecast, 2020-2032
- 10.1. Market Analysis, Insights and Forecast - by Production Analysis
- 10.2. Market Analysis, Insights and Forecast - by Consumption Analysis
- 10.3. Market Analysis, Insights and Forecast - by Import Market Analysis (Value & Volume)
- 10.4. Market Analysis, Insights and Forecast - by Export Market Analysis (Value & Volume)
- 10.5. Market Analysis, Insights and Forecast - by Price Trend Analysis
- 11. Asia Pacific Unmanned Sea Systems Industry Analysis, Insights and Forecast, 2020-2032
- 11.1. Market Analysis, Insights and Forecast - by Production Analysis
- 11.2. Market Analysis, Insights and Forecast - by Consumption Analysis
- 11.3. Market Analysis, Insights and Forecast - by Import Market Analysis (Value & Volume)
- 11.4. Market Analysis, Insights and Forecast - by Export Market Analysis (Value & Volume)
- 11.5. Market Analysis, Insights and Forecast - by Price Trend Analysis
- 12. Competitive Analysis
- 12.1. Company Profiles
- 12.1.1 L3Harris Technologies Inc
- 12.1.1.1. Company Overview
- 12.1.1.2. Products
- 12.1.1.3. Company Financials
- 12.1.1.4. SWOT Analysis
- 12.1.2 Groupe Gorge SA
- 12.1.2.1. Company Overview
- 12.1.2.2. Products
- 12.1.2.3. Company Financials
- 12.1.2.4. SWOT Analysis
- 12.1.3 General Dynamics Corporation
- 12.1.3.1. Company Overview
- 12.1.3.2. Products
- 12.1.3.3. Company Financials
- 12.1.3.4. SWOT Analysis
- 12.1.4 Elbit Systems Ltd
- 12.1.4.1. Company Overview
- 12.1.4.2. Products
- 12.1.4.3. Company Financials
- 12.1.4.4. SWOT Analysis
- 12.1.5 Kongsberg Gruppen ASA
- 12.1.5.1. Company Overview
- 12.1.5.2. Products
- 12.1.5.3. Company Financials
- 12.1.5.4. SWOT Analysis
- 12.1.6 Lockheed Martin Corporation
- 12.1.6.1. Company Overview
- 12.1.6.2. Products
- 12.1.6.3. Company Financials
- 12.1.6.4. SWOT Analysis
- 12.1.7 Maritime Robotics AS
- 12.1.7.1. Company Overview
- 12.1.7.2. Products
- 12.1.7.3. Company Financials
- 12.1.7.4. SWOT Analysis
- 12.1.8 Teledyne Technologies Incorporated
- 12.1.8.1. Company Overview
- 12.1.8.2. Products
- 12.1.8.3. Company Financials
- 12.1.8.4. SWOT Analysis
- 12.1.9 thyssenkrupp AG
- 12.1.9.1. Company Overview
- 12.1.9.2. Products
- 12.1.9.3. Company Financials
- 12.1.9.4. SWOT Analysis
- 12.1.10 BAE Systems plc
- 12.1.10.1. Company Overview
- 12.1.10.2. Products
- 12.1.10.3. Company Financials
- 12.1.10.4. SWOT Analysis
- 12.1.11 Saab AB
- 12.1.11.1. Company Overview
- 12.1.11.2. Products
- 12.1.11.3. Company Financials
- 12.1.11.4. SWOT Analysis
- 12.1.12 The Boeing Company
- 12.1.12.1. Company Overview
- 12.1.12.2. Products
- 12.1.12.3. Company Financials
- 12.1.12.4. SWOT Analysis
- 12.1.1 L3Harris Technologies Inc
- 12.2. Market Entropy
- 12.2.1 Company's Key Areas Served
- 12.2.2 Recent Developments
- 12.3. Company Market Share Analysis 2025
- 12.3.1 Top 5 Companies Market Share Analysis
- 12.3.2 Top 3 Companies Market Share Analysis
- 12.4. List of Potential Customers
- 13. Research Methodology
List of Figures
- Figure 1: Global Unmanned Sea Systems Industry Revenue Breakdown (Million, %) by Region 2025 & 2033
- Figure 2: North America Unmanned Sea Systems Industry Revenue (Million), by Production Analysis 2025 & 2033
- Figure 3: North America Unmanned Sea Systems Industry Revenue Share (%), by Production Analysis 2025 & 2033
- Figure 4: North America Unmanned Sea Systems Industry Revenue (Million), by Consumption Analysis 2025 & 2033
- Figure 5: North America Unmanned Sea Systems Industry Revenue Share (%), by Consumption Analysis 2025 & 2033
- Figure 6: North America Unmanned Sea Systems Industry Revenue (Million), by Import Market Analysis (Value & Volume) 2025 & 2033
- Figure 7: North America Unmanned Sea Systems Industry Revenue Share (%), by Import Market Analysis (Value & Volume) 2025 & 2033
- Figure 8: North America Unmanned Sea Systems Industry Revenue (Million), by Export Market Analysis (Value & Volume) 2025 & 2033
- Figure 9: North America Unmanned Sea Systems Industry Revenue Share (%), by Export Market Analysis (Value & Volume) 2025 & 2033
- Figure 10: North America Unmanned Sea Systems Industry Revenue (Million), by Price Trend Analysis 2025 & 2033
- Figure 11: North America Unmanned Sea Systems Industry Revenue Share (%), by Price Trend Analysis 2025 & 2033
- Figure 12: North America Unmanned Sea Systems Industry Revenue (Million), by Country 2025 & 2033
- Figure 13: North America Unmanned Sea Systems Industry Revenue Share (%), by Country 2025 & 2033
- Figure 14: South America Unmanned Sea Systems Industry Revenue (Million), by Production Analysis 2025 & 2033
- Figure 15: South America Unmanned Sea Systems Industry Revenue Share (%), by Production Analysis 2025 & 2033
- Figure 16: South America Unmanned Sea Systems Industry Revenue (Million), by Consumption Analysis 2025 & 2033
- Figure 17: South America Unmanned Sea Systems Industry Revenue Share (%), by Consumption Analysis 2025 & 2033
- Figure 18: South America Unmanned Sea Systems Industry Revenue (Million), by Import Market Analysis (Value & Volume) 2025 & 2033
- Figure 19: South America Unmanned Sea Systems Industry Revenue Share (%), by Import Market Analysis (Value & Volume) 2025 & 2033
- Figure 20: South America Unmanned Sea Systems Industry Revenue (Million), by Export Market Analysis (Value & Volume) 2025 & 2033
- Figure 21: South America Unmanned Sea Systems Industry Revenue Share (%), by Export Market Analysis (Value & Volume) 2025 & 2033
- Figure 22: South America Unmanned Sea Systems Industry Revenue (Million), by Price Trend Analysis 2025 & 2033
- Figure 23: South America Unmanned Sea Systems Industry Revenue Share (%), by Price Trend Analysis 2025 & 2033
- Figure 24: South America Unmanned Sea Systems Industry Revenue (Million), by Country 2025 & 2033
- Figure 25: South America Unmanned Sea Systems Industry Revenue Share (%), by Country 2025 & 2033
- Figure 26: Europe Unmanned Sea Systems Industry Revenue (Million), by Production Analysis 2025 & 2033
- Figure 27: Europe Unmanned Sea Systems Industry Revenue Share (%), by Production Analysis 2025 & 2033
- Figure 28: Europe Unmanned Sea Systems Industry Revenue (Million), by Consumption Analysis 2025 & 2033
- Figure 29: Europe Unmanned Sea Systems Industry Revenue Share (%), by Consumption Analysis 2025 & 2033
- Figure 30: Europe Unmanned Sea Systems Industry Revenue (Million), by Import Market Analysis (Value & Volume) 2025 & 2033
- Figure 31: Europe Unmanned Sea Systems Industry Revenue Share (%), by Import Market Analysis (Value & Volume) 2025 & 2033
- Figure 32: Europe Unmanned Sea Systems Industry Revenue (Million), by Export Market Analysis (Value & Volume) 2025 & 2033
- Figure 33: Europe Unmanned Sea Systems Industry Revenue Share (%), by Export Market Analysis (Value & Volume) 2025 & 2033
- Figure 34: Europe Unmanned Sea Systems Industry Revenue (Million), by Price Trend Analysis 2025 & 2033
- Figure 35: Europe Unmanned Sea Systems Industry Revenue Share (%), by Price Trend Analysis 2025 & 2033
- Figure 36: Europe Unmanned Sea Systems Industry Revenue (Million), by Country 2025 & 2033
- Figure 37: Europe Unmanned Sea Systems Industry Revenue Share (%), by Country 2025 & 2033
- Figure 38: Middle East & Africa Unmanned Sea Systems Industry Revenue (Million), by Production Analysis 2025 & 2033
- Figure 39: Middle East & Africa Unmanned Sea Systems Industry Revenue Share (%), by Production Analysis 2025 & 2033
- Figure 40: Middle East & Africa Unmanned Sea Systems Industry Revenue (Million), by Consumption Analysis 2025 & 2033
- Figure 41: Middle East & Africa Unmanned Sea Systems Industry Revenue Share (%), by Consumption Analysis 2025 & 2033
- Figure 42: Middle East & Africa Unmanned Sea Systems Industry Revenue (Million), by Import Market Analysis (Value & Volume) 2025 & 2033
- Figure 43: Middle East & Africa Unmanned Sea Systems Industry Revenue Share (%), by Import Market Analysis (Value & Volume) 2025 & 2033
- Figure 44: Middle East & Africa Unmanned Sea Systems Industry Revenue (Million), by Export Market Analysis (Value & Volume) 2025 & 2033
- Figure 45: Middle East & Africa Unmanned Sea Systems Industry Revenue Share (%), by Export Market Analysis (Value & Volume) 2025 & 2033
- Figure 46: Middle East & Africa Unmanned Sea Systems Industry Revenue (Million), by Price Trend Analysis 2025 & 2033
- Figure 47: Middle East & Africa Unmanned Sea Systems Industry Revenue Share (%), by Price Trend Analysis 2025 & 2033
- Figure 48: Middle East & Africa Unmanned Sea Systems Industry Revenue (Million), by Country 2025 & 2033
- Figure 49: Middle East & Africa Unmanned Sea Systems Industry Revenue Share (%), by Country 2025 & 2033
- Figure 50: Asia Pacific Unmanned Sea Systems Industry Revenue (Million), by Production Analysis 2025 & 2033
- Figure 51: Asia Pacific Unmanned Sea Systems Industry Revenue Share (%), by Production Analysis 2025 & 2033
- Figure 52: Asia Pacific Unmanned Sea Systems Industry Revenue (Million), by Consumption Analysis 2025 & 2033
- Figure 53: Asia Pacific Unmanned Sea Systems Industry Revenue Share (%), by Consumption Analysis 2025 & 2033
- Figure 54: Asia Pacific Unmanned Sea Systems Industry Revenue (Million), by Import Market Analysis (Value & Volume) 2025 & 2033
- Figure 55: Asia Pacific Unmanned Sea Systems Industry Revenue Share (%), by Import Market Analysis (Value & Volume) 2025 & 2033
- Figure 56: Asia Pacific Unmanned Sea Systems Industry Revenue (Million), by Export Market Analysis (Value & Volume) 2025 & 2033
- Figure 57: Asia Pacific Unmanned Sea Systems Industry Revenue Share (%), by Export Market Analysis (Value & Volume) 2025 & 2033
- Figure 58: Asia Pacific Unmanned Sea Systems Industry Revenue (Million), by Price Trend Analysis 2025 & 2033
- Figure 59: Asia Pacific Unmanned Sea Systems Industry Revenue Share (%), by Price Trend Analysis 2025 & 2033
- Figure 60: Asia Pacific Unmanned Sea Systems Industry Revenue (Million), by Country 2025 & 2033
- Figure 61: Asia Pacific Unmanned Sea Systems Industry Revenue Share (%), by Country 2025 & 2033
List of Tables
- Table 1: Global Unmanned Sea Systems Industry Revenue Million Forecast, by Production Analysis 2020 & 2033
- Table 2: Global Unmanned Sea Systems Industry Revenue Million Forecast, by Consumption Analysis 2020 & 2033
- Table 3: Global Unmanned Sea Systems Industry Revenue Million Forecast, by Import Market Analysis (Value & Volume) 2020 & 2033
- Table 4: Global Unmanned Sea Systems Industry Revenue Million Forecast, by Export Market Analysis (Value & Volume) 2020 & 2033
- Table 5: Global Unmanned Sea Systems Industry Revenue Million Forecast, by Price Trend Analysis 2020 & 2033
- Table 6: Global Unmanned Sea Systems Industry Revenue Million Forecast, by Region 2020 & 2033
- Table 7: Global Unmanned Sea Systems Industry Revenue Million Forecast, by Production Analysis 2020 & 2033
- Table 8: Global Unmanned Sea Systems Industry Revenue Million Forecast, by Consumption Analysis 2020 & 2033
- Table 9: Global Unmanned Sea Systems Industry Revenue Million Forecast, by Import Market Analysis (Value & Volume) 2020 & 2033
- Table 10: Global Unmanned Sea Systems Industry Revenue Million Forecast, by Export Market Analysis (Value & Volume) 2020 & 2033
- Table 11: Global Unmanned Sea Systems Industry Revenue Million Forecast, by Price Trend Analysis 2020 & 2033
- Table 12: Global Unmanned Sea Systems Industry Revenue Million Forecast, by Country 2020 & 2033
- Table 13: United States Unmanned Sea Systems Industry Revenue (Million) Forecast, by Application 2020 & 2033
- Table 14: Canada Unmanned Sea Systems Industry Revenue (Million) Forecast, by Application 2020 & 2033
- Table 15: Mexico Unmanned Sea Systems Industry Revenue (Million) Forecast, by Application 2020 & 2033
- Table 16: Global Unmanned Sea Systems Industry Revenue Million Forecast, by Production Analysis 2020 & 2033
- Table 17: Global Unmanned Sea Systems Industry Revenue Million Forecast, by Consumption Analysis 2020 & 2033
- Table 18: Global Unmanned Sea Systems Industry Revenue Million Forecast, by Import Market Analysis (Value & Volume) 2020 & 2033
- Table 19: Global Unmanned Sea Systems Industry Revenue Million Forecast, by Export Market Analysis (Value & Volume) 2020 & 2033
- Table 20: Global Unmanned Sea Systems Industry Revenue Million Forecast, by Price Trend Analysis 2020 & 2033
- Table 21: Global Unmanned Sea Systems Industry Revenue Million Forecast, by Country 2020 & 2033
- Table 22: Brazil Unmanned Sea Systems Industry Revenue (Million) Forecast, by Application 2020 & 2033
- Table 23: Argentina Unmanned Sea Systems Industry Revenue (Million) Forecast, by Application 2020 & 2033
- Table 24: Rest of South America Unmanned Sea Systems Industry Revenue (Million) Forecast, by Application 2020 & 2033
- Table 25: Global Unmanned Sea Systems Industry Revenue Million Forecast, by Production Analysis 2020 & 2033
- Table 26: Global Unmanned Sea Systems Industry Revenue Million Forecast, by Consumption Analysis 2020 & 2033
- Table 27: Global Unmanned Sea Systems Industry Revenue Million Forecast, by Import Market Analysis (Value & Volume) 2020 & 2033
- Table 28: Global Unmanned Sea Systems Industry Revenue Million Forecast, by Export Market Analysis (Value & Volume) 2020 & 2033
- Table 29: Global Unmanned Sea Systems Industry Revenue Million Forecast, by Price Trend Analysis 2020 & 2033
- Table 30: Global Unmanned Sea Systems Industry Revenue Million Forecast, by Country 2020 & 2033
- Table 31: United Kingdom Unmanned Sea Systems Industry Revenue (Million) Forecast, by Application 2020 & 2033
- Table 32: Germany Unmanned Sea Systems Industry Revenue (Million) Forecast, by Application 2020 & 2033
- Table 33: France Unmanned Sea Systems Industry Revenue (Million) Forecast, by Application 2020 & 2033
- Table 34: Italy Unmanned Sea Systems Industry Revenue (Million) Forecast, by Application 2020 & 2033
- Table 35: Spain Unmanned Sea Systems Industry Revenue (Million) Forecast, by Application 2020 & 2033
- Table 36: Russia Unmanned Sea Systems Industry Revenue (Million) Forecast, by Application 2020 & 2033
- Table 37: Benelux Unmanned Sea Systems Industry Revenue (Million) Forecast, by Application 2020 & 2033
- Table 38: Nordics Unmanned Sea Systems Industry Revenue (Million) Forecast, by Application 2020 & 2033
- Table 39: Rest of Europe Unmanned Sea Systems Industry Revenue (Million) Forecast, by Application 2020 & 2033
- Table 40: Global Unmanned Sea Systems Industry Revenue Million Forecast, by Production Analysis 2020 & 2033
- Table 41: Global Unmanned Sea Systems Industry Revenue Million Forecast, by Consumption Analysis 2020 & 2033
- Table 42: Global Unmanned Sea Systems Industry Revenue Million Forecast, by Import Market Analysis (Value & Volume) 2020 & 2033
- Table 43: Global Unmanned Sea Systems Industry Revenue Million Forecast, by Export Market Analysis (Value & Volume) 2020 & 2033
- Table 44: Global Unmanned Sea Systems Industry Revenue Million Forecast, by Price Trend Analysis 2020 & 2033
- Table 45: Global Unmanned Sea Systems Industry Revenue Million Forecast, by Country 2020 & 2033
- Table 46: Turkey Unmanned Sea Systems Industry Revenue (Million) Forecast, by Application 2020 & 2033
- Table 47: Israel Unmanned Sea Systems Industry Revenue (Million) Forecast, by Application 2020 & 2033
- Table 48: GCC Unmanned Sea Systems Industry Revenue (Million) Forecast, by Application 2020 & 2033
- Table 49: North Africa Unmanned Sea Systems Industry Revenue (Million) Forecast, by Application 2020 & 2033
- Table 50: South Africa Unmanned Sea Systems Industry Revenue (Million) Forecast, by Application 2020 & 2033
- Table 51: Rest of Middle East & Africa Unmanned Sea Systems Industry Revenue (Million) Forecast, by Application 2020 & 2033
- Table 52: Global Unmanned Sea Systems Industry Revenue Million Forecast, by Production Analysis 2020 & 2033
- Table 53: Global Unmanned Sea Systems Industry Revenue Million Forecast, by Consumption Analysis 2020 & 2033
- Table 54: Global Unmanned Sea Systems Industry Revenue Million Forecast, by Import Market Analysis (Value & Volume) 2020 & 2033
- Table 55: Global Unmanned Sea Systems Industry Revenue Million Forecast, by Export Market Analysis (Value & Volume) 2020 & 2033
- Table 56: Global Unmanned Sea Systems Industry Revenue Million Forecast, by Price Trend Analysis 2020 & 2033
- Table 57: Global Unmanned Sea Systems Industry Revenue Million Forecast, by Country 2020 & 2033
- Table 58: China Unmanned Sea Systems Industry Revenue (Million) Forecast, by Application 2020 & 2033
- Table 59: India Unmanned Sea Systems Industry Revenue (Million) Forecast, by Application 2020 & 2033
- Table 60: Japan Unmanned Sea Systems Industry Revenue (Million) Forecast, by Application 2020 & 2033
- Table 61: South Korea Unmanned Sea Systems Industry Revenue (Million) Forecast, by Application 2020 & 2033
- Table 62: ASEAN Unmanned Sea Systems Industry Revenue (Million) Forecast, by Application 2020 & 2033
- Table 63: Oceania Unmanned Sea Systems Industry Revenue (Million) Forecast, by Application 2020 & 2033
- Table 64: Rest of Asia Pacific Unmanned Sea Systems Industry Revenue (Million) Forecast, by Application 2020 & 2033
Frequently Asked Questions
1. What is the projected Compound Annual Growth Rate (CAGR) of the Unmanned Sea Systems Industry?
The projected CAGR is approximately 13.78%.
2. Which companies are prominent players in the Unmanned Sea Systems Industry?
Key companies in the market include L3Harris Technologies Inc, Groupe Gorge SA, General Dynamics Corporation, Elbit Systems Ltd, Kongsberg Gruppen ASA, Lockheed Martin Corporation, Maritime Robotics AS, Teledyne Technologies Incorporated, thyssenkrupp AG, BAE Systems plc, Saab AB, The Boeing Company.
3. What are the main segments of the Unmanned Sea Systems Industry?
The market segments include Production Analysis, Consumption Analysis, Import Market Analysis (Value & Volume), Export Market Analysis (Value & Volume), Price Trend Analysis.
4. Can you provide details about the market size?
The market size is estimated to be USD 2.30 Million as of 2022.
5. What are some drivers contributing to market growth?
Increase in Internet of Things (IoT) and Autonomous Systems; Rise in Demand for Military and Defense Satellite Communication Solutions.
6. What are the notable trends driving market growth?
Remotely Operated Vehicles (ROVs) Segment Will Showcase Significant Growth During the Forecast Period.
7. Are there any restraints impacting market growth?
Cybersecurity Threats to Satellite Communication; Interference in Transmission of Data.
8. Can you provide examples of recent developments in the market?
October 2023: The Naval Sea Systems Command, Washington, DC, signed a modification contract with Lockheed Martin Corporation to provide engineering support for Extra Large Unmanned Undersea Vehicle (UUV). The value of the contract was USD 11 million, and it will be completed by September 2024.
9. What pricing options are available for accessing the report?
Pricing options include single-user, multi-user, and enterprise licenses priced at USD 4750, USD 5250, and USD 8750 respectively.
10. Is the market size provided in terms of value or volume?
The market size is provided in terms of value, measured in Million.
11. Are there any specific market keywords associated with the report?
Yes, the market keyword associated with the report is "Unmanned Sea Systems Industry," which aids in identifying and referencing the specific market segment covered.
12. How do I determine which pricing option suits my needs best?
The pricing options vary based on user requirements and access needs. Individual users may opt for single-user licenses, while businesses requiring broader access may choose multi-user or enterprise licenses for cost-effective access to the report.
13. Are there any additional resources or data provided in the Unmanned Sea Systems Industry report?
While the report offers comprehensive insights, it's advisable to review the specific contents or supplementary materials provided to ascertain if additional resources or data are available.
14. How can I stay updated on further developments or reports in the Unmanned Sea Systems Industry?
To stay informed about further developments, trends, and reports in the Unmanned Sea Systems Industry, consider subscribing to industry newsletters, following relevant companies and organizations, or regularly checking reputable industry news sources and publications.
Methodology
Step 1 - Identification of Relevant Samples Size from Population Database


Step 2 - Approaches for Defining Global Market Size (Value, Volume* & Price*)

Note*: In applicable scenarios
Step 3 - Data Sources
Primary Research
- Web Analytics
- Survey Reports
- Research Institute
- Latest Research Reports
- Opinion Leaders
Secondary Research
- Annual Reports
- White Paper
- Latest Press Release
- Industry Association
- Paid Database
- Investor Presentations

Step 4 - Data Triangulation
Involves using different sources of information in order to increase the validity of a study
These sources are likely to be stakeholders in a program - participants, other researchers, program staff, other community members, and so on.
Then we put all data in single framework & apply various statistical tools to find out the dynamic on the market.
During the analysis stage, feedback from the stakeholder groups would be compared to determine areas of agreement as well as areas of divergence