

Key Insights
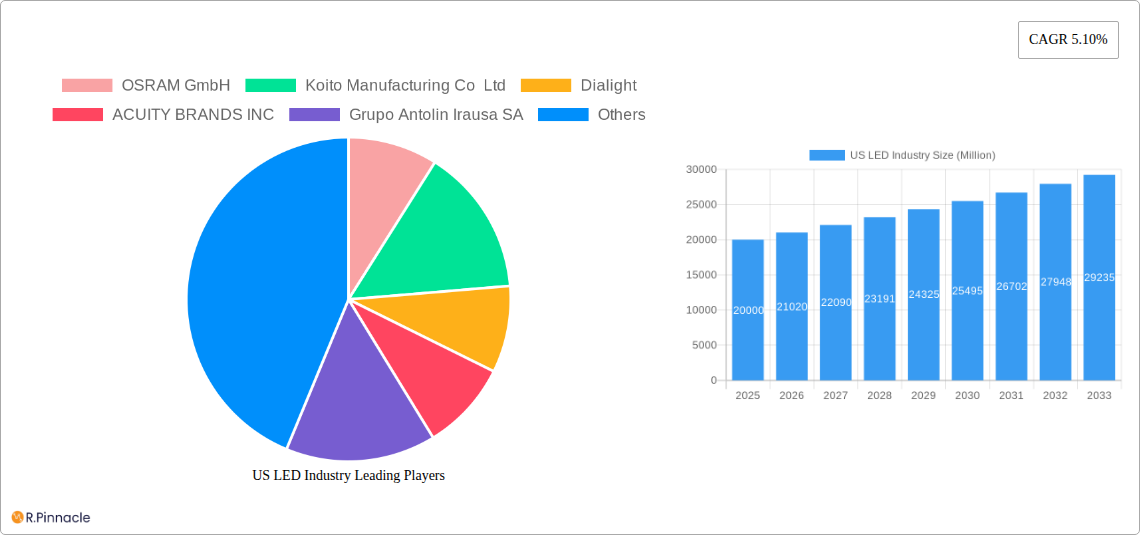
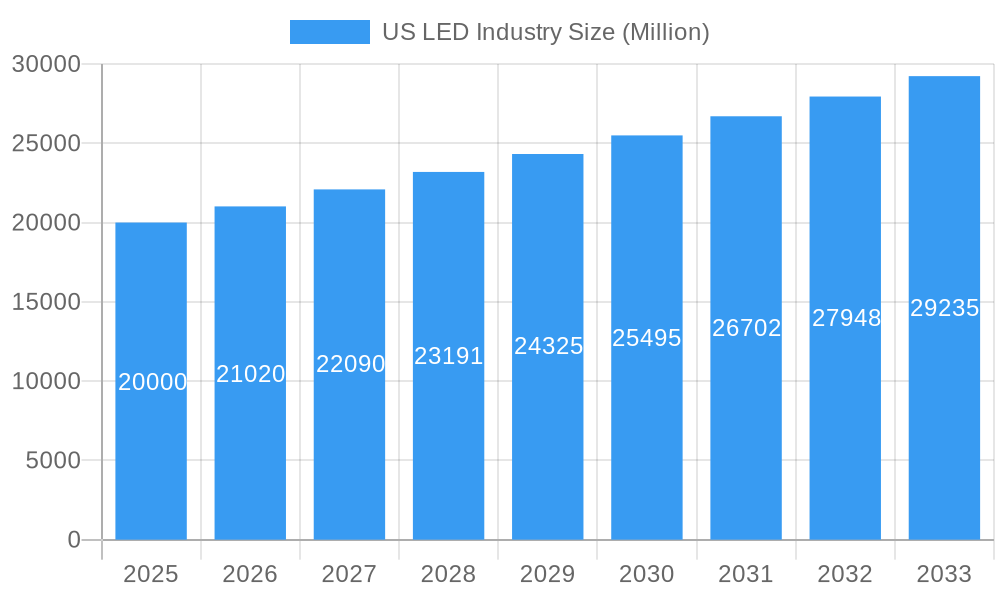
The US LED lighting market is projected for significant expansion, fueled by technological innovation, stringent energy efficiency regulations, and diverse application growth. With an estimated market size of $19.22 billion in 2025, and a projected Compound Annual Growth Rate (CAGR) of 5.06% through 2033, the sector exhibits robust and sustained momentum. This growth is driven by the continuous pursuit of energy savings and reduced operational costs, establishing LEDs as the preferred choice for new installations and retrofits across all sectors. Declining LED costs, coupled with superior longevity, durability, and enhanced controllability, accelerate adoption. Government initiatives promoting energy-efficient lighting and regulations phasing out less efficient technologies further propel market expansion.
US LED Industry Market Size (In Billion)
Key growth segments within the US LED market include indoor lighting for commercial (offices, retail), industrial, and warehouse applications, where smart lighting solutions offer advanced control and integration. Outdoor lighting for streets, roadways, and public spaces is experiencing substantial investment driven by smart city initiatives and the demand for improved safety and energy management. The automotive sector is a critical growth avenue, with increasing LED adoption for Daytime Running Lights (DRL), headlights, and interior illumination, enhancing vehicle safety and aesthetics. While widespread adoption and technological maturity are foundational drivers, potential restraints may include initial capital investment for smaller businesses and the need for skilled labor for complex smart lighting installations. However, the long-term cost savings and performance benefits are expected to outweigh these challenges, ensuring a positive trajectory for the US LED industry.
US LED Industry Company Market Share
US LED Industry Report: Market Size, Growth, and Forecast (2025-2033)
Gain comprehensive insights into the dynamic US LED lighting market. This report provides historical analysis (2019-2024) and an extensive forecast period (2025-2033), using 2025 as the base year. Explore critical market dynamics, innovation trends, regional dominance, and future opportunities across sectors from automotive to residential lighting. Analyze key players driving advancements in energy-efficient and smart lighting solutions.
US LED Industry Market Structure & Innovation Trends
The US LED industry is characterized by a moderately concentrated market, with a few dominant players alongside a growing number of specialized manufacturers. Innovation is a primary driver, fueled by advancements in semiconductor technology, smart controls, and luminaire design. Regulatory frameworks, particularly those promoting energy efficiency and sustainability, play a significant role in shaping product development and market adoption. Product substitutes, primarily traditional lighting technologies, are rapidly losing ground due to the superior performance and cost-effectiveness of LEDs. End-user demographics are shifting towards consumers and businesses demanding higher quality, customizable, and interconnected lighting solutions. Mergers and acquisitions (M&A) activities are prevalent, with strategic consolidations aimed at expanding market share and acquiring technological capabilities. Recent M&A deal values in the sector have reached several hundred million dollars, reflecting the industry's robust growth and investment potential.
- Market Concentration: Dominated by a mix of large multinational corporations and agile niche players.
- Innovation Drivers: Energy efficiency mandates, smart city initiatives, and demand for advanced functionalities like color tuning and connectivity.
- Regulatory Frameworks: Federal and state energy efficiency standards, sustainability initiatives, and building codes.
- Product Substitutes: Incandescent and fluorescent lighting are rapidly being phased out.
- End-User Demographics: Growing demand from commercial real estate, automotive manufacturers, and increasingly, environmentally conscious residential consumers.
- M&A Activities: Strategic acquisitions to gain market access, technological expertise, and product portfolios. Notable M&A deals valued in the hundreds of millions of dollars.
US LED Industry Market Dynamics & Trends
The US LED industry is experiencing robust growth driven by a confluence of technological advancements, evolving consumer preferences, and supportive government policies. The increasing demand for energy-efficient lighting solutions, coupled with a growing awareness of the environmental benefits of LEDs, is a primary growth catalyst. Technological disruptions, such as the integration of Artificial Intelligence (AI) and the Internet of Things (IoT) into lighting systems, are transforming ordinary fixtures into intelligent, connected devices capable of offering advanced features like predictive maintenance and adaptive illumination. Consumer preferences are increasingly leaning towards customizable lighting experiences, with a focus on human-centric lighting that enhances well-being and productivity. The competitive landscape is intense, marked by continuous product innovation, aggressive pricing strategies, and strategic partnerships. The market penetration of LED technology in the US has surpassed 70%, with significant room for growth in specialized applications and retrofit markets. The Compound Annual Growth Rate (CAGR) for the US LED industry is projected to be approximately 8.5% over the forecast period, indicating sustained expansion and significant investment opportunities. The ongoing transition from legacy lighting technologies to LED solutions, driven by both cost savings and performance advantages, continues to fuel market expansion across all segments. The development of more sophisticated control systems and the increasing adoption of luminaire-as-a-service models are further shaping market dynamics and enhancing the overall value proposition of LED lighting solutions.
Dominant Regions & Segments in US LED Industry
The US LED industry exhibits strong dominance across several key regions and segments, driven by economic policies, infrastructure development, and specific industry needs. The Commercial segment, encompassing Office, Retail, and Others, stands out as a leading force, propelled by the widespread adoption of energy-efficient lighting in corporate buildings, retail spaces, and hospitality venues. The push for sustainability, reduced operational costs, and enhanced aesthetics in these environments significantly fuels demand.
- Commercial (Office, Retail, Others): This segment is a powerhouse due to:
- Energy Efficiency Mandates: Government and corporate initiatives to reduce energy consumption and carbon footprints.
- Cost Savings: Lower electricity bills and reduced maintenance over the lifecycle of LED fixtures.
- Enhanced Ambiance & Productivity: Customizable lighting for improved retail customer experience and office worker well-being.
- Smart Building Integration: Seamless integration of LED lighting with building management systems for optimized control and automation.
- Retrofit Opportunities: A vast installed base of older lighting technologies in commercial spaces presents significant opportunities for LED upgrades.
Beyond the commercial sector, Outdoor Lighting: Streets and Roadways is another critical area of dominance. The increasing focus on public safety, the development of smart city infrastructure, and the adoption of energy-saving solutions for municipal lighting are key drivers. The longevity and reduced maintenance requirements of LED streetlights make them a cost-effective choice for local governments.
- Outdoor Lighting: Streets and Roadways: Dominance is attributed to:
- Public Safety: Improved visibility and reduced crime rates with enhanced illumination.
- Smart City Initiatives: Integration with IoT devices for traffic management, environmental monitoring, and data collection.
- Municipal Budgets: Long-term cost savings through reduced energy consumption and maintenance.
- Durability & Reliability: LED fixtures are designed to withstand harsh outdoor conditions.
The Automotive Utility Lighting: Headlights segment also holds significant sway, driven by advancements in automotive technology and safety regulations. The superior illumination quality, energy efficiency, and design flexibility offered by LED headlights are making them the standard for new vehicle production.
- Automotive Utility Lighting: Headlights: Key factors include:
- Enhanced Safety: Brighter and more focused illumination improves driver visibility.
- Fuel Efficiency: Lower power consumption contributes to better fuel economy.
- Design Innovation: Compact size and flexibility allow for more aerodynamic and stylish vehicle designs.
- Regulatory Standards: Increasing stringency of automotive safety and lighting regulations.
While other segments like Industrial and Warehouse, Residential, and other automotive lighting applications are experiencing substantial growth, the commercial and public infrastructure-focused outdoor lighting, alongside the critical automotive headlight segment, currently represent the most dominant forces shaping the US LED industry's market landscape.
US LED Industry Product Innovations
The US LED industry is experiencing a wave of product innovations focused on enhancing efficiency, intelligence, and application-specific performance. Advancements in luminaire design, such as Dialight's ProSite High Mast offering up to 65,000 lumens for superior site security and Cyclone Lighting's Elencia luminaire with its upscale outdoor post-top design, are expanding application possibilities. Hydrel's M9700 RGBW fixture in the M9000 ingrade luminaire family showcases a move towards sophisticated architectural and landscape lighting. These innovations offer competitive advantages through improved illumination quality, reduced energy consumption, extended lifespan, and integrated smart capabilities, aligning perfectly with market demands for sustainable and technologically advanced lighting solutions.
Report Scope & Segmentation Analysis
This report provides an in-depth analysis of the US LED industry, meticulously segmenting the market to offer granular insights.
- Indoor Lighting: This broad category includes Agricultural Lighting, crucial for optimizing crop yields; Commercial applications spanning Office, Retail, and Others, catering to diverse business needs; Industrial and Warehouse lighting for operational efficiency; and Residential lighting focused on comfort and aesthetics.
- Outdoor Lighting: Encompasses Public Places for safety and ambiance, Streets and Roadways for infrastructure illumination, and Others for specialized outdoor applications.
- Automotive Utility Lighting: Details the critical functions of Daytime Running Lights (DRL), Directional Signal Lights, Headlights, Reverse Light, Stop Light, Tail Light, and Others, all vital for vehicle safety and operation.
- Automotive Vehicle Lighting: Further breaks down the market by vehicle type, including 2 Wheelers, Commercial Vehicles, and Passenger Cars, reflecting unique lighting requirements for each.
Each segment is analyzed for its market size, growth projections, and competitive dynamics, providing a comprehensive view of the US LED landscape.
Key Drivers of US LED Industry Growth
The US LED industry's growth is propelled by several powerful forces. Foremost is the relentless pursuit of energy efficiency, driven by both environmental concerns and economic incentives. Government regulations and mandates promoting energy conservation act as significant accelerators. Technological advancements in LED chip efficiency, driver technology, and smart control systems continuously improve performance and enable new applications. The increasing integration of IoT and AI into lighting solutions is creating smart, responsive environments, further boosting demand. Furthermore, the declining cost of LED technology has made it a more accessible and cost-effective alternative across a wider range of applications, driving widespread adoption.
Challenges in the US LED Industry Sector
Despite its robust growth, the US LED industry faces several challenges. High initial investment costs for advanced LED systems can be a barrier for some smaller businesses and municipalities. Supply chain disruptions and the volatility of raw material prices can impact production and pricing. Lack of standardization in smart lighting protocols can lead to interoperability issues between different manufacturers' products. Intense competitive pressure can drive down profit margins, particularly for commoditized products. Furthermore, regulatory hurdles and evolving compliance requirements can add complexity and cost to product development and market entry.
Emerging Opportunities in US LED Industry
The US LED industry is ripe with emerging opportunities. The expansion of smart city infrastructure presents a vast market for connected outdoor and public space lighting solutions. Growing interest in human-centric lighting for healthcare and educational facilities opens new avenues for specialized applications that support well-being. The increasing adoption of IoT and AI integration creates demand for intelligent lighting systems that offer advanced data analytics and automation. The automotive sector, with its push for advanced driver-assistance systems (ADAS) and electric vehicles, requires sophisticated and integrated LED lighting solutions. Finally, the ongoing retrofit market for residential and commercial buildings continues to offer substantial growth potential.
Leading Players in the US LED Industry Market
- OSRAM GmbH
- Koito Manufacturing Co Ltd
- Dialight
- ACUITY BRANDS INC
- Grupo Antolin Irausa SA
- NVC INTERNATIONAL HOLDINGS LIMITED
- Current Lighting Solutions LLC
- Marelli Holdings Co Ltd
- Signify (Philips)
- Stanley Electric Co Lt
Key Developments in US LED Industry Industry
- May 2023: Cyclone Lighting debuts its Elencia luminaire, enhancing outdoor post-top lighting with high-performance optics and a modern lantern style.
- May 2023: Dialight introduces the ProSite High Mast, expanding its industrial LED lighting range for applications up to 130 feet with up to 65,000 lumens for improved site security.
- April 2023: Hydrel adds the M9700 RGBW fixture to its M9000 ingrade luminaire family, signaling advancements in outdoor architectural and landscape lighting.
Future Outlook for US LED Industry Market
The future outlook for the US LED industry is exceptionally bright, characterized by sustained growth and continuous innovation. The ongoing transition towards smarter, more connected, and energy-efficient lighting solutions will remain a dominant theme. Expect to see increased integration of AI for predictive maintenance and adaptive lighting, further advancements in luminaire miniaturization and thermal management, and a growing focus on sustainability throughout the product lifecycle. The expansion of LED technology into new and existing applications, driven by declining costs and evolving consumer demands, will ensure a dynamic and prosperous market. Strategic partnerships and M&A activities will likely continue to shape the competitive landscape, fostering consolidation and the development of integrated lighting ecosystems. The US LED market is poised for significant expansion, offering substantial opportunities for stakeholders across the value chain.
US LED Industry Segmentation
-
1. Indoor Lighting
- 1.1. Agricultural Lighting
-
1.2. Commercial
- 1.2.1. Office
- 1.2.2. Retail
- 1.2.3. Others
- 1.3. Industrial and Warehouse
- 1.4. Residential
-
2. Outdoor Lighting
- 2.1. Public Places
- 2.2. Streets and Roadways
- 2.3. Others
-
3. Automotive Utility Lighting
- 3.1. Daytime Running Lights (DRL)
- 3.2. Directional Signal Lights
- 3.3. Headlights
- 3.4. Reverse Light
- 3.5. Stop Light
- 3.6. Tail Light
- 3.7. Others
-
4. Automotive Vehicle Lighting
- 4.1. 2 Wheelers
- 4.2. Commercial Vehicles
- 4.3. Passenger Cars
US LED Industry Segmentation By Geography
-
1. North America
- 1.1. United States
- 1.2. Canada
- 1.3. Mexico
-
2. South America
- 2.1. Brazil
- 2.2. Argentina
- 2.3. Rest of South America
-
3. Europe
- 3.1. United Kingdom
- 3.2. Germany
- 3.3. France
- 3.4. Italy
- 3.5. Spain
- 3.6. Russia
- 3.7. Benelux
- 3.8. Nordics
- 3.9. Rest of Europe
-
4. Middle East & Africa
- 4.1. Turkey
- 4.2. Israel
- 4.3. GCC
- 4.4. North Africa
- 4.5. South Africa
- 4.6. Rest of Middle East & Africa
-
5. Asia Pacific
- 5.1. China
- 5.2. India
- 5.3. Japan
- 5.4. South Korea
- 5.5. ASEAN
- 5.6. Oceania
- 5.7. Rest of Asia Pacific
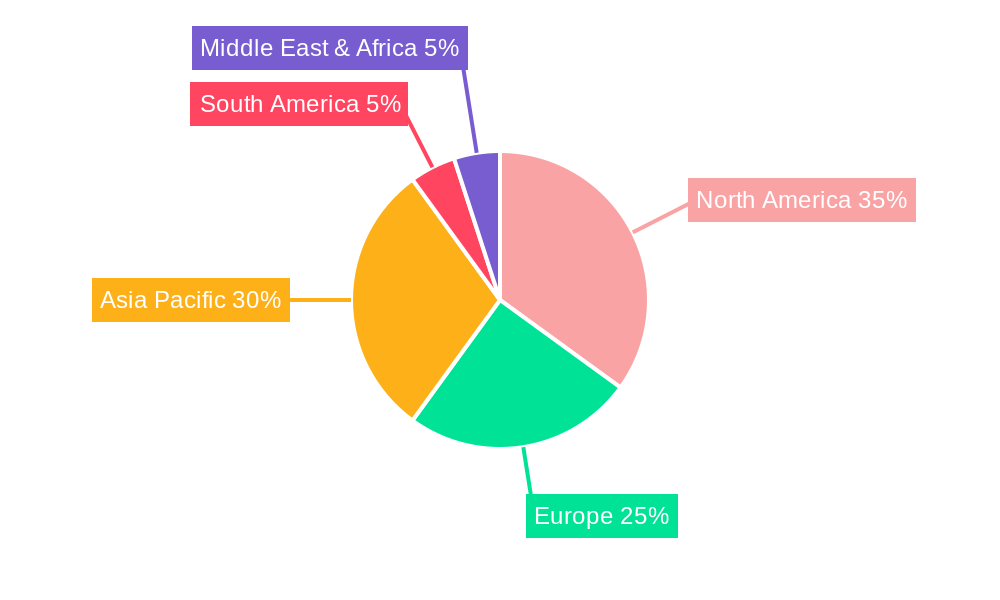
US LED Industry Regional Market Share
Geographic Coverage of US LED Industry
US LED Industry REPORT HIGHLIGHTS
| Aspects | Details |
|---|---|
| Study Period | 2020-2034 |
| Base Year | 2025 |
| Estimated Year | 2026 |
| Forecast Period | 2026-2034 |
| Historical Period | 2020-2025 |
| Growth Rate | CAGR of 5.06% from 2020-2034 |
| Segmentation |
|
Table of Contents
- 1. Introduction
- 1.1. Research Scope
- 1.2. Market Segmentation
- 1.3. Research Objective
- 1.4. Definitions and Assumptions
- 2. Executive Summary
- 2.1. Market Snapshot
- 3. Market Dynamics
- 3.1. Market Drivers
- 3.2. Market Restrains
- 3.3. Market Trends
- 3.4. Market Opportunities
- 4. Market Factor Analysis
- 4.1. Porters Five Forces
- 4.1.1. Bargaining Power of Suppliers
- 4.1.2. Bargaining Power of Buyers
- 4.1.3. Threat of New Entrants
- 4.1.4. Threat of Substitutes
- 4.1.5. Competitive Rivalry
- 4.2. PESTEL analysis
- 4.3. BCG Analysis
- 4.3.1. Stars (High Growth, High Market Share)
- 4.3.2. Cash Cows (Low Growth, High Market Share)
- 4.3.3. Question Mark (High Growth, Low Market Share)
- 4.3.4. Dogs (Low Growth, Low Market Share)
- 4.4. Ansoff Matrix Analysis
- 4.5. Supply Chain Analysis
- 4.6. Regulatory Landscape
- 4.7. Current Market Potential and Opportunity Assessment (TAM–SAM–SOM Framework)
- 4.8. PRI Analyst Note
- 4.1. Porters Five Forces
- 5. Market Analysis, Insights and Forecast 2021-2033
- 5.1. Market Analysis, Insights and Forecast - by Indoor Lighting
- 5.1.1. Agricultural Lighting
- 5.1.2. Commercial
- 5.1.2.1. Office
- 5.1.2.2. Retail
- 5.1.2.3. Others
- 5.1.3. Industrial and Warehouse
- 5.1.4. Residential
- 5.2. Market Analysis, Insights and Forecast - by Outdoor Lighting
- 5.2.1. Public Places
- 5.2.2. Streets and Roadways
- 5.2.3. Others
- 5.3. Market Analysis, Insights and Forecast - by Automotive Utility Lighting
- 5.3.1. Daytime Running Lights (DRL)
- 5.3.2. Directional Signal Lights
- 5.3.3. Headlights
- 5.3.4. Reverse Light
- 5.3.5. Stop Light
- 5.3.6. Tail Light
- 5.3.7. Others
- 5.4. Market Analysis, Insights and Forecast - by Automotive Vehicle Lighting
- 5.4.1. 2 Wheelers
- 5.4.2. Commercial Vehicles
- 5.4.3. Passenger Cars
- 5.5. Market Analysis, Insights and Forecast - by Region
- 5.5.1. North America
- 5.5.2. South America
- 5.5.3. Europe
- 5.5.4. Middle East & Africa
- 5.5.5. Asia Pacific
- 5.1. Market Analysis, Insights and Forecast - by Indoor Lighting
- 6. Global US LED Industry Analysis, Insights and Forecast, 2021-2033
- 6.1. Market Analysis, Insights and Forecast - by Indoor Lighting
- 6.1.1. Agricultural Lighting
- 6.1.2. Commercial
- 6.1.2.1. Office
- 6.1.2.2. Retail
- 6.1.2.3. Others
- 6.1.3. Industrial and Warehouse
- 6.1.4. Residential
- 6.2. Market Analysis, Insights and Forecast - by Outdoor Lighting
- 6.2.1. Public Places
- 6.2.2. Streets and Roadways
- 6.2.3. Others
- 6.3. Market Analysis, Insights and Forecast - by Automotive Utility Lighting
- 6.3.1. Daytime Running Lights (DRL)
- 6.3.2. Directional Signal Lights
- 6.3.3. Headlights
- 6.3.4. Reverse Light
- 6.3.5. Stop Light
- 6.3.6. Tail Light
- 6.3.7. Others
- 6.4. Market Analysis, Insights and Forecast - by Automotive Vehicle Lighting
- 6.4.1. 2 Wheelers
- 6.4.2. Commercial Vehicles
- 6.4.3. Passenger Cars
- 6.1. Market Analysis, Insights and Forecast - by Indoor Lighting
- 7. North America US LED Industry Analysis, Insights and Forecast, 2020-2032
- 7.1. Market Analysis, Insights and Forecast - by Indoor Lighting
- 7.1.1. Agricultural Lighting
- 7.1.2. Commercial
- 7.1.2.1. Office
- 7.1.2.2. Retail
- 7.1.2.3. Others
- 7.1.3. Industrial and Warehouse
- 7.1.4. Residential
- 7.2. Market Analysis, Insights and Forecast - by Outdoor Lighting
- 7.2.1. Public Places
- 7.2.2. Streets and Roadways
- 7.2.3. Others
- 7.3. Market Analysis, Insights and Forecast - by Automotive Utility Lighting
- 7.3.1. Daytime Running Lights (DRL)
- 7.3.2. Directional Signal Lights
- 7.3.3. Headlights
- 7.3.4. Reverse Light
- 7.3.5. Stop Light
- 7.3.6. Tail Light
- 7.3.7. Others
- 7.4. Market Analysis, Insights and Forecast - by Automotive Vehicle Lighting
- 7.4.1. 2 Wheelers
- 7.4.2. Commercial Vehicles
- 7.4.3. Passenger Cars
- 7.1. Market Analysis, Insights and Forecast - by Indoor Lighting
- 8. South America US LED Industry Analysis, Insights and Forecast, 2020-2032
- 8.1. Market Analysis, Insights and Forecast - by Indoor Lighting
- 8.1.1. Agricultural Lighting
- 8.1.2. Commercial
- 8.1.2.1. Office
- 8.1.2.2. Retail
- 8.1.2.3. Others
- 8.1.3. Industrial and Warehouse
- 8.1.4. Residential
- 8.2. Market Analysis, Insights and Forecast - by Outdoor Lighting
- 8.2.1. Public Places
- 8.2.2. Streets and Roadways
- 8.2.3. Others
- 8.3. Market Analysis, Insights and Forecast - by Automotive Utility Lighting
- 8.3.1. Daytime Running Lights (DRL)
- 8.3.2. Directional Signal Lights
- 8.3.3. Headlights
- 8.3.4. Reverse Light
- 8.3.5. Stop Light
- 8.3.6. Tail Light
- 8.3.7. Others
- 8.4. Market Analysis, Insights and Forecast - by Automotive Vehicle Lighting
- 8.4.1. 2 Wheelers
- 8.4.2. Commercial Vehicles
- 8.4.3. Passenger Cars
- 8.1. Market Analysis, Insights and Forecast - by Indoor Lighting
- 9. Europe US LED Industry Analysis, Insights and Forecast, 2020-2032
- 9.1. Market Analysis, Insights and Forecast - by Indoor Lighting
- 9.1.1. Agricultural Lighting
- 9.1.2. Commercial
- 9.1.2.1. Office
- 9.1.2.2. Retail
- 9.1.2.3. Others
- 9.1.3. Industrial and Warehouse
- 9.1.4. Residential
- 9.2. Market Analysis, Insights and Forecast - by Outdoor Lighting
- 9.2.1. Public Places
- 9.2.2. Streets and Roadways
- 9.2.3. Others
- 9.3. Market Analysis, Insights and Forecast - by Automotive Utility Lighting
- 9.3.1. Daytime Running Lights (DRL)
- 9.3.2. Directional Signal Lights
- 9.3.3. Headlights
- 9.3.4. Reverse Light
- 9.3.5. Stop Light
- 9.3.6. Tail Light
- 9.3.7. Others
- 9.4. Market Analysis, Insights and Forecast - by Automotive Vehicle Lighting
- 9.4.1. 2 Wheelers
- 9.4.2. Commercial Vehicles
- 9.4.3. Passenger Cars
- 9.1. Market Analysis, Insights and Forecast - by Indoor Lighting
- 10. Middle East & Africa US LED Industry Analysis, Insights and Forecast, 2020-2032
- 10.1. Market Analysis, Insights and Forecast - by Indoor Lighting
- 10.1.1. Agricultural Lighting
- 10.1.2. Commercial
- 10.1.2.1. Office
- 10.1.2.2. Retail
- 10.1.2.3. Others
- 10.1.3. Industrial and Warehouse
- 10.1.4. Residential
- 10.2. Market Analysis, Insights and Forecast - by Outdoor Lighting
- 10.2.1. Public Places
- 10.2.2. Streets and Roadways
- 10.2.3. Others
- 10.3. Market Analysis, Insights and Forecast - by Automotive Utility Lighting
- 10.3.1. Daytime Running Lights (DRL)
- 10.3.2. Directional Signal Lights
- 10.3.3. Headlights
- 10.3.4. Reverse Light
- 10.3.5. Stop Light
- 10.3.6. Tail Light
- 10.3.7. Others
- 10.4. Market Analysis, Insights and Forecast - by Automotive Vehicle Lighting
- 10.4.1. 2 Wheelers
- 10.4.2. Commercial Vehicles
- 10.4.3. Passenger Cars
- 10.1. Market Analysis, Insights and Forecast - by Indoor Lighting
- 11. Asia Pacific US LED Industry Analysis, Insights and Forecast, 2020-2032
- 11.1. Market Analysis, Insights and Forecast - by Indoor Lighting
- 11.1.1. Agricultural Lighting
- 11.1.2. Commercial
- 11.1.2.1. Office
- 11.1.2.2. Retail
- 11.1.2.3. Others
- 11.1.3. Industrial and Warehouse
- 11.1.4. Residential
- 11.2. Market Analysis, Insights and Forecast - by Outdoor Lighting
- 11.2.1. Public Places
- 11.2.2. Streets and Roadways
- 11.2.3. Others
- 11.3. Market Analysis, Insights and Forecast - by Automotive Utility Lighting
- 11.3.1. Daytime Running Lights (DRL)
- 11.3.2. Directional Signal Lights
- 11.3.3. Headlights
- 11.3.4. Reverse Light
- 11.3.5. Stop Light
- 11.3.6. Tail Light
- 11.3.7. Others
- 11.4. Market Analysis, Insights and Forecast - by Automotive Vehicle Lighting
- 11.4.1. 2 Wheelers
- 11.4.2. Commercial Vehicles
- 11.4.3. Passenger Cars
- 11.1. Market Analysis, Insights and Forecast - by Indoor Lighting
- 12. Competitive Analysis
- 12.1. Company Profiles
- 12.1.1 OSRAM GmbH
- 12.1.1.1. Company Overview
- 12.1.1.2. Products
- 12.1.1.3. Company Financials
- 12.1.1.4. SWOT Analysis
- 12.1.2 Koito Manufacturing Co Ltd
- 12.1.2.1. Company Overview
- 12.1.2.2. Products
- 12.1.2.3. Company Financials
- 12.1.2.4. SWOT Analysis
- 12.1.3 Dialight
- 12.1.3.1. Company Overview
- 12.1.3.2. Products
- 12.1.3.3. Company Financials
- 12.1.3.4. SWOT Analysis
- 12.1.4 ACUITY BRANDS INC
- 12.1.4.1. Company Overview
- 12.1.4.2. Products
- 12.1.4.3. Company Financials
- 12.1.4.4. SWOT Analysis
- 12.1.5 Grupo Antolin Irausa SA
- 12.1.5.1. Company Overview
- 12.1.5.2. Products
- 12.1.5.3. Company Financials
- 12.1.5.4. SWOT Analysis
- 12.1.6 NVC INTERNATIONAL HOLDINGS LIMITED
- 12.1.6.1. Company Overview
- 12.1.6.2. Products
- 12.1.6.3. Company Financials
- 12.1.6.4. SWOT Analysis
- 12.1.7 Current Lighting Solutions LLC
- 12.1.7.1. Company Overview
- 12.1.7.2. Products
- 12.1.7.3. Company Financials
- 12.1.7.4. SWOT Analysis
- 12.1.8 Marelli Holdings Co Ltd
- 12.1.8.1. Company Overview
- 12.1.8.2. Products
- 12.1.8.3. Company Financials
- 12.1.8.4. SWOT Analysis
- 12.1.9 Signify (Philips)
- 12.1.9.1. Company Overview
- 12.1.9.2. Products
- 12.1.9.3. Company Financials
- 12.1.9.4. SWOT Analysis
- 12.1.10 Stanley Electric Co Lt
- 12.1.10.1. Company Overview
- 12.1.10.2. Products
- 12.1.10.3. Company Financials
- 12.1.10.4. SWOT Analysis
- 12.1.1 OSRAM GmbH
- 12.2. Market Entropy
- 12.2.1 Company's Key Areas Served
- 12.2.2 Recent Developments
- 12.3. Company Market Share Analysis 2025
- 12.3.1 Top 5 Companies Market Share Analysis
- 12.3.2 Top 3 Companies Market Share Analysis
- 12.4. List of Potential Customers
- 13. Research Methodology
List of Figures
- Figure 1: Global US LED Industry Revenue Breakdown (billion, %) by Region 2025 & 2033
- Figure 2: Global US LED Industry Volume Breakdown (K Unit, %) by Region 2025 & 2033
- Figure 3: North America US LED Industry Revenue (billion), by Indoor Lighting 2025 & 2033
- Figure 4: North America US LED Industry Volume (K Unit), by Indoor Lighting 2025 & 2033
- Figure 5: North America US LED Industry Revenue Share (%), by Indoor Lighting 2025 & 2033
- Figure 6: North America US LED Industry Volume Share (%), by Indoor Lighting 2025 & 2033
- Figure 7: North America US LED Industry Revenue (billion), by Outdoor Lighting 2025 & 2033
- Figure 8: North America US LED Industry Volume (K Unit), by Outdoor Lighting 2025 & 2033
- Figure 9: North America US LED Industry Revenue Share (%), by Outdoor Lighting 2025 & 2033
- Figure 10: North America US LED Industry Volume Share (%), by Outdoor Lighting 2025 & 2033
- Figure 11: North America US LED Industry Revenue (billion), by Automotive Utility Lighting 2025 & 2033
- Figure 12: North America US LED Industry Volume (K Unit), by Automotive Utility Lighting 2025 & 2033
- Figure 13: North America US LED Industry Revenue Share (%), by Automotive Utility Lighting 2025 & 2033
- Figure 14: North America US LED Industry Volume Share (%), by Automotive Utility Lighting 2025 & 2033
- Figure 15: North America US LED Industry Revenue (billion), by Automotive Vehicle Lighting 2025 & 2033
- Figure 16: North America US LED Industry Volume (K Unit), by Automotive Vehicle Lighting 2025 & 2033
- Figure 17: North America US LED Industry Revenue Share (%), by Automotive Vehicle Lighting 2025 & 2033
- Figure 18: North America US LED Industry Volume Share (%), by Automotive Vehicle Lighting 2025 & 2033
- Figure 19: North America US LED Industry Revenue (billion), by Country 2025 & 2033
- Figure 20: North America US LED Industry Volume (K Unit), by Country 2025 & 2033
- Figure 21: North America US LED Industry Revenue Share (%), by Country 2025 & 2033
- Figure 22: North America US LED Industry Volume Share (%), by Country 2025 & 2033
- Figure 23: South America US LED Industry Revenue (billion), by Indoor Lighting 2025 & 2033
- Figure 24: South America US LED Industry Volume (K Unit), by Indoor Lighting 2025 & 2033
- Figure 25: South America US LED Industry Revenue Share (%), by Indoor Lighting 2025 & 2033
- Figure 26: South America US LED Industry Volume Share (%), by Indoor Lighting 2025 & 2033
- Figure 27: South America US LED Industry Revenue (billion), by Outdoor Lighting 2025 & 2033
- Figure 28: South America US LED Industry Volume (K Unit), by Outdoor Lighting 2025 & 2033
- Figure 29: South America US LED Industry Revenue Share (%), by Outdoor Lighting 2025 & 2033
- Figure 30: South America US LED Industry Volume Share (%), by Outdoor Lighting 2025 & 2033
- Figure 31: South America US LED Industry Revenue (billion), by Automotive Utility Lighting 2025 & 2033
- Figure 32: South America US LED Industry Volume (K Unit), by Automotive Utility Lighting 2025 & 2033
- Figure 33: South America US LED Industry Revenue Share (%), by Automotive Utility Lighting 2025 & 2033
- Figure 34: South America US LED Industry Volume Share (%), by Automotive Utility Lighting 2025 & 2033
- Figure 35: South America US LED Industry Revenue (billion), by Automotive Vehicle Lighting 2025 & 2033
- Figure 36: South America US LED Industry Volume (K Unit), by Automotive Vehicle Lighting 2025 & 2033
- Figure 37: South America US LED Industry Revenue Share (%), by Automotive Vehicle Lighting 2025 & 2033
- Figure 38: South America US LED Industry Volume Share (%), by Automotive Vehicle Lighting 2025 & 2033
- Figure 39: South America US LED Industry Revenue (billion), by Country 2025 & 2033
- Figure 40: South America US LED Industry Volume (K Unit), by Country 2025 & 2033
- Figure 41: South America US LED Industry Revenue Share (%), by Country 2025 & 2033
- Figure 42: South America US LED Industry Volume Share (%), by Country 2025 & 2033
- Figure 43: Europe US LED Industry Revenue (billion), by Indoor Lighting 2025 & 2033
- Figure 44: Europe US LED Industry Volume (K Unit), by Indoor Lighting 2025 & 2033
- Figure 45: Europe US LED Industry Revenue Share (%), by Indoor Lighting 2025 & 2033
- Figure 46: Europe US LED Industry Volume Share (%), by Indoor Lighting 2025 & 2033
- Figure 47: Europe US LED Industry Revenue (billion), by Outdoor Lighting 2025 & 2033
- Figure 48: Europe US LED Industry Volume (K Unit), by Outdoor Lighting 2025 & 2033
- Figure 49: Europe US LED Industry Revenue Share (%), by Outdoor Lighting 2025 & 2033
- Figure 50: Europe US LED Industry Volume Share (%), by Outdoor Lighting 2025 & 2033
- Figure 51: Europe US LED Industry Revenue (billion), by Automotive Utility Lighting 2025 & 2033
- Figure 52: Europe US LED Industry Volume (K Unit), by Automotive Utility Lighting 2025 & 2033
- Figure 53: Europe US LED Industry Revenue Share (%), by Automotive Utility Lighting 2025 & 2033
- Figure 54: Europe US LED Industry Volume Share (%), by Automotive Utility Lighting 2025 & 2033
- Figure 55: Europe US LED Industry Revenue (billion), by Automotive Vehicle Lighting 2025 & 2033
- Figure 56: Europe US LED Industry Volume (K Unit), by Automotive Vehicle Lighting 2025 & 2033
- Figure 57: Europe US LED Industry Revenue Share (%), by Automotive Vehicle Lighting 2025 & 2033
- Figure 58: Europe US LED Industry Volume Share (%), by Automotive Vehicle Lighting 2025 & 2033
- Figure 59: Europe US LED Industry Revenue (billion), by Country 2025 & 2033
- Figure 60: Europe US LED Industry Volume (K Unit), by Country 2025 & 2033
- Figure 61: Europe US LED Industry Revenue Share (%), by Country 2025 & 2033
- Figure 62: Europe US LED Industry Volume Share (%), by Country 2025 & 2033
- Figure 63: Middle East & Africa US LED Industry Revenue (billion), by Indoor Lighting 2025 & 2033
- Figure 64: Middle East & Africa US LED Industry Volume (K Unit), by Indoor Lighting 2025 & 2033
- Figure 65: Middle East & Africa US LED Industry Revenue Share (%), by Indoor Lighting 2025 & 2033
- Figure 66: Middle East & Africa US LED Industry Volume Share (%), by Indoor Lighting 2025 & 2033
- Figure 67: Middle East & Africa US LED Industry Revenue (billion), by Outdoor Lighting 2025 & 2033
- Figure 68: Middle East & Africa US LED Industry Volume (K Unit), by Outdoor Lighting 2025 & 2033
- Figure 69: Middle East & Africa US LED Industry Revenue Share (%), by Outdoor Lighting 2025 & 2033
- Figure 70: Middle East & Africa US LED Industry Volume Share (%), by Outdoor Lighting 2025 & 2033
- Figure 71: Middle East & Africa US LED Industry Revenue (billion), by Automotive Utility Lighting 2025 & 2033
- Figure 72: Middle East & Africa US LED Industry Volume (K Unit), by Automotive Utility Lighting 2025 & 2033
- Figure 73: Middle East & Africa US LED Industry Revenue Share (%), by Automotive Utility Lighting 2025 & 2033
- Figure 74: Middle East & Africa US LED Industry Volume Share (%), by Automotive Utility Lighting 2025 & 2033
- Figure 75: Middle East & Africa US LED Industry Revenue (billion), by Automotive Vehicle Lighting 2025 & 2033
- Figure 76: Middle East & Africa US LED Industry Volume (K Unit), by Automotive Vehicle Lighting 2025 & 2033
- Figure 77: Middle East & Africa US LED Industry Revenue Share (%), by Automotive Vehicle Lighting 2025 & 2033
- Figure 78: Middle East & Africa US LED Industry Volume Share (%), by Automotive Vehicle Lighting 2025 & 2033
- Figure 79: Middle East & Africa US LED Industry Revenue (billion), by Country 2025 & 2033
- Figure 80: Middle East & Africa US LED Industry Volume (K Unit), by Country 2025 & 2033
- Figure 81: Middle East & Africa US LED Industry Revenue Share (%), by Country 2025 & 2033
- Figure 82: Middle East & Africa US LED Industry Volume Share (%), by Country 2025 & 2033
- Figure 83: Asia Pacific US LED Industry Revenue (billion), by Indoor Lighting 2025 & 2033
- Figure 84: Asia Pacific US LED Industry Volume (K Unit), by Indoor Lighting 2025 & 2033
- Figure 85: Asia Pacific US LED Industry Revenue Share (%), by Indoor Lighting 2025 & 2033
- Figure 86: Asia Pacific US LED Industry Volume Share (%), by Indoor Lighting 2025 & 2033
- Figure 87: Asia Pacific US LED Industry Revenue (billion), by Outdoor Lighting 2025 & 2033
- Figure 88: Asia Pacific US LED Industry Volume (K Unit), by Outdoor Lighting 2025 & 2033
- Figure 89: Asia Pacific US LED Industry Revenue Share (%), by Outdoor Lighting 2025 & 2033
- Figure 90: Asia Pacific US LED Industry Volume Share (%), by Outdoor Lighting 2025 & 2033
- Figure 91: Asia Pacific US LED Industry Revenue (billion), by Automotive Utility Lighting 2025 & 2033
- Figure 92: Asia Pacific US LED Industry Volume (K Unit), by Automotive Utility Lighting 2025 & 2033
- Figure 93: Asia Pacific US LED Industry Revenue Share (%), by Automotive Utility Lighting 2025 & 2033
- Figure 94: Asia Pacific US LED Industry Volume Share (%), by Automotive Utility Lighting 2025 & 2033
- Figure 95: Asia Pacific US LED Industry Revenue (billion), by Automotive Vehicle Lighting 2025 & 2033
- Figure 96: Asia Pacific US LED Industry Volume (K Unit), by Automotive Vehicle Lighting 2025 & 2033
- Figure 97: Asia Pacific US LED Industry Revenue Share (%), by Automotive Vehicle Lighting 2025 & 2033
- Figure 98: Asia Pacific US LED Industry Volume Share (%), by Automotive Vehicle Lighting 2025 & 2033
- Figure 99: Asia Pacific US LED Industry Revenue (billion), by Country 2025 & 2033
- Figure 100: Asia Pacific US LED Industry Volume (K Unit), by Country 2025 & 2033
- Figure 101: Asia Pacific US LED Industry Revenue Share (%), by Country 2025 & 2033
- Figure 102: Asia Pacific US LED Industry Volume Share (%), by Country 2025 & 2033
List of Tables
- Table 1: Global US LED Industry Revenue billion Forecast, by Indoor Lighting 2020 & 2033
- Table 2: Global US LED Industry Volume K Unit Forecast, by Indoor Lighting 2020 & 2033
- Table 3: Global US LED Industry Revenue billion Forecast, by Outdoor Lighting 2020 & 2033
- Table 4: Global US LED Industry Volume K Unit Forecast, by Outdoor Lighting 2020 & 2033
- Table 5: Global US LED Industry Revenue billion Forecast, by Automotive Utility Lighting 2020 & 2033
- Table 6: Global US LED Industry Volume K Unit Forecast, by Automotive Utility Lighting 2020 & 2033
- Table 7: Global US LED Industry Revenue billion Forecast, by Automotive Vehicle Lighting 2020 & 2033
- Table 8: Global US LED Industry Volume K Unit Forecast, by Automotive Vehicle Lighting 2020 & 2033
- Table 9: Global US LED Industry Revenue billion Forecast, by Region 2020 & 2033
- Table 10: Global US LED Industry Volume K Unit Forecast, by Region 2020 & 2033
- Table 11: Global US LED Industry Revenue billion Forecast, by Indoor Lighting 2020 & 2033
- Table 12: Global US LED Industry Volume K Unit Forecast, by Indoor Lighting 2020 & 2033
- Table 13: Global US LED Industry Revenue billion Forecast, by Outdoor Lighting 2020 & 2033
- Table 14: Global US LED Industry Volume K Unit Forecast, by Outdoor Lighting 2020 & 2033
- Table 15: Global US LED Industry Revenue billion Forecast, by Automotive Utility Lighting 2020 & 2033
- Table 16: Global US LED Industry Volume K Unit Forecast, by Automotive Utility Lighting 2020 & 2033
- Table 17: Global US LED Industry Revenue billion Forecast, by Automotive Vehicle Lighting 2020 & 2033
- Table 18: Global US LED Industry Volume K Unit Forecast, by Automotive Vehicle Lighting 2020 & 2033
- Table 19: Global US LED Industry Revenue billion Forecast, by Country 2020 & 2033
- Table 20: Global US LED Industry Volume K Unit Forecast, by Country 2020 & 2033
- Table 21: United States US LED Industry Revenue (billion) Forecast, by Application 2020 & 2033
- Table 22: United States US LED Industry Volume (K Unit) Forecast, by Application 2020 & 2033
- Table 23: Canada US LED Industry Revenue (billion) Forecast, by Application 2020 & 2033
- Table 24: Canada US LED Industry Volume (K Unit) Forecast, by Application 2020 & 2033
- Table 25: Mexico US LED Industry Revenue (billion) Forecast, by Application 2020 & 2033
- Table 26: Mexico US LED Industry Volume (K Unit) Forecast, by Application 2020 & 2033
- Table 27: Global US LED Industry Revenue billion Forecast, by Indoor Lighting 2020 & 2033
- Table 28: Global US LED Industry Volume K Unit Forecast, by Indoor Lighting 2020 & 2033
- Table 29: Global US LED Industry Revenue billion Forecast, by Outdoor Lighting 2020 & 2033
- Table 30: Global US LED Industry Volume K Unit Forecast, by Outdoor Lighting 2020 & 2033
- Table 31: Global US LED Industry Revenue billion Forecast, by Automotive Utility Lighting 2020 & 2033
- Table 32: Global US LED Industry Volume K Unit Forecast, by Automotive Utility Lighting 2020 & 2033
- Table 33: Global US LED Industry Revenue billion Forecast, by Automotive Vehicle Lighting 2020 & 2033
- Table 34: Global US LED Industry Volume K Unit Forecast, by Automotive Vehicle Lighting 2020 & 2033
- Table 35: Global US LED Industry Revenue billion Forecast, by Country 2020 & 2033
- Table 36: Global US LED Industry Volume K Unit Forecast, by Country 2020 & 2033
- Table 37: Brazil US LED Industry Revenue (billion) Forecast, by Application 2020 & 2033
- Table 38: Brazil US LED Industry Volume (K Unit) Forecast, by Application 2020 & 2033
- Table 39: Argentina US LED Industry Revenue (billion) Forecast, by Application 2020 & 2033
- Table 40: Argentina US LED Industry Volume (K Unit) Forecast, by Application 2020 & 2033
- Table 41: Rest of South America US LED Industry Revenue (billion) Forecast, by Application 2020 & 2033
- Table 42: Rest of South America US LED Industry Volume (K Unit) Forecast, by Application 2020 & 2033
- Table 43: Global US LED Industry Revenue billion Forecast, by Indoor Lighting 2020 & 2033
- Table 44: Global US LED Industry Volume K Unit Forecast, by Indoor Lighting 2020 & 2033
- Table 45: Global US LED Industry Revenue billion Forecast, by Outdoor Lighting 2020 & 2033
- Table 46: Global US LED Industry Volume K Unit Forecast, by Outdoor Lighting 2020 & 2033
- Table 47: Global US LED Industry Revenue billion Forecast, by Automotive Utility Lighting 2020 & 2033
- Table 48: Global US LED Industry Volume K Unit Forecast, by Automotive Utility Lighting 2020 & 2033
- Table 49: Global US LED Industry Revenue billion Forecast, by Automotive Vehicle Lighting 2020 & 2033
- Table 50: Global US LED Industry Volume K Unit Forecast, by Automotive Vehicle Lighting 2020 & 2033
- Table 51: Global US LED Industry Revenue billion Forecast, by Country 2020 & 2033
- Table 52: Global US LED Industry Volume K Unit Forecast, by Country 2020 & 2033
- Table 53: United Kingdom US LED Industry Revenue (billion) Forecast, by Application 2020 & 2033
- Table 54: United Kingdom US LED Industry Volume (K Unit) Forecast, by Application 2020 & 2033
- Table 55: Germany US LED Industry Revenue (billion) Forecast, by Application 2020 & 2033
- Table 56: Germany US LED Industry Volume (K Unit) Forecast, by Application 2020 & 2033
- Table 57: France US LED Industry Revenue (billion) Forecast, by Application 2020 & 2033
- Table 58: France US LED Industry Volume (K Unit) Forecast, by Application 2020 & 2033
- Table 59: Italy US LED Industry Revenue (billion) Forecast, by Application 2020 & 2033
- Table 60: Italy US LED Industry Volume (K Unit) Forecast, by Application 2020 & 2033
- Table 61: Spain US LED Industry Revenue (billion) Forecast, by Application 2020 & 2033
- Table 62: Spain US LED Industry Volume (K Unit) Forecast, by Application 2020 & 2033
- Table 63: Russia US LED Industry Revenue (billion) Forecast, by Application 2020 & 2033
- Table 64: Russia US LED Industry Volume (K Unit) Forecast, by Application 2020 & 2033
- Table 65: Benelux US LED Industry Revenue (billion) Forecast, by Application 2020 & 2033
- Table 66: Benelux US LED Industry Volume (K Unit) Forecast, by Application 2020 & 2033
- Table 67: Nordics US LED Industry Revenue (billion) Forecast, by Application 2020 & 2033
- Table 68: Nordics US LED Industry Volume (K Unit) Forecast, by Application 2020 & 2033
- Table 69: Rest of Europe US LED Industry Revenue (billion) Forecast, by Application 2020 & 2033
- Table 70: Rest of Europe US LED Industry Volume (K Unit) Forecast, by Application 2020 & 2033
- Table 71: Global US LED Industry Revenue billion Forecast, by Indoor Lighting 2020 & 2033
- Table 72: Global US LED Industry Volume K Unit Forecast, by Indoor Lighting 2020 & 2033
- Table 73: Global US LED Industry Revenue billion Forecast, by Outdoor Lighting 2020 & 2033
- Table 74: Global US LED Industry Volume K Unit Forecast, by Outdoor Lighting 2020 & 2033
- Table 75: Global US LED Industry Revenue billion Forecast, by Automotive Utility Lighting 2020 & 2033
- Table 76: Global US LED Industry Volume K Unit Forecast, by Automotive Utility Lighting 2020 & 2033
- Table 77: Global US LED Industry Revenue billion Forecast, by Automotive Vehicle Lighting 2020 & 2033
- Table 78: Global US LED Industry Volume K Unit Forecast, by Automotive Vehicle Lighting 2020 & 2033
- Table 79: Global US LED Industry Revenue billion Forecast, by Country 2020 & 2033
- Table 80: Global US LED Industry Volume K Unit Forecast, by Country 2020 & 2033
- Table 81: Turkey US LED Industry Revenue (billion) Forecast, by Application 2020 & 2033
- Table 82: Turkey US LED Industry Volume (K Unit) Forecast, by Application 2020 & 2033
- Table 83: Israel US LED Industry Revenue (billion) Forecast, by Application 2020 & 2033
- Table 84: Israel US LED Industry Volume (K Unit) Forecast, by Application 2020 & 2033
- Table 85: GCC US LED Industry Revenue (billion) Forecast, by Application 2020 & 2033
- Table 86: GCC US LED Industry Volume (K Unit) Forecast, by Application 2020 & 2033
- Table 87: North Africa US LED Industry Revenue (billion) Forecast, by Application 2020 & 2033
- Table 88: North Africa US LED Industry Volume (K Unit) Forecast, by Application 2020 & 2033
- Table 89: South Africa US LED Industry Revenue (billion) Forecast, by Application 2020 & 2033
- Table 90: South Africa US LED Industry Volume (K Unit) Forecast, by Application 2020 & 2033
- Table 91: Rest of Middle East & Africa US LED Industry Revenue (billion) Forecast, by Application 2020 & 2033
- Table 92: Rest of Middle East & Africa US LED Industry Volume (K Unit) Forecast, by Application 2020 & 2033
- Table 93: Global US LED Industry Revenue billion Forecast, by Indoor Lighting 2020 & 2033
- Table 94: Global US LED Industry Volume K Unit Forecast, by Indoor Lighting 2020 & 2033
- Table 95: Global US LED Industry Revenue billion Forecast, by Outdoor Lighting 2020 & 2033
- Table 96: Global US LED Industry Volume K Unit Forecast, by Outdoor Lighting 2020 & 2033
- Table 97: Global US LED Industry Revenue billion Forecast, by Automotive Utility Lighting 2020 & 2033
- Table 98: Global US LED Industry Volume K Unit Forecast, by Automotive Utility Lighting 2020 & 2033
- Table 99: Global US LED Industry Revenue billion Forecast, by Automotive Vehicle Lighting 2020 & 2033
- Table 100: Global US LED Industry Volume K Unit Forecast, by Automotive Vehicle Lighting 2020 & 2033
- Table 101: Global US LED Industry Revenue billion Forecast, by Country 2020 & 2033
- Table 102: Global US LED Industry Volume K Unit Forecast, by Country 2020 & 2033
- Table 103: China US LED Industry Revenue (billion) Forecast, by Application 2020 & 2033
- Table 104: China US LED Industry Volume (K Unit) Forecast, by Application 2020 & 2033
- Table 105: India US LED Industry Revenue (billion) Forecast, by Application 2020 & 2033
- Table 106: India US LED Industry Volume (K Unit) Forecast, by Application 2020 & 2033
- Table 107: Japan US LED Industry Revenue (billion) Forecast, by Application 2020 & 2033
- Table 108: Japan US LED Industry Volume (K Unit) Forecast, by Application 2020 & 2033
- Table 109: South Korea US LED Industry Revenue (billion) Forecast, by Application 2020 & 2033
- Table 110: South Korea US LED Industry Volume (K Unit) Forecast, by Application 2020 & 2033
- Table 111: ASEAN US LED Industry Revenue (billion) Forecast, by Application 2020 & 2033
- Table 112: ASEAN US LED Industry Volume (K Unit) Forecast, by Application 2020 & 2033
- Table 113: Oceania US LED Industry Revenue (billion) Forecast, by Application 2020 & 2033
- Table 114: Oceania US LED Industry Volume (K Unit) Forecast, by Application 2020 & 2033
- Table 115: Rest of Asia Pacific US LED Industry Revenue (billion) Forecast, by Application 2020 & 2033
- Table 116: Rest of Asia Pacific US LED Industry Volume (K Unit) Forecast, by Application 2020 & 2033
Frequently Asked Questions
1. What is the projected Compound Annual Growth Rate (CAGR) of the US LED Industry?
The projected CAGR is approximately 5.06%.
2. Which companies are prominent players in the US LED Industry?
Key companies in the market include OSRAM GmbH, Koito Manufacturing Co Ltd, Dialight, ACUITY BRANDS INC, Grupo Antolin Irausa SA, NVC INTERNATIONAL HOLDINGS LIMITED, Current Lighting Solutions LLC, Marelli Holdings Co Ltd, Signify (Philips), Stanley Electric Co Lt.
3. What are the main segments of the US LED Industry?
The market segments include Indoor Lighting, Outdoor Lighting, Automotive Utility Lighting, Automotive Vehicle Lighting.
4. Can you provide details about the market size?
The market size is estimated to be USD 19.22 billion as of 2022.
5. What are some drivers contributing to market growth?
Enhanced Precision and Accuracy over Conventional Alternatives; Miniaturization of Component Parts.
6. What are the notable trends driving market growth?
OTHER KEY INDUSTRY TRENDS COVERED IN THE REPORT.
7. Are there any restraints impacting market growth?
Regulation Compliance Associated with Laser Usage.
8. Can you provide examples of recent developments in the market?
May 2023: Cyclone Lighting, a well-known manufacturer of outdoor luminaires, has announced the debut of its Elencia luminaire. Outdoor post-top lighting has an upscale look thanks to high-performance optics and revised, modern lantern style.May 2023: Dialight, a company in hazardous and industrial LED lighting innovation, has introduced the ProSite High Mast, an expansion of the company's extremely successful ProSite Floodlight range. This new model is carefully constructed to withstand mounting heights of up to 130 feet for a wide range of outdoor industrial applications such as airports, container yards, rail yards, product stockpiles, transportation, perimeter lighting, and parking applications. With a total lumen output of up to 65,000, the ProSite High Mast improves site security by providing uniform, crisp, and clear illumination.April 2023: Hydrel, an established innovator and producer of outdoor architectural and landscape lighting systems, announced the addition of the M9700 RGBW fixture to its M9000 ingrade luminaire family.
9. What pricing options are available for accessing the report?
Pricing options include single-user, multi-user, and enterprise licenses priced at USD 3800, USD 4500, and USD 5800 respectively.
10. Is the market size provided in terms of value or volume?
The market size is provided in terms of value, measured in billion and volume, measured in K Unit.
11. Are there any specific market keywords associated with the report?
Yes, the market keyword associated with the report is "US LED Industry," which aids in identifying and referencing the specific market segment covered.
12. How do I determine which pricing option suits my needs best?
The pricing options vary based on user requirements and access needs. Individual users may opt for single-user licenses, while businesses requiring broader access may choose multi-user or enterprise licenses for cost-effective access to the report.
13. Are there any additional resources or data provided in the US LED Industry report?
While the report offers comprehensive insights, it's advisable to review the specific contents or supplementary materials provided to ascertain if additional resources or data are available.
14. How can I stay updated on further developments or reports in the US LED Industry?
To stay informed about further developments, trends, and reports in the US LED Industry, consider subscribing to industry newsletters, following relevant companies and organizations, or regularly checking reputable industry news sources and publications.
Methodology
Step 1 - Identification of Relevant Samples Size from Population Database


Step 2 - Approaches for Defining Global Market Size (Value, Volume* & Price*)

Note*: In applicable scenarios
Step 3 - Data Sources
Primary Research
- Web Analytics
- Survey Reports
- Research Institute
- Latest Research Reports
- Opinion Leaders
Secondary Research
- Annual Reports
- White Paper
- Latest Press Release
- Industry Association
- Paid Database
- Investor Presentations

Step 4 - Data Triangulation
Involves using different sources of information in order to increase the validity of a study
These sources are likely to be stakeholders in a program - participants, other researchers, program staff, other community members, and so on.
Then we put all data in single framework & apply various statistical tools to find out the dynamic on the market.
During the analysis stage, feedback from the stakeholder groups would be compared to determine areas of agreement as well as areas of divergence