
Key Insights
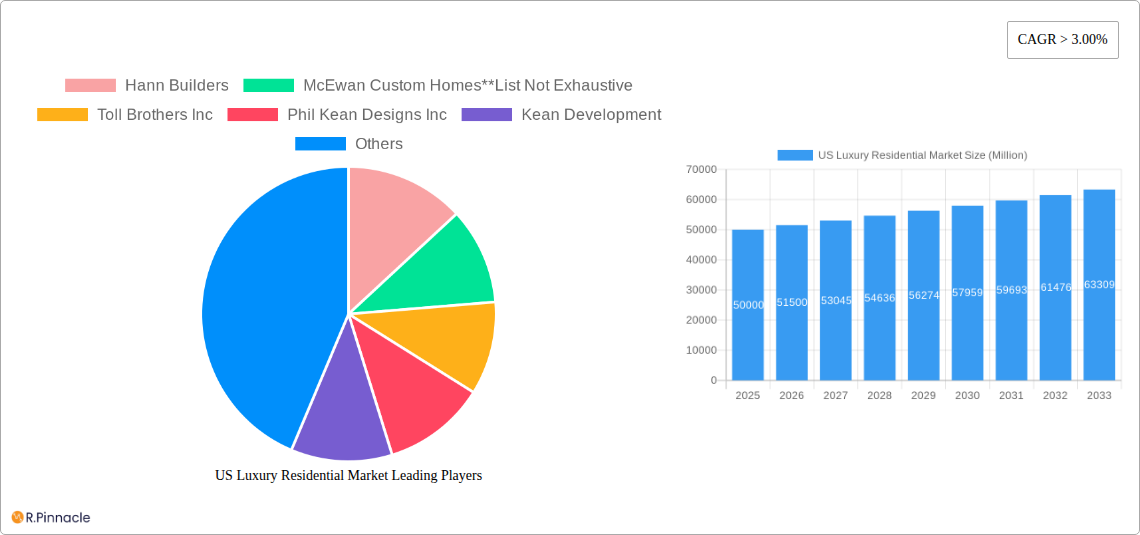
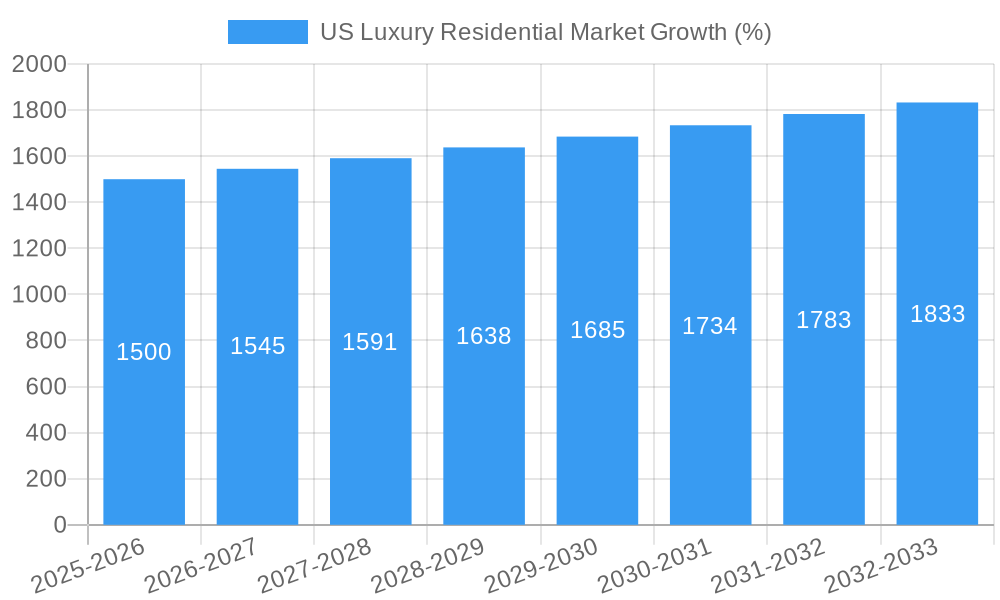
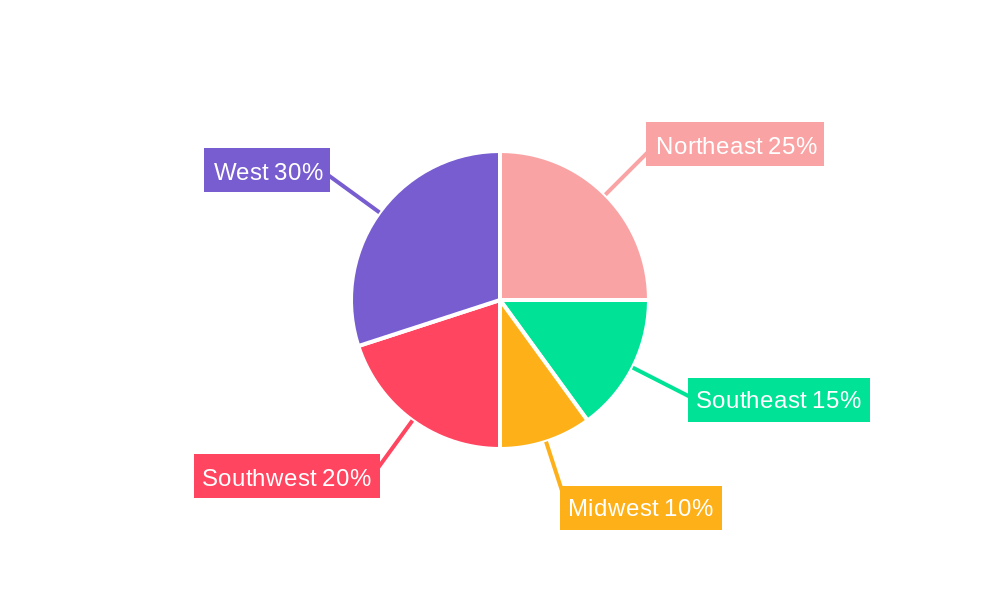
The US luxury residential market, encompassing apartments, condominiums, villas, and landed houses, is experiencing robust growth, with a Compound Annual Growth Rate (CAGR) exceeding 3.0% from 2019-2033. The market size in 2025 is estimated to be in the billions, considering typical luxury home prices and the expansive nature of the US market. Key drivers include increasing high-net-worth individuals, a preference for larger, high-amenity homes, and a persistent demand for luxury properties in prime locations like New York, Los Angeles, and San Francisco. Trends such as sustainable building practices, smart home technology integration, and the rise of experiential luxury (focus on lifestyle and amenities) further shape the market's trajectory. While rising construction costs and interest rates pose challenges, the resilient demand from affluent buyers ensures continued market expansion. Regional variations exist, with the Northeast, West, and Southwest likely demonstrating stronger growth than the Midwest and Southeast, reflecting existing wealth concentration and desirability of coastal locations. Competition among established luxury home builders like Toll Brothers and smaller, boutique firms like Phil Kean Designs contributes to market dynamism and innovation in design and construction.
The forecast period (2025-2033) anticipates a continuation of this positive trend, with a likely acceleration in growth during periods of economic stability. While the market faces potential headwinds from economic downturns or shifts in interest rates, the underlying demand for luxury housing in select prime locations remains consistently strong. The segmentation of the market by property type and city allows for a granular understanding of consumer preferences and regional dynamics. This segmentation also highlights opportunities for specialized builders and developers to cater to niche markets within the luxury residential sector. Further analysis could reveal specific insights into the impact of evolving demographics, technological advancements, and changes in urban planning on this dynamic sector.
US Luxury Residential Market Report: 2019-2033 Forecast
This comprehensive report provides an in-depth analysis of the US luxury residential market from 2019 to 2033, offering invaluable insights for industry professionals, investors, and strategists. The study covers market structure, dynamics, key players, and future growth prospects, with a focus on key segments and geographical areas. With a base year of 2025 and a forecast period spanning 2025-2033, this report is your essential guide to navigating the complexities of this lucrative market. The report uses Million as the unit of measure for all monetary values.
US Luxury Residential Market Structure & Innovation Trends
This section analyzes the competitive landscape of the US luxury residential market, examining market concentration, innovation drivers, regulatory influences, and market dynamics. We delve into end-user demographics and the impact of mergers and acquisitions (M&A) activities, providing crucial data on market share and M&A deal values. The historical period (2019-2024) serves as a foundation for understanding current trends and projecting future growth. The report reveals a moderately concentrated market, with key players holding significant market share. Innovation is driven by technological advancements in smart home technology, sustainable building materials, and design aesthetics catering to evolving luxury preferences. Regulatory frameworks, particularly zoning regulations and environmental standards, significantly impact development and pricing. Product substitutes, such as high-end rentals or alternative investment vehicles, also influence market dynamics. The estimated 2025 market size is valued at $xx Million. M&A activities have seen an average deal value of $xx Million in the recent years, consolidating market power among leading players.
- Market Concentration: High, with top 5 players accounting for approximately xx% of the market.
- Innovation Drivers: Smart home technology, sustainable building materials, personalized design.
- Regulatory Framework: Zoning regulations, environmental standards, building codes.
- M&A Activity: Average deal value of $xx Million in the historical period.
US Luxury Residential Market Dynamics & Trends
This section explores the key factors driving the growth of the US luxury residential market. We analyze market growth drivers, technological disruptions, evolving consumer preferences, and the competitive landscape. Key metrics such as the Compound Annual Growth Rate (CAGR) and market penetration rates are provided, offering a comprehensive understanding of market dynamics. The forecast period (2025-2033) projects a CAGR of xx%, driven by increasing high-net-worth individuals, demand for luxury amenities, and urbanization trends. Technological disruptions, including the integration of smart home technology and the rise of sustainable construction practices, are reshaping the market. Consumer preferences are shifting towards larger spaces, unique designs, and eco-friendly options. Intense competition among established players and new entrants further drives market evolution.
Dominant Regions & Segments in US Luxury Residential Market
This section identifies the leading regions and segments within the US luxury residential market. The analysis focuses on key city-level markets (New York, Los Angeles, San Francisco, Miami, Washington DC, and Other Cities) and property types (Apartments and Condominiums, Villas and Landed Houses). Key drivers are examined through detailed analysis of each dominant market, considering economic factors, infrastructure development, and other specific market dynamics.
By City: New York consistently leads the market, driven by high demand and limited supply. Los Angeles, San Francisco, and Miami also contribute significantly.
By Type: Villas and landed houses represent a larger market share due to higher price points and exclusivity.
Key Drivers: Strong economic growth in key cities, limited land availability, and investor interest.
New York: High demand, limited supply, strong economic growth.
Los Angeles: Desirable location, celebrity appeal, robust entertainment industry.
San Francisco: Technology boom, affluent population, limited housing stock.
Miami: International investment, warm climate, luxury lifestyle.
Washington D.C.: Political influence, high-income professionals.
Other Cities: Emerging markets with increasing demand for luxury properties.
US Luxury Residential Market Product Innovations
This section summarizes recent product developments and innovative applications in the US luxury residential market, highlighting technological trends and their impact on market competitiveness. The integration of smart home technology, the use of sustainable building materials, and the adoption of innovative architectural designs are reshaping the market, enhancing customer experience and adding value.
Report Scope & Segmentation Analysis
This report segments the US luxury residential market by property type (Apartments and Condominiums, Villas and Landed Houses) and by city (New York, Los Angeles, San Francisco, Miami, Washington DC, and Other Cities). Each segment is analyzed based on market size, growth projections, and competitive landscape, providing a granular understanding of market dynamics within each area. For example, the Villas and Landed Houses segment is expected to show stronger growth in the forecast period due to the increasing demand for larger, more private living spaces. The New York City market will remain dominant due to the high concentration of high-net-worth individuals and limited supply.
Key Drivers of US Luxury Residential Market Growth
The growth of the US luxury residential market is driven by a confluence of factors. Increasing high-net-worth individuals, coupled with robust economic growth in key cities, fuels demand for luxury properties. Low interest rates and favorable lending conditions historically further stimulate the market. Technological advancements in smart home technology and sustainable building materials enhance property value and appeal. Government policies supporting real estate development also play a role in overall market growth.
Challenges in the US Luxury Residential Market Sector
The US luxury residential market faces several challenges, including high construction costs, supply chain disruptions affecting material availability and labor shortages that influence project timelines and budgets. Stricter environmental regulations and zoning restrictions can also impact development costs. Furthermore, intense competition among established and emerging players necessitates continuous innovation and adaptation to changing market demands and customer expectations. These factors can lead to price volatility and potentially slow down market growth in certain periods.
Emerging Opportunities in US Luxury Residential Market
The US luxury residential market presents several promising opportunities. The rising demand for sustainable and eco-friendly homes creates opportunities for developers adopting green building practices. Smart home technology integration allows for premium pricing and improved tenant appeal. Emerging markets outside of traditional luxury hotspots offer potential for growth. Finally, catering to changing lifestyles and demands through innovative and flexible property designs will appeal to a wider range of buyers.
Leading Players in the US Luxury Residential Market Market
- Toll Brothers Inc
- Phil Kean Designs Inc
- Kean Development
- Calvis Wyant
- Wardell Builders
- D R Horton
- Haley Custom Homes
- Bob Thompson Homes
- Hann Builders
- McEwan Custom Homes
Key Developments in US Luxury Residential Market Industry
- 2022 Q4: Toll Brothers announces new luxury development in Miami.
- 2023 Q1: Increased adoption of smart home technology across multiple projects.
- 2023 Q2: Phil Kean Designs wins award for sustainable luxury villa design.
- 2024 Q3: Significant investment in luxury condo projects in New York City.
Future Outlook for US Luxury Residential Market Market
The US luxury residential market is poised for continued growth, driven by ongoing demand from high-net-worth individuals, technological advancements, and evolving consumer preferences. The market will likely witness increased focus on sustainable development and smart home integration. Strategic partnerships and mergers and acquisitions will likely continue shaping the market landscape. Emerging luxury markets will present new opportunities for expansion and growth.
US Luxury Residential Market Segmentation
-
1. Type
- 1.1. Apartments and Condominiums
- 1.2. Villas and Landed Houses
-
2. City
- 2.1. New York
- 2.2. Los Angeles
- 2.3. San Francisco
- 2.4. Miami
- 2.5. Washington DC
- 2.6. Other Cities
US Luxury Residential Market Segmentation By Geography
-
1. North America
- 1.1. United States
- 1.2. Canada
- 1.3. Mexico
-
2. South America
- 2.1. Brazil
- 2.2. Argentina
- 2.3. Rest of South America
-
3. Europe
- 3.1. United Kingdom
- 3.2. Germany
- 3.3. France
- 3.4. Italy
- 3.5. Spain
- 3.6. Russia
- 3.7. Benelux
- 3.8. Nordics
- 3.9. Rest of Europe
-
4. Middle East & Africa
- 4.1. Turkey
- 4.2. Israel
- 4.3. GCC
- 4.4. North Africa
- 4.5. South Africa
- 4.6. Rest of Middle East & Africa
-
5. Asia Pacific
- 5.1. China
- 5.2. India
- 5.3. Japan
- 5.4. South Korea
- 5.5. ASEAN
- 5.6. Oceania
- 5.7. Rest of Asia Pacific
US Luxury Residential Market REPORT HIGHLIGHTS
| Aspects | Details |
|---|---|
| Study Period | 2019-2033 |
| Base Year | 2024 |
| Estimated Year | 2025 |
| Forecast Period | 2025-2033 |
| Historical Period | 2019-2024 |
| Growth Rate | CAGR of > 3.00% from 2019-2033 |
| Segmentation |
|
Table of Contents
- 1. Introduction
- 1.1. Research Scope
- 1.2. Market Segmentation
- 1.3. Research Methodology
- 1.4. Definitions and Assumptions
- 2. Executive Summary
- 2.1. Introduction
- 3. Market Dynamics
- 3.1. Introduction
- 3.2. Market Drivers
- 3.2.1. Energy efficiency in construction; Flexibility and customization options
- 3.3. Market Restrains
- 3.3.1. Limited availability of suitable land for construction; Lower quality compared to traditional construction
- 3.4. Market Trends
- 3.4.1. Home Automation Becoming a Pre-requisite for Luxury Real Estate
- 4. Market Factor Analysis
- 4.1. Porters Five Forces
- 4.2. Supply/Value Chain
- 4.3. PESTEL analysis
- 4.4. Market Entropy
- 4.5. Patent/Trademark Analysis
- 5. Global US Luxury Residential Market Analysis, Insights and Forecast, 2019-2031
- 5.1. Market Analysis, Insights and Forecast - by Type
- 5.1.1. Apartments and Condominiums
- 5.1.2. Villas and Landed Houses
- 5.2. Market Analysis, Insights and Forecast - by City
- 5.2.1. New York
- 5.2.2. Los Angeles
- 5.2.3. San Francisco
- 5.2.4. Miami
- 5.2.5. Washington DC
- 5.2.6. Other Cities
- 5.3. Market Analysis, Insights and Forecast - by Region
- 5.3.1. North America
- 5.3.2. South America
- 5.3.3. Europe
- 5.3.4. Middle East & Africa
- 5.3.5. Asia Pacific
- 5.1. Market Analysis, Insights and Forecast - by Type
- 6. North America US Luxury Residential Market Analysis, Insights and Forecast, 2019-2031
- 6.1. Market Analysis, Insights and Forecast - by Type
- 6.1.1. Apartments and Condominiums
- 6.1.2. Villas and Landed Houses
- 6.2. Market Analysis, Insights and Forecast - by City
- 6.2.1. New York
- 6.2.2. Los Angeles
- 6.2.3. San Francisco
- 6.2.4. Miami
- 6.2.5. Washington DC
- 6.2.6. Other Cities
- 6.1. Market Analysis, Insights and Forecast - by Type
- 7. South America US Luxury Residential Market Analysis, Insights and Forecast, 2019-2031
- 7.1. Market Analysis, Insights and Forecast - by Type
- 7.1.1. Apartments and Condominiums
- 7.1.2. Villas and Landed Houses
- 7.2. Market Analysis, Insights and Forecast - by City
- 7.2.1. New York
- 7.2.2. Los Angeles
- 7.2.3. San Francisco
- 7.2.4. Miami
- 7.2.5. Washington DC
- 7.2.6. Other Cities
- 7.1. Market Analysis, Insights and Forecast - by Type
- 8. Europe US Luxury Residential Market Analysis, Insights and Forecast, 2019-2031
- 8.1. Market Analysis, Insights and Forecast - by Type
- 8.1.1. Apartments and Condominiums
- 8.1.2. Villas and Landed Houses
- 8.2. Market Analysis, Insights and Forecast - by City
- 8.2.1. New York
- 8.2.2. Los Angeles
- 8.2.3. San Francisco
- 8.2.4. Miami
- 8.2.5. Washington DC
- 8.2.6. Other Cities
- 8.1. Market Analysis, Insights and Forecast - by Type
- 9. Middle East & Africa US Luxury Residential Market Analysis, Insights and Forecast, 2019-2031
- 9.1. Market Analysis, Insights and Forecast - by Type
- 9.1.1. Apartments and Condominiums
- 9.1.2. Villas and Landed Houses
- 9.2. Market Analysis, Insights and Forecast - by City
- 9.2.1. New York
- 9.2.2. Los Angeles
- 9.2.3. San Francisco
- 9.2.4. Miami
- 9.2.5. Washington DC
- 9.2.6. Other Cities
- 9.1. Market Analysis, Insights and Forecast - by Type
- 10. Asia Pacific US Luxury Residential Market Analysis, Insights and Forecast, 2019-2031
- 10.1. Market Analysis, Insights and Forecast - by Type
- 10.1.1. Apartments and Condominiums
- 10.1.2. Villas and Landed Houses
- 10.2. Market Analysis, Insights and Forecast - by City
- 10.2.1. New York
- 10.2.2. Los Angeles
- 10.2.3. San Francisco
- 10.2.4. Miami
- 10.2.5. Washington DC
- 10.2.6. Other Cities
- 10.1. Market Analysis, Insights and Forecast - by Type
- 11. Northeast US Luxury Residential Market Analysis, Insights and Forecast, 2019-2031
- 12. Southeast US Luxury Residential Market Analysis, Insights and Forecast, 2019-2031
- 13. Midwest US Luxury Residential Market Analysis, Insights and Forecast, 2019-2031
- 14. Southwest US Luxury Residential Market Analysis, Insights and Forecast, 2019-2031
- 15. West US Luxury Residential Market Analysis, Insights and Forecast, 2019-2031
- 16. Competitive Analysis
- 16.1. Global Market Share Analysis 2024
- 16.2. Company Profiles
- 16.2.1 Hann Builders
- 16.2.1.1. Overview
- 16.2.1.2. Products
- 16.2.1.3. SWOT Analysis
- 16.2.1.4. Recent Developments
- 16.2.1.5. Financials (Based on Availability)
- 16.2.2 McEwan Custom Homes**List Not Exhaustive
- 16.2.2.1. Overview
- 16.2.2.2. Products
- 16.2.2.3. SWOT Analysis
- 16.2.2.4. Recent Developments
- 16.2.2.5. Financials (Based on Availability)
- 16.2.3 Toll Brothers Inc
- 16.2.3.1. Overview
- 16.2.3.2. Products
- 16.2.3.3. SWOT Analysis
- 16.2.3.4. Recent Developments
- 16.2.3.5. Financials (Based on Availability)
- 16.2.4 Phil Kean Designs Inc
- 16.2.4.1. Overview
- 16.2.4.2. Products
- 16.2.4.3. SWOT Analysis
- 16.2.4.4. Recent Developments
- 16.2.4.5. Financials (Based on Availability)
- 16.2.5 Kean Development
- 16.2.5.1. Overview
- 16.2.5.2. Products
- 16.2.5.3. SWOT Analysis
- 16.2.5.4. Recent Developments
- 16.2.5.5. Financials (Based on Availability)
- 16.2.6 Calvis Wyant
- 16.2.6.1. Overview
- 16.2.6.2. Products
- 16.2.6.3. SWOT Analysis
- 16.2.6.4. Recent Developments
- 16.2.6.5. Financials (Based on Availability)
- 16.2.7 Wardell Builders
- 16.2.7.1. Overview
- 16.2.7.2. Products
- 16.2.7.3. SWOT Analysis
- 16.2.7.4. Recent Developments
- 16.2.7.5. Financials (Based on Availability)
- 16.2.8 D R Horton
- 16.2.8.1. Overview
- 16.2.8.2. Products
- 16.2.8.3. SWOT Analysis
- 16.2.8.4. Recent Developments
- 16.2.8.5. Financials (Based on Availability)
- 16.2.9 Haley Custom Homes
- 16.2.9.1. Overview
- 16.2.9.2. Products
- 16.2.9.3. SWOT Analysis
- 16.2.9.4. Recent Developments
- 16.2.9.5. Financials (Based on Availability)
- 16.2.10 Bob Thompson Homes
- 16.2.10.1. Overview
- 16.2.10.2. Products
- 16.2.10.3. SWOT Analysis
- 16.2.10.4. Recent Developments
- 16.2.10.5. Financials (Based on Availability)
- 16.2.1 Hann Builders
List of Figures
- Figure 1: Global US Luxury Residential Market Revenue Breakdown (Million, %) by Region 2024 & 2032
- Figure 2: United states US Luxury Residential Market Revenue (Million), by Country 2024 & 2032
- Figure 3: United states US Luxury Residential Market Revenue Share (%), by Country 2024 & 2032
- Figure 4: North America US Luxury Residential Market Revenue (Million), by Type 2024 & 2032
- Figure 5: North America US Luxury Residential Market Revenue Share (%), by Type 2024 & 2032
- Figure 6: North America US Luxury Residential Market Revenue (Million), by City 2024 & 2032
- Figure 7: North America US Luxury Residential Market Revenue Share (%), by City 2024 & 2032
- Figure 8: North America US Luxury Residential Market Revenue (Million), by Country 2024 & 2032
- Figure 9: North America US Luxury Residential Market Revenue Share (%), by Country 2024 & 2032
- Figure 10: South America US Luxury Residential Market Revenue (Million), by Type 2024 & 2032
- Figure 11: South America US Luxury Residential Market Revenue Share (%), by Type 2024 & 2032
- Figure 12: South America US Luxury Residential Market Revenue (Million), by City 2024 & 2032
- Figure 13: South America US Luxury Residential Market Revenue Share (%), by City 2024 & 2032
- Figure 14: South America US Luxury Residential Market Revenue (Million), by Country 2024 & 2032
- Figure 15: South America US Luxury Residential Market Revenue Share (%), by Country 2024 & 2032
- Figure 16: Europe US Luxury Residential Market Revenue (Million), by Type 2024 & 2032
- Figure 17: Europe US Luxury Residential Market Revenue Share (%), by Type 2024 & 2032
- Figure 18: Europe US Luxury Residential Market Revenue (Million), by City 2024 & 2032
- Figure 19: Europe US Luxury Residential Market Revenue Share (%), by City 2024 & 2032
- Figure 20: Europe US Luxury Residential Market Revenue (Million), by Country 2024 & 2032
- Figure 21: Europe US Luxury Residential Market Revenue Share (%), by Country 2024 & 2032
- Figure 22: Middle East & Africa US Luxury Residential Market Revenue (Million), by Type 2024 & 2032
- Figure 23: Middle East & Africa US Luxury Residential Market Revenue Share (%), by Type 2024 & 2032
- Figure 24: Middle East & Africa US Luxury Residential Market Revenue (Million), by City 2024 & 2032
- Figure 25: Middle East & Africa US Luxury Residential Market Revenue Share (%), by City 2024 & 2032
- Figure 26: Middle East & Africa US Luxury Residential Market Revenue (Million), by Country 2024 & 2032
- Figure 27: Middle East & Africa US Luxury Residential Market Revenue Share (%), by Country 2024 & 2032
- Figure 28: Asia Pacific US Luxury Residential Market Revenue (Million), by Type 2024 & 2032
- Figure 29: Asia Pacific US Luxury Residential Market Revenue Share (%), by Type 2024 & 2032
- Figure 30: Asia Pacific US Luxury Residential Market Revenue (Million), by City 2024 & 2032
- Figure 31: Asia Pacific US Luxury Residential Market Revenue Share (%), by City 2024 & 2032
- Figure 32: Asia Pacific US Luxury Residential Market Revenue (Million), by Country 2024 & 2032
- Figure 33: Asia Pacific US Luxury Residential Market Revenue Share (%), by Country 2024 & 2032
List of Tables
- Table 1: Global US Luxury Residential Market Revenue Million Forecast, by Region 2019 & 2032
- Table 2: Global US Luxury Residential Market Revenue Million Forecast, by Type 2019 & 2032
- Table 3: Global US Luxury Residential Market Revenue Million Forecast, by City 2019 & 2032
- Table 4: Global US Luxury Residential Market Revenue Million Forecast, by Region 2019 & 2032
- Table 5: Global US Luxury Residential Market Revenue Million Forecast, by Country 2019 & 2032
- Table 6: Northeast US Luxury Residential Market Revenue (Million) Forecast, by Application 2019 & 2032
- Table 7: Southeast US Luxury Residential Market Revenue (Million) Forecast, by Application 2019 & 2032
- Table 8: Midwest US Luxury Residential Market Revenue (Million) Forecast, by Application 2019 & 2032
- Table 9: Southwest US Luxury Residential Market Revenue (Million) Forecast, by Application 2019 & 2032
- Table 10: West US Luxury Residential Market Revenue (Million) Forecast, by Application 2019 & 2032
- Table 11: Global US Luxury Residential Market Revenue Million Forecast, by Type 2019 & 2032
- Table 12: Global US Luxury Residential Market Revenue Million Forecast, by City 2019 & 2032
- Table 13: Global US Luxury Residential Market Revenue Million Forecast, by Country 2019 & 2032
- Table 14: United States US Luxury Residential Market Revenue (Million) Forecast, by Application 2019 & 2032
- Table 15: Canada US Luxury Residential Market Revenue (Million) Forecast, by Application 2019 & 2032
- Table 16: Mexico US Luxury Residential Market Revenue (Million) Forecast, by Application 2019 & 2032
- Table 17: Global US Luxury Residential Market Revenue Million Forecast, by Type 2019 & 2032
- Table 18: Global US Luxury Residential Market Revenue Million Forecast, by City 2019 & 2032
- Table 19: Global US Luxury Residential Market Revenue Million Forecast, by Country 2019 & 2032
- Table 20: Brazil US Luxury Residential Market Revenue (Million) Forecast, by Application 2019 & 2032
- Table 21: Argentina US Luxury Residential Market Revenue (Million) Forecast, by Application 2019 & 2032
- Table 22: Rest of South America US Luxury Residential Market Revenue (Million) Forecast, by Application 2019 & 2032
- Table 23: Global US Luxury Residential Market Revenue Million Forecast, by Type 2019 & 2032
- Table 24: Global US Luxury Residential Market Revenue Million Forecast, by City 2019 & 2032
- Table 25: Global US Luxury Residential Market Revenue Million Forecast, by Country 2019 & 2032
- Table 26: United Kingdom US Luxury Residential Market Revenue (Million) Forecast, by Application 2019 & 2032
- Table 27: Germany US Luxury Residential Market Revenue (Million) Forecast, by Application 2019 & 2032
- Table 28: France US Luxury Residential Market Revenue (Million) Forecast, by Application 2019 & 2032
- Table 29: Italy US Luxury Residential Market Revenue (Million) Forecast, by Application 2019 & 2032
- Table 30: Spain US Luxury Residential Market Revenue (Million) Forecast, by Application 2019 & 2032
- Table 31: Russia US Luxury Residential Market Revenue (Million) Forecast, by Application 2019 & 2032
- Table 32: Benelux US Luxury Residential Market Revenue (Million) Forecast, by Application 2019 & 2032
- Table 33: Nordics US Luxury Residential Market Revenue (Million) Forecast, by Application 2019 & 2032
- Table 34: Rest of Europe US Luxury Residential Market Revenue (Million) Forecast, by Application 2019 & 2032
- Table 35: Global US Luxury Residential Market Revenue Million Forecast, by Type 2019 & 2032
- Table 36: Global US Luxury Residential Market Revenue Million Forecast, by City 2019 & 2032
- Table 37: Global US Luxury Residential Market Revenue Million Forecast, by Country 2019 & 2032
- Table 38: Turkey US Luxury Residential Market Revenue (Million) Forecast, by Application 2019 & 2032
- Table 39: Israel US Luxury Residential Market Revenue (Million) Forecast, by Application 2019 & 2032
- Table 40: GCC US Luxury Residential Market Revenue (Million) Forecast, by Application 2019 & 2032
- Table 41: North Africa US Luxury Residential Market Revenue (Million) Forecast, by Application 2019 & 2032
- Table 42: South Africa US Luxury Residential Market Revenue (Million) Forecast, by Application 2019 & 2032
- Table 43: Rest of Middle East & Africa US Luxury Residential Market Revenue (Million) Forecast, by Application 2019 & 2032
- Table 44: Global US Luxury Residential Market Revenue Million Forecast, by Type 2019 & 2032
- Table 45: Global US Luxury Residential Market Revenue Million Forecast, by City 2019 & 2032
- Table 46: Global US Luxury Residential Market Revenue Million Forecast, by Country 2019 & 2032
- Table 47: China US Luxury Residential Market Revenue (Million) Forecast, by Application 2019 & 2032
- Table 48: India US Luxury Residential Market Revenue (Million) Forecast, by Application 2019 & 2032
- Table 49: Japan US Luxury Residential Market Revenue (Million) Forecast, by Application 2019 & 2032
- Table 50: South Korea US Luxury Residential Market Revenue (Million) Forecast, by Application 2019 & 2032
- Table 51: ASEAN US Luxury Residential Market Revenue (Million) Forecast, by Application 2019 & 2032
- Table 52: Oceania US Luxury Residential Market Revenue (Million) Forecast, by Application 2019 & 2032
- Table 53: Rest of Asia Pacific US Luxury Residential Market Revenue (Million) Forecast, by Application 2019 & 2032
Frequently Asked Questions
1. What is the projected Compound Annual Growth Rate (CAGR) of the US Luxury Residential Market?
The projected CAGR is approximately > 3.00%.
2. Which companies are prominent players in the US Luxury Residential Market?
Key companies in the market include Hann Builders, McEwan Custom Homes**List Not Exhaustive, Toll Brothers Inc, Phil Kean Designs Inc, Kean Development, Calvis Wyant, Wardell Builders, D R Horton, Haley Custom Homes, Bob Thompson Homes.
3. What are the main segments of the US Luxury Residential Market?
The market segments include Type, City.
4. Can you provide details about the market size?
The market size is estimated to be USD XX Million as of 2022.
5. What are some drivers contributing to market growth?
Energy efficiency in construction; Flexibility and customization options.
6. What are the notable trends driving market growth?
Home Automation Becoming a Pre-requisite for Luxury Real Estate.
7. Are there any restraints impacting market growth?
Limited availability of suitable land for construction; Lower quality compared to traditional construction.
8. Can you provide examples of recent developments in the market?
N/A
9. What pricing options are available for accessing the report?
Pricing options include single-user, multi-user, and enterprise licenses priced at USD 3800, USD 4500, and USD 5800 respectively.
10. Is the market size provided in terms of value or volume?
The market size is provided in terms of value, measured in Million.
11. Are there any specific market keywords associated with the report?
Yes, the market keyword associated with the report is "US Luxury Residential Market," which aids in identifying and referencing the specific market segment covered.
12. How do I determine which pricing option suits my needs best?
The pricing options vary based on user requirements and access needs. Individual users may opt for single-user licenses, while businesses requiring broader access may choose multi-user or enterprise licenses for cost-effective access to the report.
13. Are there any additional resources or data provided in the US Luxury Residential Market report?
While the report offers comprehensive insights, it's advisable to review the specific contents or supplementary materials provided to ascertain if additional resources or data are available.
14. How can I stay updated on further developments or reports in the US Luxury Residential Market?
To stay informed about further developments, trends, and reports in the US Luxury Residential Market, consider subscribing to industry newsletters, following relevant companies and organizations, or regularly checking reputable industry news sources and publications.
Methodology
Step 1 - Identification of Relevant Samples Size from Population Database


Step 2 - Approaches for Defining Global Market Size (Value, Volume* & Price*)

Note*: In applicable scenarios
Step 3 - Data Sources
Primary Research
- Web Analytics
- Survey Reports
- Research Institute
- Latest Research Reports
- Opinion Leaders
Secondary Research
- Annual Reports
- White Paper
- Latest Press Release
- Industry Association
- Paid Database
- Investor Presentations

Step 4 - Data Triangulation
Involves using different sources of information in order to increase the validity of a study
These sources are likely to be stakeholders in a program - participants, other researchers, program staff, other community members, and so on.
Then we put all data in single framework & apply various statistical tools to find out the dynamic on the market.
During the analysis stage, feedback from the stakeholder groups would be compared to determine areas of agreement as well as areas of divergence


