

Key Insights
The US Natural Gas Market is projected to reach $473.4 billion by 2025, with an anticipated Compound Annual Growth Rate (CAGR) of 3.5% between 2025 and 2033. Key growth drivers include escalating demand from the power generation sector, spurred by the shift from coal to natural gas-fueled combined cycle plants. The automotive sector's increasing adoption of Compressed Natural Gas (CNG) vehicles also presents a significant expansion opportunity, while residential and industrial consumption remain strong and consistent. The market is segmented by natural gas type (wet and dry) and end-use applications, including power generation, automotive, residential, and industrial sectors. Leading companies such as Occidental Petroleum, Shell, and ExxonMobil are strategically investing in exploration, production, and infrastructure to leverage this growth. Regional consumption patterns vary across the Northeast, Southeast, Midwest, Southwest, and West, influenced by population density, industrial activity, and climate. Potential growth constraints include environmental considerations and price volatility.
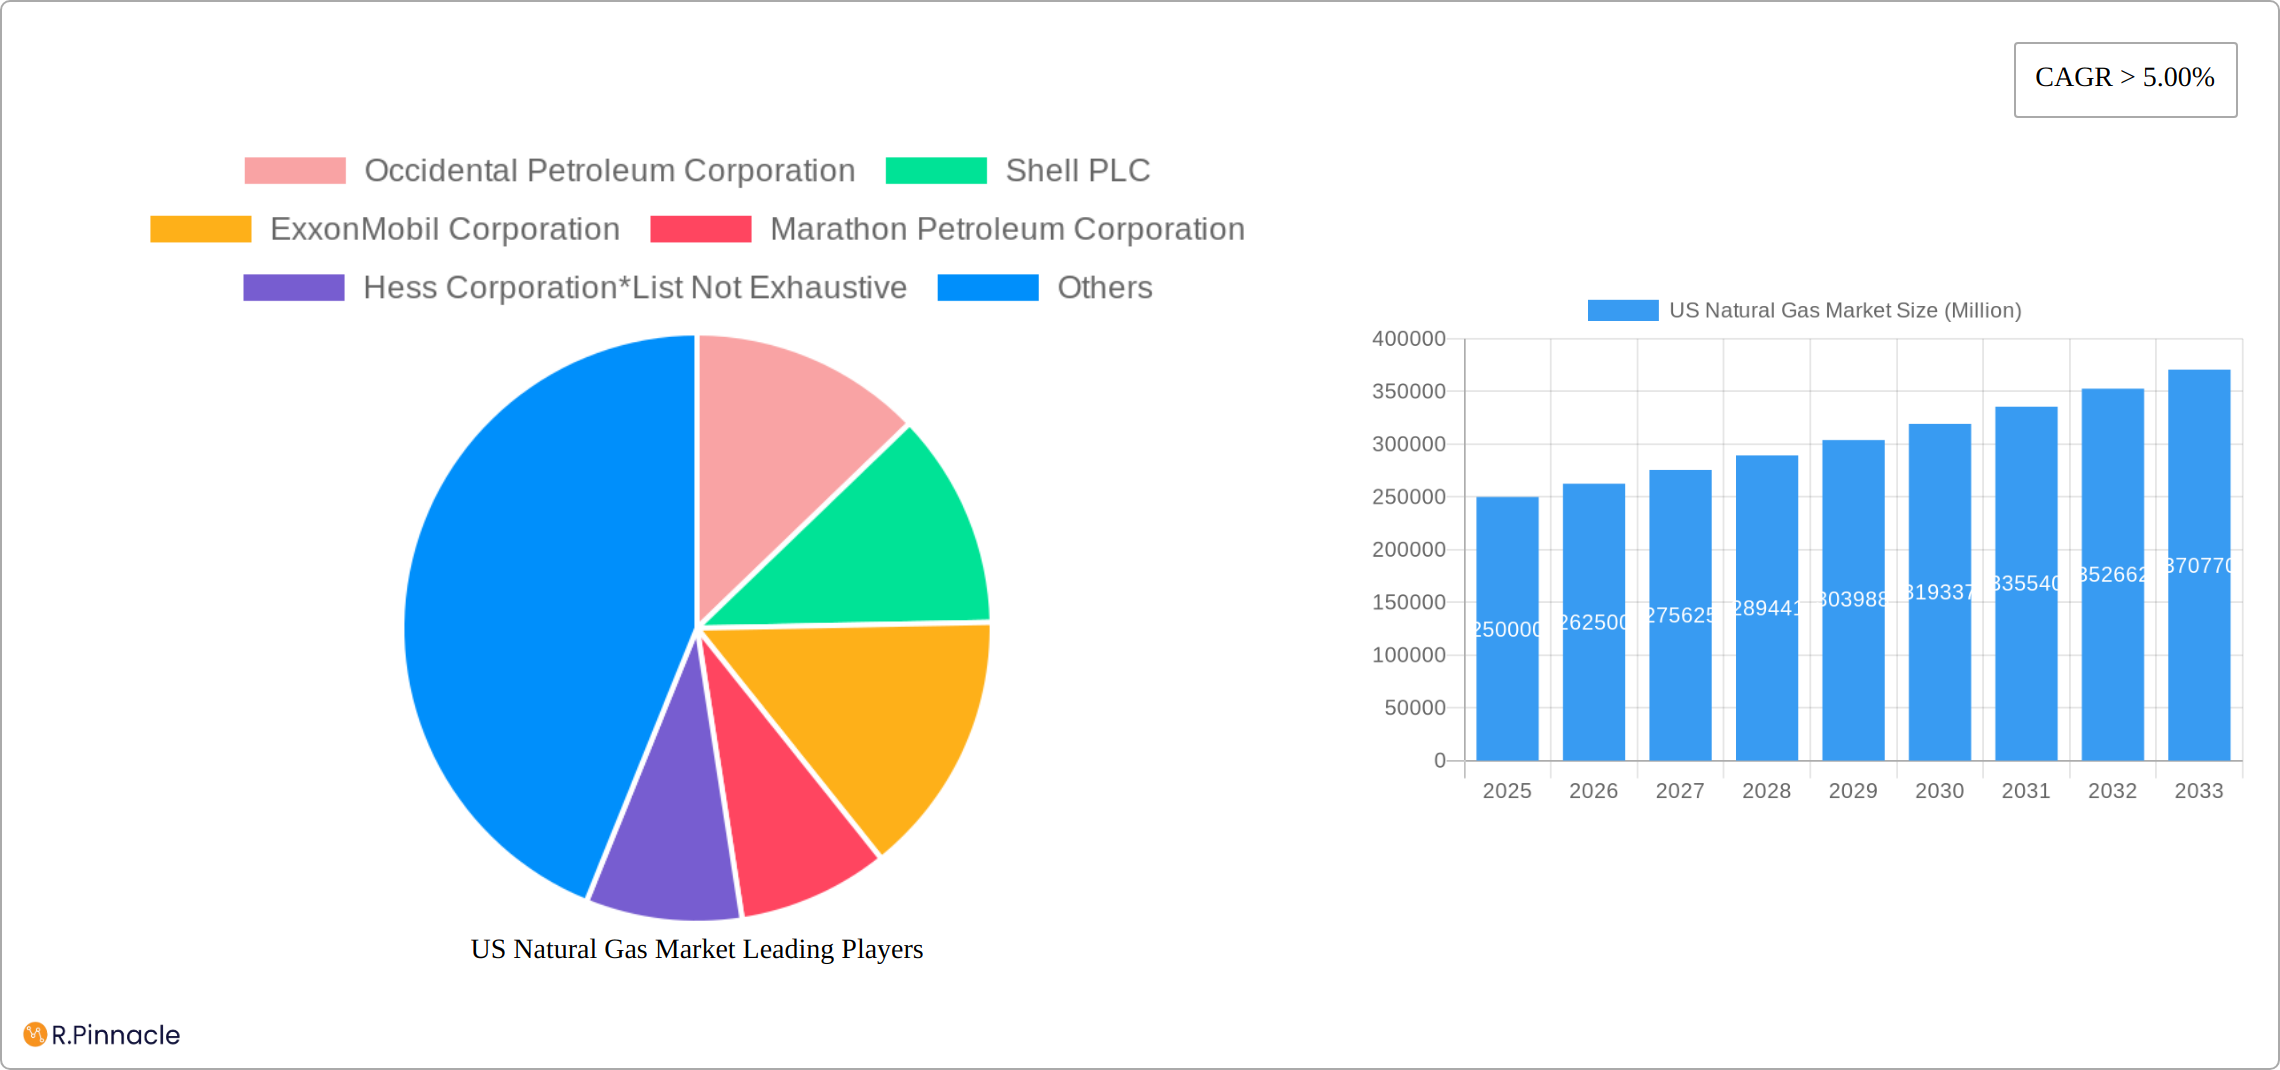
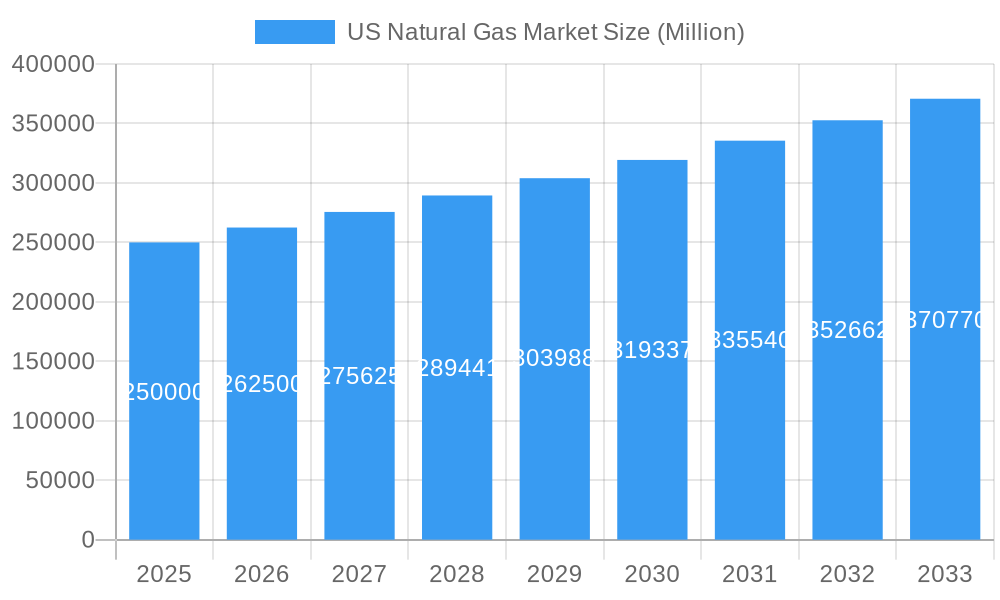
US Natural Gas Market Market Size (In Billion)
The forecast period (2025-2033) expects sustained market expansion, subject to economic conditions and policy changes. The historical period (2019-2024) offers insights into market dynamics. Continued investment in infrastructure, such as pipeline expansion, is vital for supporting projected growth and ensuring supply reliability. The competitive landscape demands efficiency, innovation, and diversification from major energy corporations for sustained market leadership. The US Natural Gas Market is thus positioned for continued expansion, offering opportunities and challenges to stakeholders across the value chain.
US Natural Gas Market Company Market Share
US Natural Gas Market Report: 2019-2033 Forecast
This comprehensive report provides an in-depth analysis of the US Natural Gas Market, covering historical data (2019-2024), the base year (2025), and a detailed forecast until 2033. It offers actionable insights for industry professionals, investors, and stakeholders seeking to understand the market's dynamics, growth drivers, and future potential. The report leverages key performance indicators (KPIs) and incorporates recent industry developments to provide a current and predictive view of the market.
US Natural Gas Market Structure & Innovation Trends
This section analyzes the competitive landscape of the US natural gas market, focusing on market concentration, innovation drivers, regulatory frameworks, and M&A activities. The analysis encompasses the following aspects:
Market Concentration: The US natural gas market exhibits a moderately concentrated structure with key players holding significant market share. Precise figures will be detailed in the full report, but initial estimations suggest that the top 10 players likely control xx% of the market, with significant variations across segments.
Innovation Drivers: Technological advancements in exploration, extraction, and processing, along with the growing demand for cleaner energy sources, are key innovation drivers. This includes advancements in hydraulic fracturing, pipeline technologies, and LNG export capabilities.
Regulatory Framework: Federal and state regulations significantly impact the market, including environmental regulations, pipeline safety standards, and pricing policies. The evolving regulatory landscape is a key consideration for market participants.
Product Substitutes: The market faces competition from renewable energy sources, such as solar and wind power, as well as alternative fuels. The report will provide a detailed assessment of the competitive pressures from these substitutes.
End-User Demographics: The report will analyze the consumption patterns of different end-users, including power generation, residential, industrial, and automotive sectors. The shifting demands of these sectors will be a key aspect of this analysis.
M&A Activities: Significant mergers and acquisitions have shaped the market landscape, and the report will analyze these deals, including their values and implications for market concentration. Examples of recent M&A activity involving companies like Occidental Petroleum Corporation, ExxonMobil Corporation, and Chevron Corporation will be analyzed.
US Natural Gas Market Market Dynamics & Trends
This section delves into the market's growth drivers, technological disruptions, consumer preferences, and competitive dynamics. Key aspects explored include:
The US natural gas market is projected to experience a compound annual growth rate (CAGR) of xx% during the forecast period (2025-2033). This growth is driven by several factors, including increasing industrial demand, particularly in the power generation sector, and the rising adoption of natural gas as a cleaner alternative to coal. However, the market also faces challenges, such as price volatility, environmental concerns, and the rise of renewable energy sources. Technological advancements, like improvements in drilling techniques and pipeline infrastructure, will influence the efficiency and competitiveness of the market. Consumer preferences for cleaner energy sources will also affect demand, potentially creating both opportunities and challenges. Competitive dynamics are shaped by the presence of major players like Occidental Petroleum Corporation, Shell PLC, ExxonMobil Corporation, and ConocoPhillips, leading to intense competition for market share and investment. Further analysis within the full report will provide a detailed breakdown of these factors and their quantitative impacts.
Dominant Regions & Segments in US Natural Gas Market
The US natural gas market exhibits significant regional and segmental variations in production, consumption, and market share. This section highlights the key players and factors influencing their dominance. A comprehensive analysis, detailed in the full report, explores these dynamics, considering factors such as production capacity, pipeline infrastructure, economic activity, consumption patterns, regulatory incentives, pricing, and the specific characteristics of wet and dry gas.
Dominant Regions: The Appalachian Basin, Permian Basin, and Haynesville Shale are major production regions, driven by prolific shale gas reserves and extensive pipeline infrastructure. The Gulf Coast region plays a critical role due to its substantial LNG export capacity and established downstream processing facilities. The full report provides a detailed breakdown of regional production and consumption, incorporating data on well counts, production volumes, and pipeline capacity utilization rates.
Dominant Segments: The power generation sector remains the largest consumer of natural gas, fueled by its role in electricity generation and the ongoing transition away from coal. The industrial sector also represents a significant demand segment, with natural gas used in various manufacturing processes and as a feedstock for petrochemicals. Residential and commercial sectors contribute a substantial portion of demand, especially during peak heating seasons. The full report quantifies the market share of each segment, analyzing trends in consumption and projected growth rates.
Key Drivers of Regional/Segment Dominance:
- Economic Policies: Government regulations, tax incentives, and environmental policies significantly influence production, transportation, and consumption of natural gas.
- Infrastructure: The extensive network of pipelines, processing plants, and LNG export terminals is crucial for efficient transportation and distribution of natural gas, shaping regional dominance.
- Technological Advancements: Hydraulic fracturing and horizontal drilling have revolutionized natural gas extraction, while advancements in pipeline technology and LNG liquefaction enhance transportation and export capabilities.
- Geopolitical Factors: Global energy markets, international trade agreements, and geopolitical stability impact both domestic and international natural gas prices and trade flows.
US Natural Gas Market Product Innovations
The US natural gas market is witnessing ongoing product innovation, driven by the need for increased efficiency, reduced emissions, and enhanced safety. This includes advancements in extraction technologies such as hydraulic fracturing, improved pipeline infrastructure, and the development of cleaner burning natural gas-based technologies for end-users. These innovations offer substantial competitive advantages to companies that can effectively implement and market them, leading to improved efficiency, cost reduction, and better market fit.
Report Scope & Segmentation Analysis
This report segments the US natural gas market based on type (Wet Natural Gas, Dry Natural Gas) and end-use (Power Generation, Automotive, Residential, Industries). Each segment's market size, growth projections, and competitive dynamics will be thoroughly analyzed within the full report.
Wet Natural Gas: Analysis will include market size, growth rate, and competitive landscape.
Dry Natural Gas: Analysis will include market size, growth rate, and competitive landscape.
Power Generation: Analysis will include market size, growth rate, and key players.
Automotive: Analysis will include market size, growth rate, and future prospects.
Residential: Analysis will include market size, growth rate, and key trends.
Industries: Analysis will include market size, growth rate, and major applications across various industrial sectors.
Key Drivers of US Natural Gas Market Growth
Several factors drive the growth of the US natural gas market. These include robust domestic production driven by technological advancements in extraction, the increasing demand for natural gas in power generation to displace coal, and supportive government policies promoting energy independence and security. Moreover, the growing adoption of natural gas in transportation and industrial applications is contributing to market expansion. Further analysis within the full report will offer a deeper quantitative analysis of each driver.
Challenges in the US Natural Gas Market Sector
The US natural gas market faces several challenges, including price volatility due to fluctuating supply and demand, environmental concerns related to methane emissions, and the increasing competition from renewable energy sources. Supply chain disruptions, including pipeline capacity constraints and labor shortages, further contribute to these challenges. The full report will quantify these impacts through detailed market analysis.
Emerging Opportunities in US Natural Gas Market
Emerging opportunities exist in the US natural gas market, driven by the increasing demand for cleaner energy solutions and technological advancements. The potential for exporting liquefied natural gas (LNG) to global markets presents significant opportunities. Further innovation in extraction and processing technologies could lead to cost reductions and improved efficiency, while the growing focus on sustainability will drive the development of technologies to minimize environmental impact.
Leading Players in the US Natural Gas Market Market
- Occidental Petroleum Corporation
- Shell PLC
- ExxonMobil Corporation
- Marathon Petroleum Corporation
- Hess Corporation
- ConocoPhillips
- Chevron Corporation
- TotalEnergies SE
- Phillips 66
- EOG Resources Inc
Key Developments in US Natural Gas Market Industry
May 2022: The US Energy Information Administration updated the Natural Gas Pipeline Project Tracker, reporting FERC approval of three projects to increase natural gas export capacity via pipelines and LNG. Two projects connecting LNG terminals in Louisiana were approved. The Evangeline Pass Expansion Project (1.1 Billion cubic feet) and the Plaquemines LNG Project (13.1 miles of new pipeline and two compressor stations) are key examples.
April 2022: TotalEnergies signed a Heads of Agreement to expand the Cameron LNG facility in Louisiana, adding a fourth train with a capacity of 6.75 Million metric tons per annum (Mtpa) and increasing existing train capacity by 5%.
Future Outlook for US Natural Gas Market Market
The future of the US natural gas market is promising, driven by continued technological advancements, increasing global demand for LNG, and the role of natural gas as a transition fuel in the shift towards a cleaner energy mix. However, successful navigation of the market will require strategic responses to the challenges related to environmental concerns and competition from renewable energy sources. The report will provide a thorough analysis of the predicted market trajectory, indicating potential growth areas and strategic opportunities for businesses to capitalize on.
US Natural Gas Market Segmentation
-
1. Type
- 1.1. Wet Natural Gas
- 1.2. Dry Natural Gas
-
2. End Use
- 2.1. Power Generation
- 2.2. Automotive
- 2.3. Residential
- 2.4. Industries
US Natural Gas Market Segmentation By Geography
-
1. North America
- 1.1. United States
- 1.2. Canada
- 1.3. Mexico
-
2. South America
- 2.1. Brazil
- 2.2. Argentina
- 2.3. Rest of South America
-
3. Europe
- 3.1. United Kingdom
- 3.2. Germany
- 3.3. France
- 3.4. Italy
- 3.5. Spain
- 3.6. Russia
- 3.7. Benelux
- 3.8. Nordics
- 3.9. Rest of Europe
-
4. Middle East & Africa
- 4.1. Turkey
- 4.2. Israel
- 4.3. GCC
- 4.4. North Africa
- 4.5. South Africa
- 4.6. Rest of Middle East & Africa
-
5. Asia Pacific
- 5.1. China
- 5.2. India
- 5.3. Japan
- 5.4. South Korea
- 5.5. ASEAN
- 5.6. Oceania
- 5.7. Rest of Asia Pacific
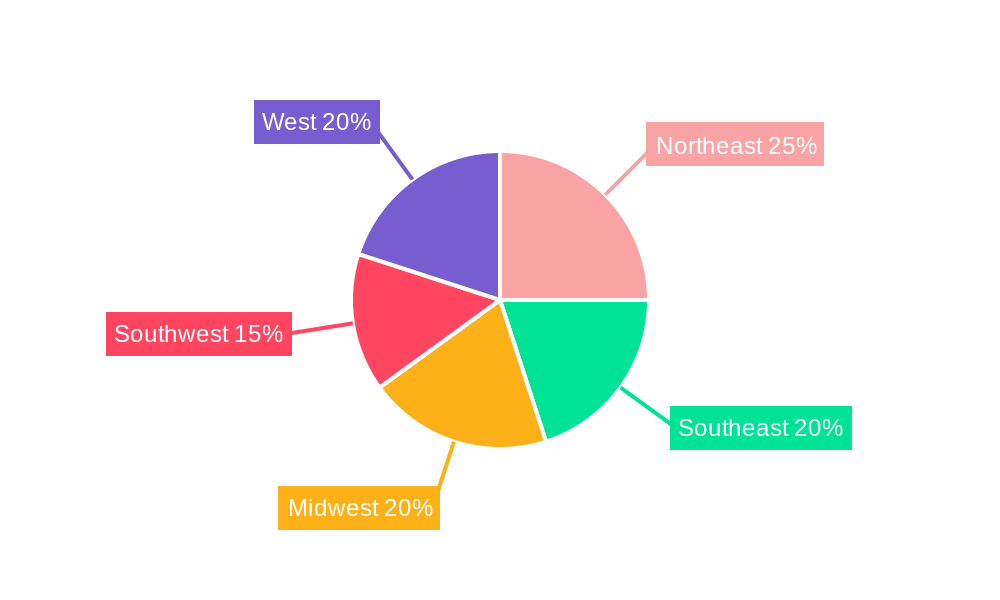
US Natural Gas Market Regional Market Share
Geographic Coverage of US Natural Gas Market
US Natural Gas Market REPORT HIGHLIGHTS
| Aspects | Details |
|---|---|
| Study Period | 2020-2034 |
| Base Year | 2025 |
| Estimated Year | 2026 |
| Forecast Period | 2026-2034 |
| Historical Period | 2020-2025 |
| Growth Rate | CAGR of 3.5% from 2020-2034 |
| Segmentation |
|
Table of Contents
- 1. Introduction
- 1.1. Research Scope
- 1.2. Market Segmentation
- 1.3. Research Objective
- 1.4. Definitions and Assumptions
- 2. Executive Summary
- 2.1. Market Snapshot
- 3. Market Dynamics
- 3.1. Market Drivers
- 3.2. Market Restrains
- 3.3. Market Trends
- 3.4. Market Opportunities
- 4. Market Factor Analysis
- 4.1. Porters Five Forces
- 4.1.1. Bargaining Power of Suppliers
- 4.1.2. Bargaining Power of Buyers
- 4.1.3. Threat of New Entrants
- 4.1.4. Threat of Substitutes
- 4.1.5. Competitive Rivalry
- 4.2. PESTEL analysis
- 4.3. BCG Analysis
- 4.3.1. Stars (High Growth, High Market Share)
- 4.3.2. Cash Cows (Low Growth, High Market Share)
- 4.3.3. Question Mark (High Growth, Low Market Share)
- 4.3.4. Dogs (Low Growth, Low Market Share)
- 4.4. Ansoff Matrix Analysis
- 4.5. Supply Chain Analysis
- 4.6. Regulatory Landscape
- 4.7. Current Market Potential and Opportunity Assessment (TAM–SAM–SOM Framework)
- 4.8. PRI Analyst Note
- 4.1. Porters Five Forces
- 5. Market Analysis, Insights and Forecast 2021-2033
- 5.1. Market Analysis, Insights and Forecast - by Type
- 5.1.1. Wet Natural Gas
- 5.1.2. Dry Natural Gas
- 5.2. Market Analysis, Insights and Forecast - by End Use
- 5.2.1. Power Generation
- 5.2.2. Automotive
- 5.2.3. Residential
- 5.2.4. Industries
- 5.3. Market Analysis, Insights and Forecast - by Region
- 5.3.1. North America
- 5.3.2. South America
- 5.3.3. Europe
- 5.3.4. Middle East & Africa
- 5.3.5. Asia Pacific
- 5.1. Market Analysis, Insights and Forecast - by Type
- 6. Global US Natural Gas Market Analysis, Insights and Forecast, 2021-2033
- 6.1. Market Analysis, Insights and Forecast - by Type
- 6.1.1. Wet Natural Gas
- 6.1.2. Dry Natural Gas
- 6.2. Market Analysis, Insights and Forecast - by End Use
- 6.2.1. Power Generation
- 6.2.2. Automotive
- 6.2.3. Residential
- 6.2.4. Industries
- 6.1. Market Analysis, Insights and Forecast - by Type
- 7. North America US Natural Gas Market Analysis, Insights and Forecast, 2020-2032
- 7.1. Market Analysis, Insights and Forecast - by Type
- 7.1.1. Wet Natural Gas
- 7.1.2. Dry Natural Gas
- 7.2. Market Analysis, Insights and Forecast - by End Use
- 7.2.1. Power Generation
- 7.2.2. Automotive
- 7.2.3. Residential
- 7.2.4. Industries
- 7.1. Market Analysis, Insights and Forecast - by Type
- 8. South America US Natural Gas Market Analysis, Insights and Forecast, 2020-2032
- 8.1. Market Analysis, Insights and Forecast - by Type
- 8.1.1. Wet Natural Gas
- 8.1.2. Dry Natural Gas
- 8.2. Market Analysis, Insights and Forecast - by End Use
- 8.2.1. Power Generation
- 8.2.2. Automotive
- 8.2.3. Residential
- 8.2.4. Industries
- 8.1. Market Analysis, Insights and Forecast - by Type
- 9. Europe US Natural Gas Market Analysis, Insights and Forecast, 2020-2032
- 9.1. Market Analysis, Insights and Forecast - by Type
- 9.1.1. Wet Natural Gas
- 9.1.2. Dry Natural Gas
- 9.2. Market Analysis, Insights and Forecast - by End Use
- 9.2.1. Power Generation
- 9.2.2. Automotive
- 9.2.3. Residential
- 9.2.4. Industries
- 9.1. Market Analysis, Insights and Forecast - by Type
- 10. Middle East & Africa US Natural Gas Market Analysis, Insights and Forecast, 2020-2032
- 10.1. Market Analysis, Insights and Forecast - by Type
- 10.1.1. Wet Natural Gas
- 10.1.2. Dry Natural Gas
- 10.2. Market Analysis, Insights and Forecast - by End Use
- 10.2.1. Power Generation
- 10.2.2. Automotive
- 10.2.3. Residential
- 10.2.4. Industries
- 10.1. Market Analysis, Insights and Forecast - by Type
- 11. Asia Pacific US Natural Gas Market Analysis, Insights and Forecast, 2020-2032
- 11.1. Market Analysis, Insights and Forecast - by Type
- 11.1.1. Wet Natural Gas
- 11.1.2. Dry Natural Gas
- 11.2. Market Analysis, Insights and Forecast - by End Use
- 11.2.1. Power Generation
- 11.2.2. Automotive
- 11.2.3. Residential
- 11.2.4. Industries
- 11.1. Market Analysis, Insights and Forecast - by Type
- 12. Competitive Analysis
- 12.1. Company Profiles
- 12.1.1 Occidental Petroleum Corporation
- 12.1.1.1. Company Overview
- 12.1.1.2. Products
- 12.1.1.3. Company Financials
- 12.1.1.4. SWOT Analysis
- 12.1.2 Shell PLC
- 12.1.2.1. Company Overview
- 12.1.2.2. Products
- 12.1.2.3. Company Financials
- 12.1.2.4. SWOT Analysis
- 12.1.3 ExxonMobil Corporation
- 12.1.3.1. Company Overview
- 12.1.3.2. Products
- 12.1.3.3. Company Financials
- 12.1.3.4. SWOT Analysis
- 12.1.4 Marathon Petroleum Corporation
- 12.1.4.1. Company Overview
- 12.1.4.2. Products
- 12.1.4.3. Company Financials
- 12.1.4.4. SWOT Analysis
- 12.1.5 Hess Corporation*List Not Exhaustive
- 12.1.5.1. Company Overview
- 12.1.5.2. Products
- 12.1.5.3. Company Financials
- 12.1.5.4. SWOT Analysis
- 12.1.6 ConocoPhillips
- 12.1.6.1. Company Overview
- 12.1.6.2. Products
- 12.1.6.3. Company Financials
- 12.1.6.4. SWOT Analysis
- 12.1.7 Chevron Corporation
- 12.1.7.1. Company Overview
- 12.1.7.2. Products
- 12.1.7.3. Company Financials
- 12.1.7.4. SWOT Analysis
- 12.1.8 TotalEnergies SE
- 12.1.8.1. Company Overview
- 12.1.8.2. Products
- 12.1.8.3. Company Financials
- 12.1.8.4. SWOT Analysis
- 12.1.9 Phillips
- 12.1.9.1. Company Overview
- 12.1.9.2. Products
- 12.1.9.3. Company Financials
- 12.1.9.4. SWOT Analysis
- 12.1.10 EOG Resources Inc
- 12.1.10.1. Company Overview
- 12.1.10.2. Products
- 12.1.10.3. Company Financials
- 12.1.10.4. SWOT Analysis
- 12.1.1 Occidental Petroleum Corporation
- 12.2. Market Entropy
- 12.2.1 Company's Key Areas Served
- 12.2.2 Recent Developments
- 12.3. Company Market Share Analysis 2025
- 12.3.1 Top 5 Companies Market Share Analysis
- 12.3.2 Top 3 Companies Market Share Analysis
- 12.4. List of Potential Customers
- 13. Research Methodology
List of Figures
- Figure 1: Global US Natural Gas Market Revenue Breakdown (billion, %) by Region 2025 & 2033
- Figure 2: Global US Natural Gas Market Volume Breakdown (Tonnes, %) by Region 2025 & 2033
- Figure 3: North America US Natural Gas Market Revenue (billion), by Type 2025 & 2033
- Figure 4: North America US Natural Gas Market Volume (Tonnes), by Type 2025 & 2033
- Figure 5: North America US Natural Gas Market Revenue Share (%), by Type 2025 & 2033
- Figure 6: North America US Natural Gas Market Volume Share (%), by Type 2025 & 2033
- Figure 7: North America US Natural Gas Market Revenue (billion), by End Use 2025 & 2033
- Figure 8: North America US Natural Gas Market Volume (Tonnes), by End Use 2025 & 2033
- Figure 9: North America US Natural Gas Market Revenue Share (%), by End Use 2025 & 2033
- Figure 10: North America US Natural Gas Market Volume Share (%), by End Use 2025 & 2033
- Figure 11: North America US Natural Gas Market Revenue (billion), by Country 2025 & 2033
- Figure 12: North America US Natural Gas Market Volume (Tonnes), by Country 2025 & 2033
- Figure 13: North America US Natural Gas Market Revenue Share (%), by Country 2025 & 2033
- Figure 14: North America US Natural Gas Market Volume Share (%), by Country 2025 & 2033
- Figure 15: South America US Natural Gas Market Revenue (billion), by Type 2025 & 2033
- Figure 16: South America US Natural Gas Market Volume (Tonnes), by Type 2025 & 2033
- Figure 17: South America US Natural Gas Market Revenue Share (%), by Type 2025 & 2033
- Figure 18: South America US Natural Gas Market Volume Share (%), by Type 2025 & 2033
- Figure 19: South America US Natural Gas Market Revenue (billion), by End Use 2025 & 2033
- Figure 20: South America US Natural Gas Market Volume (Tonnes), by End Use 2025 & 2033
- Figure 21: South America US Natural Gas Market Revenue Share (%), by End Use 2025 & 2033
- Figure 22: South America US Natural Gas Market Volume Share (%), by End Use 2025 & 2033
- Figure 23: South America US Natural Gas Market Revenue (billion), by Country 2025 & 2033
- Figure 24: South America US Natural Gas Market Volume (Tonnes), by Country 2025 & 2033
- Figure 25: South America US Natural Gas Market Revenue Share (%), by Country 2025 & 2033
- Figure 26: South America US Natural Gas Market Volume Share (%), by Country 2025 & 2033
- Figure 27: Europe US Natural Gas Market Revenue (billion), by Type 2025 & 2033
- Figure 28: Europe US Natural Gas Market Volume (Tonnes), by Type 2025 & 2033
- Figure 29: Europe US Natural Gas Market Revenue Share (%), by Type 2025 & 2033
- Figure 30: Europe US Natural Gas Market Volume Share (%), by Type 2025 & 2033
- Figure 31: Europe US Natural Gas Market Revenue (billion), by End Use 2025 & 2033
- Figure 32: Europe US Natural Gas Market Volume (Tonnes), by End Use 2025 & 2033
- Figure 33: Europe US Natural Gas Market Revenue Share (%), by End Use 2025 & 2033
- Figure 34: Europe US Natural Gas Market Volume Share (%), by End Use 2025 & 2033
- Figure 35: Europe US Natural Gas Market Revenue (billion), by Country 2025 & 2033
- Figure 36: Europe US Natural Gas Market Volume (Tonnes), by Country 2025 & 2033
- Figure 37: Europe US Natural Gas Market Revenue Share (%), by Country 2025 & 2033
- Figure 38: Europe US Natural Gas Market Volume Share (%), by Country 2025 & 2033
- Figure 39: Middle East & Africa US Natural Gas Market Revenue (billion), by Type 2025 & 2033
- Figure 40: Middle East & Africa US Natural Gas Market Volume (Tonnes), by Type 2025 & 2033
- Figure 41: Middle East & Africa US Natural Gas Market Revenue Share (%), by Type 2025 & 2033
- Figure 42: Middle East & Africa US Natural Gas Market Volume Share (%), by Type 2025 & 2033
- Figure 43: Middle East & Africa US Natural Gas Market Revenue (billion), by End Use 2025 & 2033
- Figure 44: Middle East & Africa US Natural Gas Market Volume (Tonnes), by End Use 2025 & 2033
- Figure 45: Middle East & Africa US Natural Gas Market Revenue Share (%), by End Use 2025 & 2033
- Figure 46: Middle East & Africa US Natural Gas Market Volume Share (%), by End Use 2025 & 2033
- Figure 47: Middle East & Africa US Natural Gas Market Revenue (billion), by Country 2025 & 2033
- Figure 48: Middle East & Africa US Natural Gas Market Volume (Tonnes), by Country 2025 & 2033
- Figure 49: Middle East & Africa US Natural Gas Market Revenue Share (%), by Country 2025 & 2033
- Figure 50: Middle East & Africa US Natural Gas Market Volume Share (%), by Country 2025 & 2033
- Figure 51: Asia Pacific US Natural Gas Market Revenue (billion), by Type 2025 & 2033
- Figure 52: Asia Pacific US Natural Gas Market Volume (Tonnes), by Type 2025 & 2033
- Figure 53: Asia Pacific US Natural Gas Market Revenue Share (%), by Type 2025 & 2033
- Figure 54: Asia Pacific US Natural Gas Market Volume Share (%), by Type 2025 & 2033
- Figure 55: Asia Pacific US Natural Gas Market Revenue (billion), by End Use 2025 & 2033
- Figure 56: Asia Pacific US Natural Gas Market Volume (Tonnes), by End Use 2025 & 2033
- Figure 57: Asia Pacific US Natural Gas Market Revenue Share (%), by End Use 2025 & 2033
- Figure 58: Asia Pacific US Natural Gas Market Volume Share (%), by End Use 2025 & 2033
- Figure 59: Asia Pacific US Natural Gas Market Revenue (billion), by Country 2025 & 2033
- Figure 60: Asia Pacific US Natural Gas Market Volume (Tonnes), by Country 2025 & 2033
- Figure 61: Asia Pacific US Natural Gas Market Revenue Share (%), by Country 2025 & 2033
- Figure 62: Asia Pacific US Natural Gas Market Volume Share (%), by Country 2025 & 2033
List of Tables
- Table 1: Global US Natural Gas Market Revenue billion Forecast, by Type 2020 & 2033
- Table 2: Global US Natural Gas Market Volume Tonnes Forecast, by Type 2020 & 2033
- Table 3: Global US Natural Gas Market Revenue billion Forecast, by End Use 2020 & 2033
- Table 4: Global US Natural Gas Market Volume Tonnes Forecast, by End Use 2020 & 2033
- Table 5: Global US Natural Gas Market Revenue billion Forecast, by Region 2020 & 2033
- Table 6: Global US Natural Gas Market Volume Tonnes Forecast, by Region 2020 & 2033
- Table 7: Global US Natural Gas Market Revenue billion Forecast, by Type 2020 & 2033
- Table 8: Global US Natural Gas Market Volume Tonnes Forecast, by Type 2020 & 2033
- Table 9: Global US Natural Gas Market Revenue billion Forecast, by End Use 2020 & 2033
- Table 10: Global US Natural Gas Market Volume Tonnes Forecast, by End Use 2020 & 2033
- Table 11: Global US Natural Gas Market Revenue billion Forecast, by Country 2020 & 2033
- Table 12: Global US Natural Gas Market Volume Tonnes Forecast, by Country 2020 & 2033
- Table 13: United States US Natural Gas Market Revenue (billion) Forecast, by Application 2020 & 2033
- Table 14: United States US Natural Gas Market Volume (Tonnes) Forecast, by Application 2020 & 2033
- Table 15: Canada US Natural Gas Market Revenue (billion) Forecast, by Application 2020 & 2033
- Table 16: Canada US Natural Gas Market Volume (Tonnes) Forecast, by Application 2020 & 2033
- Table 17: Mexico US Natural Gas Market Revenue (billion) Forecast, by Application 2020 & 2033
- Table 18: Mexico US Natural Gas Market Volume (Tonnes) Forecast, by Application 2020 & 2033
- Table 19: Global US Natural Gas Market Revenue billion Forecast, by Type 2020 & 2033
- Table 20: Global US Natural Gas Market Volume Tonnes Forecast, by Type 2020 & 2033
- Table 21: Global US Natural Gas Market Revenue billion Forecast, by End Use 2020 & 2033
- Table 22: Global US Natural Gas Market Volume Tonnes Forecast, by End Use 2020 & 2033
- Table 23: Global US Natural Gas Market Revenue billion Forecast, by Country 2020 & 2033
- Table 24: Global US Natural Gas Market Volume Tonnes Forecast, by Country 2020 & 2033
- Table 25: Brazil US Natural Gas Market Revenue (billion) Forecast, by Application 2020 & 2033
- Table 26: Brazil US Natural Gas Market Volume (Tonnes) Forecast, by Application 2020 & 2033
- Table 27: Argentina US Natural Gas Market Revenue (billion) Forecast, by Application 2020 & 2033
- Table 28: Argentina US Natural Gas Market Volume (Tonnes) Forecast, by Application 2020 & 2033
- Table 29: Rest of South America US Natural Gas Market Revenue (billion) Forecast, by Application 2020 & 2033
- Table 30: Rest of South America US Natural Gas Market Volume (Tonnes) Forecast, by Application 2020 & 2033
- Table 31: Global US Natural Gas Market Revenue billion Forecast, by Type 2020 & 2033
- Table 32: Global US Natural Gas Market Volume Tonnes Forecast, by Type 2020 & 2033
- Table 33: Global US Natural Gas Market Revenue billion Forecast, by End Use 2020 & 2033
- Table 34: Global US Natural Gas Market Volume Tonnes Forecast, by End Use 2020 & 2033
- Table 35: Global US Natural Gas Market Revenue billion Forecast, by Country 2020 & 2033
- Table 36: Global US Natural Gas Market Volume Tonnes Forecast, by Country 2020 & 2033
- Table 37: United Kingdom US Natural Gas Market Revenue (billion) Forecast, by Application 2020 & 2033
- Table 38: United Kingdom US Natural Gas Market Volume (Tonnes) Forecast, by Application 2020 & 2033
- Table 39: Germany US Natural Gas Market Revenue (billion) Forecast, by Application 2020 & 2033
- Table 40: Germany US Natural Gas Market Volume (Tonnes) Forecast, by Application 2020 & 2033
- Table 41: France US Natural Gas Market Revenue (billion) Forecast, by Application 2020 & 2033
- Table 42: France US Natural Gas Market Volume (Tonnes) Forecast, by Application 2020 & 2033
- Table 43: Italy US Natural Gas Market Revenue (billion) Forecast, by Application 2020 & 2033
- Table 44: Italy US Natural Gas Market Volume (Tonnes) Forecast, by Application 2020 & 2033
- Table 45: Spain US Natural Gas Market Revenue (billion) Forecast, by Application 2020 & 2033
- Table 46: Spain US Natural Gas Market Volume (Tonnes) Forecast, by Application 2020 & 2033
- Table 47: Russia US Natural Gas Market Revenue (billion) Forecast, by Application 2020 & 2033
- Table 48: Russia US Natural Gas Market Volume (Tonnes) Forecast, by Application 2020 & 2033
- Table 49: Benelux US Natural Gas Market Revenue (billion) Forecast, by Application 2020 & 2033
- Table 50: Benelux US Natural Gas Market Volume (Tonnes) Forecast, by Application 2020 & 2033
- Table 51: Nordics US Natural Gas Market Revenue (billion) Forecast, by Application 2020 & 2033
- Table 52: Nordics US Natural Gas Market Volume (Tonnes) Forecast, by Application 2020 & 2033
- Table 53: Rest of Europe US Natural Gas Market Revenue (billion) Forecast, by Application 2020 & 2033
- Table 54: Rest of Europe US Natural Gas Market Volume (Tonnes) Forecast, by Application 2020 & 2033
- Table 55: Global US Natural Gas Market Revenue billion Forecast, by Type 2020 & 2033
- Table 56: Global US Natural Gas Market Volume Tonnes Forecast, by Type 2020 & 2033
- Table 57: Global US Natural Gas Market Revenue billion Forecast, by End Use 2020 & 2033
- Table 58: Global US Natural Gas Market Volume Tonnes Forecast, by End Use 2020 & 2033
- Table 59: Global US Natural Gas Market Revenue billion Forecast, by Country 2020 & 2033
- Table 60: Global US Natural Gas Market Volume Tonnes Forecast, by Country 2020 & 2033
- Table 61: Turkey US Natural Gas Market Revenue (billion) Forecast, by Application 2020 & 2033
- Table 62: Turkey US Natural Gas Market Volume (Tonnes) Forecast, by Application 2020 & 2033
- Table 63: Israel US Natural Gas Market Revenue (billion) Forecast, by Application 2020 & 2033
- Table 64: Israel US Natural Gas Market Volume (Tonnes) Forecast, by Application 2020 & 2033
- Table 65: GCC US Natural Gas Market Revenue (billion) Forecast, by Application 2020 & 2033
- Table 66: GCC US Natural Gas Market Volume (Tonnes) Forecast, by Application 2020 & 2033
- Table 67: North Africa US Natural Gas Market Revenue (billion) Forecast, by Application 2020 & 2033
- Table 68: North Africa US Natural Gas Market Volume (Tonnes) Forecast, by Application 2020 & 2033
- Table 69: South Africa US Natural Gas Market Revenue (billion) Forecast, by Application 2020 & 2033
- Table 70: South Africa US Natural Gas Market Volume (Tonnes) Forecast, by Application 2020 & 2033
- Table 71: Rest of Middle East & Africa US Natural Gas Market Revenue (billion) Forecast, by Application 2020 & 2033
- Table 72: Rest of Middle East & Africa US Natural Gas Market Volume (Tonnes) Forecast, by Application 2020 & 2033
- Table 73: Global US Natural Gas Market Revenue billion Forecast, by Type 2020 & 2033
- Table 74: Global US Natural Gas Market Volume Tonnes Forecast, by Type 2020 & 2033
- Table 75: Global US Natural Gas Market Revenue billion Forecast, by End Use 2020 & 2033
- Table 76: Global US Natural Gas Market Volume Tonnes Forecast, by End Use 2020 & 2033
- Table 77: Global US Natural Gas Market Revenue billion Forecast, by Country 2020 & 2033
- Table 78: Global US Natural Gas Market Volume Tonnes Forecast, by Country 2020 & 2033
- Table 79: China US Natural Gas Market Revenue (billion) Forecast, by Application 2020 & 2033
- Table 80: China US Natural Gas Market Volume (Tonnes) Forecast, by Application 2020 & 2033
- Table 81: India US Natural Gas Market Revenue (billion) Forecast, by Application 2020 & 2033
- Table 82: India US Natural Gas Market Volume (Tonnes) Forecast, by Application 2020 & 2033
- Table 83: Japan US Natural Gas Market Revenue (billion) Forecast, by Application 2020 & 2033
- Table 84: Japan US Natural Gas Market Volume (Tonnes) Forecast, by Application 2020 & 2033
- Table 85: South Korea US Natural Gas Market Revenue (billion) Forecast, by Application 2020 & 2033
- Table 86: South Korea US Natural Gas Market Volume (Tonnes) Forecast, by Application 2020 & 2033
- Table 87: ASEAN US Natural Gas Market Revenue (billion) Forecast, by Application 2020 & 2033
- Table 88: ASEAN US Natural Gas Market Volume (Tonnes) Forecast, by Application 2020 & 2033
- Table 89: Oceania US Natural Gas Market Revenue (billion) Forecast, by Application 2020 & 2033
- Table 90: Oceania US Natural Gas Market Volume (Tonnes) Forecast, by Application 2020 & 2033
- Table 91: Rest of Asia Pacific US Natural Gas Market Revenue (billion) Forecast, by Application 2020 & 2033
- Table 92: Rest of Asia Pacific US Natural Gas Market Volume (Tonnes) Forecast, by Application 2020 & 2033
Frequently Asked Questions
1. What is the projected Compound Annual Growth Rate (CAGR) of the US Natural Gas Market?
The projected CAGR is approximately 3.5%.
2. Which companies are prominent players in the US Natural Gas Market?
Key companies in the market include Occidental Petroleum Corporation, Shell PLC, ExxonMobil Corporation, Marathon Petroleum Corporation, Hess Corporation*List Not Exhaustive, ConocoPhillips, Chevron Corporation, TotalEnergies SE, Phillips, EOG Resources Inc.
3. What are the main segments of the US Natural Gas Market?
The market segments include Type, End Use.
4. Can you provide details about the market size?
The market size is estimated to be USD 473.4 billion as of 2022.
5. What are some drivers contributing to market growth?
Increasing Global Demand for Refined Petroleum Products4.; Economic Growth and Industrialization.
6. What are the notable trends driving market growth?
Power Generation Segment to Dominate the Market.
7. Are there any restraints impacting market growth?
Environmental Concerns and Regulations.
8. Can you provide examples of recent developments in the market?
May 2022: According to the US Energy Information Administration, the Natural Gas Pipeline Project Tracker was updated with recent approvals and completions of pipeline projects. As of the end of the first quarter of 2022, the Federal Energy Regulatory Commission (FERC) approved three projects to increase the export of US natural gas by pipeline and LNG. FERC approved two projects connecting LNG terminals in Louisiana. The Evangeline Pass Expansion Project, owned by Tennessee Gas Pipeline Company, is 1.1 billion cubic feet in size. It is intended that the proposed Plaquemines LNG Project in Plaquemines Parish, Louisiana, be supplied with natural gas by constructing 13.1 miles of new pipeline and two new compressor stations.
9. What pricing options are available for accessing the report?
Pricing options include single-user, multi-user, and enterprise licenses priced at USD 3800, USD 4500, and USD 5800 respectively.
10. Is the market size provided in terms of value or volume?
The market size is provided in terms of value, measured in billion and volume, measured in Tonnes.
11. Are there any specific market keywords associated with the report?
Yes, the market keyword associated with the report is "US Natural Gas Market," which aids in identifying and referencing the specific market segment covered.
12. How do I determine which pricing option suits my needs best?
The pricing options vary based on user requirements and access needs. Individual users may opt for single-user licenses, while businesses requiring broader access may choose multi-user or enterprise licenses for cost-effective access to the report.
13. Are there any additional resources or data provided in the US Natural Gas Market report?
While the report offers comprehensive insights, it's advisable to review the specific contents or supplementary materials provided to ascertain if additional resources or data are available.
14. How can I stay updated on further developments or reports in the US Natural Gas Market?
To stay informed about further developments, trends, and reports in the US Natural Gas Market, consider subscribing to industry newsletters, following relevant companies and organizations, or regularly checking reputable industry news sources and publications.
Methodology
Step 1 - Identification of Relevant Samples Size from Population Database


Step 2 - Approaches for Defining Global Market Size (Value, Volume* & Price*)

Note*: In applicable scenarios
Step 3 - Data Sources
Primary Research
- Web Analytics
- Survey Reports
- Research Institute
- Latest Research Reports
- Opinion Leaders
Secondary Research
- Annual Reports
- White Paper
- Latest Press Release
- Industry Association
- Paid Database
- Investor Presentations

Step 4 - Data Triangulation
Involves using different sources of information in order to increase the validity of a study
These sources are likely to be stakeholders in a program - participants, other researchers, program staff, other community members, and so on.
Then we put all data in single framework & apply various statistical tools to find out the dynamic on the market.
During the analysis stage, feedback from the stakeholder groups would be compared to determine areas of agreement as well as areas of divergence