

Key Insights
The United States pressure-sensitive adhesives (PSA) market is poised for substantial expansion. Projected to reach $9.9 billion by 2025, the market is expected to witness a Compound Annual Growth Rate (CAGR) of over 6% through 2033. This robust growth is attributed to increasing demand from key sectors including packaging, particularly for e-commerce and consumer goods, where reliable sealing and labeling are paramount. The expanding medical device industry also drives demand for specialized, biocompatible PSAs used in applications like wound care and drug delivery. Innovations in PSA technology, such as the development of water-based and eco-friendly formulations, are further stimulating market adoption and addressing growing sustainability mandates. The construction and woodworking sectors are also significant contributors, leveraging PSAs for tapes, labels, and decorative applications.
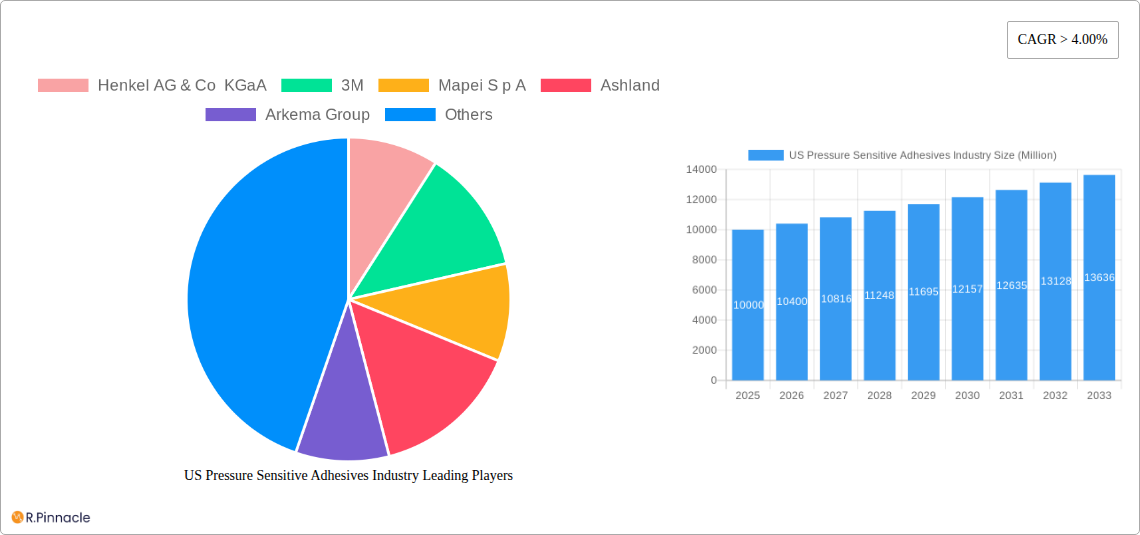
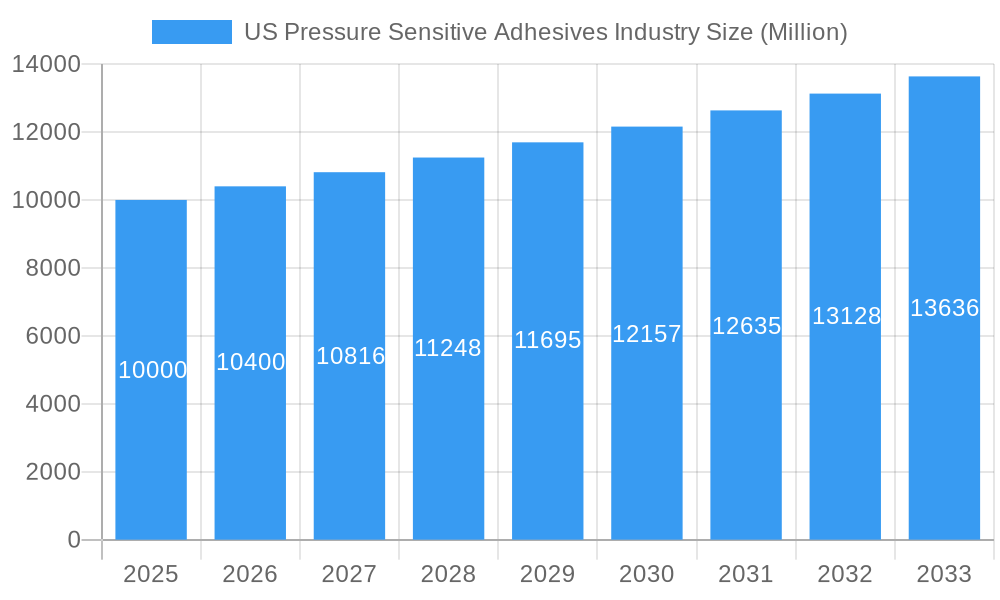
US Pressure Sensitive Adhesives Industry Market Size (In Billion)
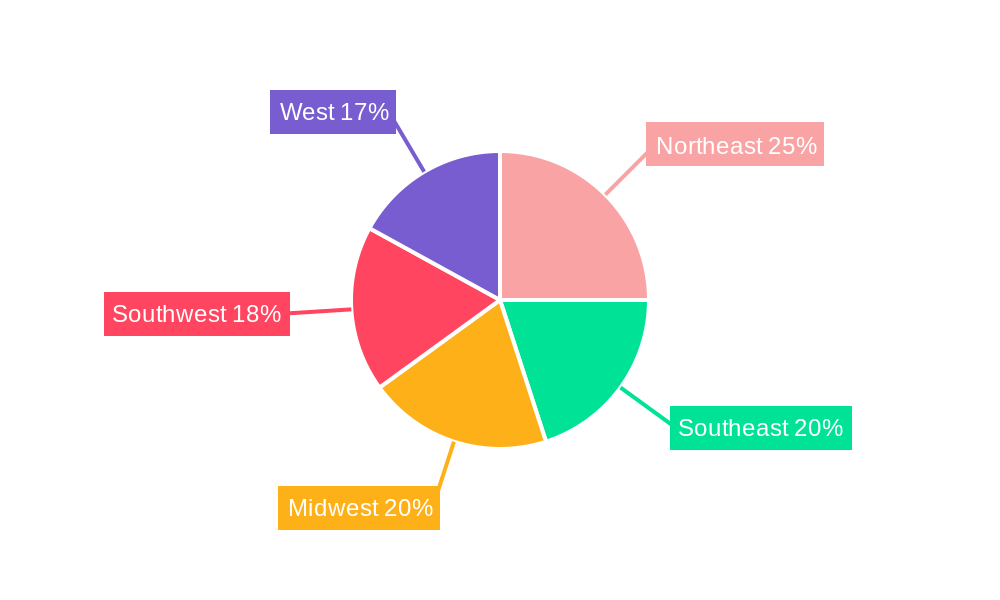
Key challenges impacting the market include volatility in raw material pricing, which affects profitability. Stringent environmental regulations concerning volatile organic compounds (VOCs) are accelerating the shift towards sustainable PSA alternatives. Intense competition among leading manufacturers necessitates ongoing product innovation and differentiation. Despite these challenges, the market's growth trajectory remains strong, supported by diverse applications and escalating demand across major industries. All major US regions, including Northeast, Southeast, Midwest, Southwest, and West, are experiencing consistent growth, indicating a widespread market expansion. Technological advancements in areas such as hot melt and radiation-cured PSAs are anticipated to fuel further growth and penetration into specialized market segments.
US Pressure Sensitive Adhesives Industry Company Market Share
US Pressure Sensitive Adhesives Industry Report: 2019-2033 Forecast
This comprehensive report provides a detailed analysis of the US pressure sensitive adhesives (PSA) industry, offering invaluable insights for industry professionals, investors, and strategic planners. Covering the period 2019-2033, with a focus on 2025, this report unravels market dynamics, growth drivers, and future trends, equipping you with the knowledge to navigate this dynamic sector.
US Pressure Sensitive Adhesives Industry Market Structure & Innovation Trends
The US pressure sensitive adhesives market is moderately concentrated, with key players like Henkel AG & Co KGaA, 3M, Mapei S p A, Ashland, Arkema Group, Dow, H B Fuller Company, Franklin International, Sika AG, Jowat SE, and Wacker Chemie AG holding significant market share. However, the presence of numerous smaller players fosters competition. Innovation is driven by the need for sustainable, high-performance adhesives across diverse applications. Stringent environmental regulations are shaping product development towards water-based and bio-based alternatives. The market witnesses regular M&A activities, with deal values exceeding $xx Million in recent years, primarily focused on expanding product portfolios and market reach. Market share fluctuates, with the top 5 players holding approximately 60% of the market in 2025. End-user demographics are shifting towards greater demand from the electronics and medical sectors.
- Market Concentration: Moderately concentrated, with top players holding ~60% market share in 2025.
- Innovation Drivers: Sustainability, performance enhancement, regulatory compliance.
- M&A Activity: Significant activity, with deal values exceeding $xx Million annually.
- Product Substitutes: Emerging bio-based adhesives and alternative bonding technologies pose a competitive threat.
US Pressure Sensitive Adhesives Industry Market Dynamics & Trends
The US pressure sensitive adhesives market exhibits robust growth, driven by increasing demand across various end-use sectors. The packaging industry remains a significant driver, fueled by the e-commerce boom and the demand for efficient, secure packaging solutions. Technological advancements, particularly in hot melt and water-based adhesives, are enhancing performance characteristics and expanding application possibilities. Consumer preferences are shifting towards eco-friendly and sustainable adhesives. Intense competition among established players and the emergence of new entrants are shaping market dynamics. The market is projected to achieve a CAGR of xx% during the forecast period (2025-2033), with market penetration increasing significantly in niche applications like medical devices and electronics. Changing consumer preferences toward sustainable products and packaging are also pushing growth.
Dominant Regions & Segments in US Pressure Sensitive Adhesives Industry
The packaging segment dominates the US pressure sensitive adhesives market, accounting for approximately 45% of the total market value in 2025. Within resin types, acrylics hold the largest share, followed by silicones. Water-based adhesives are experiencing rapid growth due to environmental concerns. Geographically, the Southeast and West Coast regions demonstrate higher growth rates driven by thriving manufacturing and packaging industries.
- Dominant Segment: Packaging (45% market share in 2025).
- Leading Resin Type: Acrylics.
- Fastest-growing Technology: Water-based adhesives.
- High-growth Regions: Southeast and West Coast.
Key drivers include robust industrial growth, favorable economic policies in certain states, and expanding infrastructure for manufacturing and logistics.
US Pressure Sensitive Adhesives Industry Product Innovations
Recent innovations in pressure-sensitive adhesives focus on improved adhesion strength, enhanced temperature resistance, and sustainable formulations. The development of bio-based adhesives and advancements in hot melt technologies are gaining traction, offering both performance benefits and reduced environmental impact. These innovations are primarily targeted at expanding applications in high-growth sectors such as electronics and medical devices.
Report Scope & Segmentation Analysis
This report provides a comprehensive segmentation analysis across resin type (Acrylics, Silicones, Elastomers, Other Resins), technology (Water-based, Solvent-based, Hot Melt, Radiation), application (Tapes, Labels, Graphics, Other Applications), and end-user industry (Packaging, Woodworking and Joinery, Medical, Commercial Graphics, Transportation, Electronics, Other End-user Industries). Each segment's market size, growth projections, and competitive landscape are detailed, providing a granular understanding of the market structure. The total market size in 2025 is estimated at $xx Million.
Key Drivers of US Pressure Sensitive Adhesives Industry Growth
The US pressure sensitive adhesives market is propelled by several key factors, including increasing demand from the packaging and electronics industries, the growing adoption of advanced adhesive technologies, stringent regulations favoring sustainable adhesives, and favorable economic conditions. Technological advancements leading to higher-performance adhesives further fuel market growth.
Challenges in the US Pressure Sensitive Adhesives Industry Sector
The industry faces challenges such as fluctuations in raw material prices, stringent environmental regulations, and intense competition. Supply chain disruptions and the rising cost of labor also pose significant challenges, potentially impacting profitability and market growth. These factors contribute to price volatility and necessitate efficient supply chain management.
Emerging Opportunities in US Pressure Sensitive Adhesives Industry
Emerging opportunities lie in developing sustainable, high-performance adhesives for specialized applications in the medical, electronics, and renewable energy sectors. The increasing demand for eco-friendly products presents significant opportunities for manufacturers to capitalize on. Furthermore, exploring innovative applications in advanced packaging and construction materials holds substantial potential.
Leading Players in the US Pressure Sensitive Adhesives Industry Market
- Henkel AG & Co KGaA
- 3M
- Mapei S p A
- Ashland
- Arkema Group
- Dow
- H B Fuller Company
- Franklin International
- Sika AG
- Jowat SE
- Wacker Chemie AG
- List Not Exhaustive
Key Developments in US Pressure Sensitive Adhesives Industry Industry
- June 2023: 3M launches a new line of sustainable pressure-sensitive adhesives.
- October 2022: Henkel acquires a smaller PSA manufacturer, expanding its product portfolio.
- Further developments will be detailed within the full report.
Future Outlook for US Pressure Sensitive Adhesives Industry Market
The US pressure sensitive adhesives market is poised for continued growth, driven by technological advancements, increasing demand from diverse end-use sectors, and a growing emphasis on sustainable solutions. Strategic partnerships and investments in research and development will play a crucial role in shaping the future of this dynamic industry. The market is expected to witness significant expansion in niche applications, particularly within the medical and electronics segments.
US Pressure Sensitive Adhesives Industry Segmentation
-
1. Resin
- 1.1. Acrylics
- 1.2. Silicones
- 1.3. Elastomers
- 1.4. Other Resins
-
2. Technology
- 2.1. Water-based
- 2.2. Solvent-based
- 2.3. Hot Melt
- 2.4. Radiation
-
3. Application
- 3.1. Tapes
- 3.2. Labels
- 3.3. Graphics
- 3.4. Other Applications
-
4. End-user Industry
- 4.1. Packaging
- 4.2. Woodworking and Joinery
- 4.3. Medical
- 4.4. Commercial Graphics
- 4.5. Transportation
- 4.6. Electronics
- 4.7. Other End-user Industries
US Pressure Sensitive Adhesives Industry Segmentation By Geography
-
1. North America
- 1.1. United States
- 1.2. Canada
- 1.3. Mexico
-
2. South America
- 2.1. Brazil
- 2.2. Argentina
- 2.3. Rest of South America
-
3. Europe
- 3.1. United Kingdom
- 3.2. Germany
- 3.3. France
- 3.4. Italy
- 3.5. Spain
- 3.6. Russia
- 3.7. Benelux
- 3.8. Nordics
- 3.9. Rest of Europe
-
4. Middle East & Africa
- 4.1. Turkey
- 4.2. Israel
- 4.3. GCC
- 4.4. North Africa
- 4.5. South Africa
- 4.6. Rest of Middle East & Africa
-
5. Asia Pacific
- 5.1. China
- 5.2. India
- 5.3. Japan
- 5.4. South Korea
- 5.5. ASEAN
- 5.6. Oceania
- 5.7. Rest of Asia Pacific
US Pressure Sensitive Adhesives Industry Regional Market Share
Geographic Coverage of US Pressure Sensitive Adhesives Industry
US Pressure Sensitive Adhesives Industry REPORT HIGHLIGHTS
| Aspects | Details |
|---|---|
| Study Period | 2020-2034 |
| Base Year | 2025 |
| Estimated Year | 2026 |
| Forecast Period | 2026-2034 |
| Historical Period | 2020-2025 |
| Growth Rate | CAGR of 6% from 2020-2034 |
| Segmentation |
|
Table of Contents
- 1. Introduction
- 1.1. Research Scope
- 1.2. Market Segmentation
- 1.3. Research Objective
- 1.4. Definitions and Assumptions
- 2. Executive Summary
- 2.1. Market Snapshot
- 3. Market Dynamics
- 3.1. Market Drivers
- 3.2. Market Restrains
- 3.3. Market Trends
- 3.4. Market Opportunities
- 4. Market Factor Analysis
- 4.1. Porters Five Forces
- 4.1.1. Bargaining Power of Suppliers
- 4.1.2. Bargaining Power of Buyers
- 4.1.3. Threat of New Entrants
- 4.1.4. Threat of Substitutes
- 4.1.5. Competitive Rivalry
- 4.2. PESTEL analysis
- 4.3. BCG Analysis
- 4.3.1. Stars (High Growth, High Market Share)
- 4.3.2. Cash Cows (Low Growth, High Market Share)
- 4.3.3. Question Mark (High Growth, Low Market Share)
- 4.3.4. Dogs (Low Growth, Low Market Share)
- 4.4. Ansoff Matrix Analysis
- 4.5. Supply Chain Analysis
- 4.6. Regulatory Landscape
- 4.7. Current Market Potential and Opportunity Assessment (TAM–SAM–SOM Framework)
- 4.8. PRI Analyst Note
- 4.1. Porters Five Forces
- 5. Market Analysis, Insights and Forecast 2021-2033
- 5.1. Market Analysis, Insights and Forecast - by Resin
- 5.1.1. Acrylics
- 5.1.2. Silicones
- 5.1.3. Elastomers
- 5.1.4. Other Resins
- 5.2. Market Analysis, Insights and Forecast - by Technology
- 5.2.1. Water-based
- 5.2.2. Solvent-based
- 5.2.3. Hot Melt
- 5.2.4. Radiation
- 5.3. Market Analysis, Insights and Forecast - by Application
- 5.3.1. Tapes
- 5.3.2. Labels
- 5.3.3. Graphics
- 5.3.4. Other Applications
- 5.4. Market Analysis, Insights and Forecast - by End-user Industry
- 5.4.1. Packaging
- 5.4.2. Woodworking and Joinery
- 5.4.3. Medical
- 5.4.4. Commercial Graphics
- 5.4.5. Transportation
- 5.4.6. Electronics
- 5.4.7. Other End-user Industries
- 5.5. Market Analysis, Insights and Forecast - by Region
- 5.5.1. North America
- 5.5.2. South America
- 5.5.3. Europe
- 5.5.4. Middle East & Africa
- 5.5.5. Asia Pacific
- 5.1. Market Analysis, Insights and Forecast - by Resin
- 6. Global US Pressure Sensitive Adhesives Industry Analysis, Insights and Forecast, 2021-2033
- 6.1. Market Analysis, Insights and Forecast - by Resin
- 6.1.1. Acrylics
- 6.1.2. Silicones
- 6.1.3. Elastomers
- 6.1.4. Other Resins
- 6.2. Market Analysis, Insights and Forecast - by Technology
- 6.2.1. Water-based
- 6.2.2. Solvent-based
- 6.2.3. Hot Melt
- 6.2.4. Radiation
- 6.3. Market Analysis, Insights and Forecast - by Application
- 6.3.1. Tapes
- 6.3.2. Labels
- 6.3.3. Graphics
- 6.3.4. Other Applications
- 6.4. Market Analysis, Insights and Forecast - by End-user Industry
- 6.4.1. Packaging
- 6.4.2. Woodworking and Joinery
- 6.4.3. Medical
- 6.4.4. Commercial Graphics
- 6.4.5. Transportation
- 6.4.6. Electronics
- 6.4.7. Other End-user Industries
- 6.1. Market Analysis, Insights and Forecast - by Resin
- 7. North America US Pressure Sensitive Adhesives Industry Analysis, Insights and Forecast, 2020-2032
- 7.1. Market Analysis, Insights and Forecast - by Resin
- 7.1.1. Acrylics
- 7.1.2. Silicones
- 7.1.3. Elastomers
- 7.1.4. Other Resins
- 7.2. Market Analysis, Insights and Forecast - by Technology
- 7.2.1. Water-based
- 7.2.2. Solvent-based
- 7.2.3. Hot Melt
- 7.2.4. Radiation
- 7.3. Market Analysis, Insights and Forecast - by Application
- 7.3.1. Tapes
- 7.3.2. Labels
- 7.3.3. Graphics
- 7.3.4. Other Applications
- 7.4. Market Analysis, Insights and Forecast - by End-user Industry
- 7.4.1. Packaging
- 7.4.2. Woodworking and Joinery
- 7.4.3. Medical
- 7.4.4. Commercial Graphics
- 7.4.5. Transportation
- 7.4.6. Electronics
- 7.4.7. Other End-user Industries
- 7.1. Market Analysis, Insights and Forecast - by Resin
- 8. South America US Pressure Sensitive Adhesives Industry Analysis, Insights and Forecast, 2020-2032
- 8.1. Market Analysis, Insights and Forecast - by Resin
- 8.1.1. Acrylics
- 8.1.2. Silicones
- 8.1.3. Elastomers
- 8.1.4. Other Resins
- 8.2. Market Analysis, Insights and Forecast - by Technology
- 8.2.1. Water-based
- 8.2.2. Solvent-based
- 8.2.3. Hot Melt
- 8.2.4. Radiation
- 8.3. Market Analysis, Insights and Forecast - by Application
- 8.3.1. Tapes
- 8.3.2. Labels
- 8.3.3. Graphics
- 8.3.4. Other Applications
- 8.4. Market Analysis, Insights and Forecast - by End-user Industry
- 8.4.1. Packaging
- 8.4.2. Woodworking and Joinery
- 8.4.3. Medical
- 8.4.4. Commercial Graphics
- 8.4.5. Transportation
- 8.4.6. Electronics
- 8.4.7. Other End-user Industries
- 8.1. Market Analysis, Insights and Forecast - by Resin
- 9. Europe US Pressure Sensitive Adhesives Industry Analysis, Insights and Forecast, 2020-2032
- 9.1. Market Analysis, Insights and Forecast - by Resin
- 9.1.1. Acrylics
- 9.1.2. Silicones
- 9.1.3. Elastomers
- 9.1.4. Other Resins
- 9.2. Market Analysis, Insights and Forecast - by Technology
- 9.2.1. Water-based
- 9.2.2. Solvent-based
- 9.2.3. Hot Melt
- 9.2.4. Radiation
- 9.3. Market Analysis, Insights and Forecast - by Application
- 9.3.1. Tapes
- 9.3.2. Labels
- 9.3.3. Graphics
- 9.3.4. Other Applications
- 9.4. Market Analysis, Insights and Forecast - by End-user Industry
- 9.4.1. Packaging
- 9.4.2. Woodworking and Joinery
- 9.4.3. Medical
- 9.4.4. Commercial Graphics
- 9.4.5. Transportation
- 9.4.6. Electronics
- 9.4.7. Other End-user Industries
- 9.1. Market Analysis, Insights and Forecast - by Resin
- 10. Middle East & Africa US Pressure Sensitive Adhesives Industry Analysis, Insights and Forecast, 2020-2032
- 10.1. Market Analysis, Insights and Forecast - by Resin
- 10.1.1. Acrylics
- 10.1.2. Silicones
- 10.1.3. Elastomers
- 10.1.4. Other Resins
- 10.2. Market Analysis, Insights and Forecast - by Technology
- 10.2.1. Water-based
- 10.2.2. Solvent-based
- 10.2.3. Hot Melt
- 10.2.4. Radiation
- 10.3. Market Analysis, Insights and Forecast - by Application
- 10.3.1. Tapes
- 10.3.2. Labels
- 10.3.3. Graphics
- 10.3.4. Other Applications
- 10.4. Market Analysis, Insights and Forecast - by End-user Industry
- 10.4.1. Packaging
- 10.4.2. Woodworking and Joinery
- 10.4.3. Medical
- 10.4.4. Commercial Graphics
- 10.4.5. Transportation
- 10.4.6. Electronics
- 10.4.7. Other End-user Industries
- 10.1. Market Analysis, Insights and Forecast - by Resin
- 11. Asia Pacific US Pressure Sensitive Adhesives Industry Analysis, Insights and Forecast, 2020-2032
- 11.1. Market Analysis, Insights and Forecast - by Resin
- 11.1.1. Acrylics
- 11.1.2. Silicones
- 11.1.3. Elastomers
- 11.1.4. Other Resins
- 11.2. Market Analysis, Insights and Forecast - by Technology
- 11.2.1. Water-based
- 11.2.2. Solvent-based
- 11.2.3. Hot Melt
- 11.2.4. Radiation
- 11.3. Market Analysis, Insights and Forecast - by Application
- 11.3.1. Tapes
- 11.3.2. Labels
- 11.3.3. Graphics
- 11.3.4. Other Applications
- 11.4. Market Analysis, Insights and Forecast - by End-user Industry
- 11.4.1. Packaging
- 11.4.2. Woodworking and Joinery
- 11.4.3. Medical
- 11.4.4. Commercial Graphics
- 11.4.5. Transportation
- 11.4.6. Electronics
- 11.4.7. Other End-user Industries
- 11.1. Market Analysis, Insights and Forecast - by Resin
- 12. Competitive Analysis
- 12.1. Company Profiles
- 12.1.1 Henkel AG & Co KGaA
- 12.1.1.1. Company Overview
- 12.1.1.2. Products
- 12.1.1.3. Company Financials
- 12.1.1.4. SWOT Analysis
- 12.1.2 3M
- 12.1.2.1. Company Overview
- 12.1.2.2. Products
- 12.1.2.3. Company Financials
- 12.1.2.4. SWOT Analysis
- 12.1.3 Mapei S p A
- 12.1.3.1. Company Overview
- 12.1.3.2. Products
- 12.1.3.3. Company Financials
- 12.1.3.4. SWOT Analysis
- 12.1.4 Ashland
- 12.1.4.1. Company Overview
- 12.1.4.2. Products
- 12.1.4.3. Company Financials
- 12.1.4.4. SWOT Analysis
- 12.1.5 Arkema Group
- 12.1.5.1. Company Overview
- 12.1.5.2. Products
- 12.1.5.3. Company Financials
- 12.1.5.4. SWOT Analysis
- 12.1.6 Dow
- 12.1.6.1. Company Overview
- 12.1.6.2. Products
- 12.1.6.3. Company Financials
- 12.1.6.4. SWOT Analysis
- 12.1.7 H B Fuller Company
- 12.1.7.1. Company Overview
- 12.1.7.2. Products
- 12.1.7.3. Company Financials
- 12.1.7.4. SWOT Analysis
- 12.1.8 Franklin International
- 12.1.8.1. Company Overview
- 12.1.8.2. Products
- 12.1.8.3. Company Financials
- 12.1.8.4. SWOT Analysis
- 12.1.9 Sika AG
- 12.1.9.1. Company Overview
- 12.1.9.2. Products
- 12.1.9.3. Company Financials
- 12.1.9.4. SWOT Analysis
- 12.1.10 Jowat SE
- 12.1.10.1. Company Overview
- 12.1.10.2. Products
- 12.1.10.3. Company Financials
- 12.1.10.4. SWOT Analysis
- 12.1.11 Wacker Chemie AG*List Not Exhaustive
- 12.1.11.1. Company Overview
- 12.1.11.2. Products
- 12.1.11.3. Company Financials
- 12.1.11.4. SWOT Analysis
- 12.1.1 Henkel AG & Co KGaA
- 12.2. Market Entropy
- 12.2.1 Company's Key Areas Served
- 12.2.2 Recent Developments
- 12.3. Company Market Share Analysis 2025
- 12.3.1 Top 5 Companies Market Share Analysis
- 12.3.2 Top 3 Companies Market Share Analysis
- 12.4. List of Potential Customers
- 13. Research Methodology
List of Figures
- Figure 1: Global US Pressure Sensitive Adhesives Industry Revenue Breakdown (billion, %) by Region 2025 & 2033
- Figure 2: North America US Pressure Sensitive Adhesives Industry Revenue (billion), by Resin 2025 & 2033
- Figure 3: North America US Pressure Sensitive Adhesives Industry Revenue Share (%), by Resin 2025 & 2033
- Figure 4: North America US Pressure Sensitive Adhesives Industry Revenue (billion), by Technology 2025 & 2033
- Figure 5: North America US Pressure Sensitive Adhesives Industry Revenue Share (%), by Technology 2025 & 2033
- Figure 6: North America US Pressure Sensitive Adhesives Industry Revenue (billion), by Application 2025 & 2033
- Figure 7: North America US Pressure Sensitive Adhesives Industry Revenue Share (%), by Application 2025 & 2033
- Figure 8: North America US Pressure Sensitive Adhesives Industry Revenue (billion), by End-user Industry 2025 & 2033
- Figure 9: North America US Pressure Sensitive Adhesives Industry Revenue Share (%), by End-user Industry 2025 & 2033
- Figure 10: North America US Pressure Sensitive Adhesives Industry Revenue (billion), by Country 2025 & 2033
- Figure 11: North America US Pressure Sensitive Adhesives Industry Revenue Share (%), by Country 2025 & 2033
- Figure 12: South America US Pressure Sensitive Adhesives Industry Revenue (billion), by Resin 2025 & 2033
- Figure 13: South America US Pressure Sensitive Adhesives Industry Revenue Share (%), by Resin 2025 & 2033
- Figure 14: South America US Pressure Sensitive Adhesives Industry Revenue (billion), by Technology 2025 & 2033
- Figure 15: South America US Pressure Sensitive Adhesives Industry Revenue Share (%), by Technology 2025 & 2033
- Figure 16: South America US Pressure Sensitive Adhesives Industry Revenue (billion), by Application 2025 & 2033
- Figure 17: South America US Pressure Sensitive Adhesives Industry Revenue Share (%), by Application 2025 & 2033
- Figure 18: South America US Pressure Sensitive Adhesives Industry Revenue (billion), by End-user Industry 2025 & 2033
- Figure 19: South America US Pressure Sensitive Adhesives Industry Revenue Share (%), by End-user Industry 2025 & 2033
- Figure 20: South America US Pressure Sensitive Adhesives Industry Revenue (billion), by Country 2025 & 2033
- Figure 21: South America US Pressure Sensitive Adhesives Industry Revenue Share (%), by Country 2025 & 2033
- Figure 22: Europe US Pressure Sensitive Adhesives Industry Revenue (billion), by Resin 2025 & 2033
- Figure 23: Europe US Pressure Sensitive Adhesives Industry Revenue Share (%), by Resin 2025 & 2033
- Figure 24: Europe US Pressure Sensitive Adhesives Industry Revenue (billion), by Technology 2025 & 2033
- Figure 25: Europe US Pressure Sensitive Adhesives Industry Revenue Share (%), by Technology 2025 & 2033
- Figure 26: Europe US Pressure Sensitive Adhesives Industry Revenue (billion), by Application 2025 & 2033
- Figure 27: Europe US Pressure Sensitive Adhesives Industry Revenue Share (%), by Application 2025 & 2033
- Figure 28: Europe US Pressure Sensitive Adhesives Industry Revenue (billion), by End-user Industry 2025 & 2033
- Figure 29: Europe US Pressure Sensitive Adhesives Industry Revenue Share (%), by End-user Industry 2025 & 2033
- Figure 30: Europe US Pressure Sensitive Adhesives Industry Revenue (billion), by Country 2025 & 2033
- Figure 31: Europe US Pressure Sensitive Adhesives Industry Revenue Share (%), by Country 2025 & 2033
- Figure 32: Middle East & Africa US Pressure Sensitive Adhesives Industry Revenue (billion), by Resin 2025 & 2033
- Figure 33: Middle East & Africa US Pressure Sensitive Adhesives Industry Revenue Share (%), by Resin 2025 & 2033
- Figure 34: Middle East & Africa US Pressure Sensitive Adhesives Industry Revenue (billion), by Technology 2025 & 2033
- Figure 35: Middle East & Africa US Pressure Sensitive Adhesives Industry Revenue Share (%), by Technology 2025 & 2033
- Figure 36: Middle East & Africa US Pressure Sensitive Adhesives Industry Revenue (billion), by Application 2025 & 2033
- Figure 37: Middle East & Africa US Pressure Sensitive Adhesives Industry Revenue Share (%), by Application 2025 & 2033
- Figure 38: Middle East & Africa US Pressure Sensitive Adhesives Industry Revenue (billion), by End-user Industry 2025 & 2033
- Figure 39: Middle East & Africa US Pressure Sensitive Adhesives Industry Revenue Share (%), by End-user Industry 2025 & 2033
- Figure 40: Middle East & Africa US Pressure Sensitive Adhesives Industry Revenue (billion), by Country 2025 & 2033
- Figure 41: Middle East & Africa US Pressure Sensitive Adhesives Industry Revenue Share (%), by Country 2025 & 2033
- Figure 42: Asia Pacific US Pressure Sensitive Adhesives Industry Revenue (billion), by Resin 2025 & 2033
- Figure 43: Asia Pacific US Pressure Sensitive Adhesives Industry Revenue Share (%), by Resin 2025 & 2033
- Figure 44: Asia Pacific US Pressure Sensitive Adhesives Industry Revenue (billion), by Technology 2025 & 2033
- Figure 45: Asia Pacific US Pressure Sensitive Adhesives Industry Revenue Share (%), by Technology 2025 & 2033
- Figure 46: Asia Pacific US Pressure Sensitive Adhesives Industry Revenue (billion), by Application 2025 & 2033
- Figure 47: Asia Pacific US Pressure Sensitive Adhesives Industry Revenue Share (%), by Application 2025 & 2033
- Figure 48: Asia Pacific US Pressure Sensitive Adhesives Industry Revenue (billion), by End-user Industry 2025 & 2033
- Figure 49: Asia Pacific US Pressure Sensitive Adhesives Industry Revenue Share (%), by End-user Industry 2025 & 2033
- Figure 50: Asia Pacific US Pressure Sensitive Adhesives Industry Revenue (billion), by Country 2025 & 2033
- Figure 51: Asia Pacific US Pressure Sensitive Adhesives Industry Revenue Share (%), by Country 2025 & 2033
List of Tables
- Table 1: Global US Pressure Sensitive Adhesives Industry Revenue billion Forecast, by Resin 2020 & 2033
- Table 2: Global US Pressure Sensitive Adhesives Industry Revenue billion Forecast, by Technology 2020 & 2033
- Table 3: Global US Pressure Sensitive Adhesives Industry Revenue billion Forecast, by Application 2020 & 2033
- Table 4: Global US Pressure Sensitive Adhesives Industry Revenue billion Forecast, by End-user Industry 2020 & 2033
- Table 5: Global US Pressure Sensitive Adhesives Industry Revenue billion Forecast, by Region 2020 & 2033
- Table 6: Global US Pressure Sensitive Adhesives Industry Revenue billion Forecast, by Resin 2020 & 2033
- Table 7: Global US Pressure Sensitive Adhesives Industry Revenue billion Forecast, by Technology 2020 & 2033
- Table 8: Global US Pressure Sensitive Adhesives Industry Revenue billion Forecast, by Application 2020 & 2033
- Table 9: Global US Pressure Sensitive Adhesives Industry Revenue billion Forecast, by End-user Industry 2020 & 2033
- Table 10: Global US Pressure Sensitive Adhesives Industry Revenue billion Forecast, by Country 2020 & 2033
- Table 11: United States US Pressure Sensitive Adhesives Industry Revenue (billion) Forecast, by Application 2020 & 2033
- Table 12: Canada US Pressure Sensitive Adhesives Industry Revenue (billion) Forecast, by Application 2020 & 2033
- Table 13: Mexico US Pressure Sensitive Adhesives Industry Revenue (billion) Forecast, by Application 2020 & 2033
- Table 14: Global US Pressure Sensitive Adhesives Industry Revenue billion Forecast, by Resin 2020 & 2033
- Table 15: Global US Pressure Sensitive Adhesives Industry Revenue billion Forecast, by Technology 2020 & 2033
- Table 16: Global US Pressure Sensitive Adhesives Industry Revenue billion Forecast, by Application 2020 & 2033
- Table 17: Global US Pressure Sensitive Adhesives Industry Revenue billion Forecast, by End-user Industry 2020 & 2033
- Table 18: Global US Pressure Sensitive Adhesives Industry Revenue billion Forecast, by Country 2020 & 2033
- Table 19: Brazil US Pressure Sensitive Adhesives Industry Revenue (billion) Forecast, by Application 2020 & 2033
- Table 20: Argentina US Pressure Sensitive Adhesives Industry Revenue (billion) Forecast, by Application 2020 & 2033
- Table 21: Rest of South America US Pressure Sensitive Adhesives Industry Revenue (billion) Forecast, by Application 2020 & 2033
- Table 22: Global US Pressure Sensitive Adhesives Industry Revenue billion Forecast, by Resin 2020 & 2033
- Table 23: Global US Pressure Sensitive Adhesives Industry Revenue billion Forecast, by Technology 2020 & 2033
- Table 24: Global US Pressure Sensitive Adhesives Industry Revenue billion Forecast, by Application 2020 & 2033
- Table 25: Global US Pressure Sensitive Adhesives Industry Revenue billion Forecast, by End-user Industry 2020 & 2033
- Table 26: Global US Pressure Sensitive Adhesives Industry Revenue billion Forecast, by Country 2020 & 2033
- Table 27: United Kingdom US Pressure Sensitive Adhesives Industry Revenue (billion) Forecast, by Application 2020 & 2033
- Table 28: Germany US Pressure Sensitive Adhesives Industry Revenue (billion) Forecast, by Application 2020 & 2033
- Table 29: France US Pressure Sensitive Adhesives Industry Revenue (billion) Forecast, by Application 2020 & 2033
- Table 30: Italy US Pressure Sensitive Adhesives Industry Revenue (billion) Forecast, by Application 2020 & 2033
- Table 31: Spain US Pressure Sensitive Adhesives Industry Revenue (billion) Forecast, by Application 2020 & 2033
- Table 32: Russia US Pressure Sensitive Adhesives Industry Revenue (billion) Forecast, by Application 2020 & 2033
- Table 33: Benelux US Pressure Sensitive Adhesives Industry Revenue (billion) Forecast, by Application 2020 & 2033
- Table 34: Nordics US Pressure Sensitive Adhesives Industry Revenue (billion) Forecast, by Application 2020 & 2033
- Table 35: Rest of Europe US Pressure Sensitive Adhesives Industry Revenue (billion) Forecast, by Application 2020 & 2033
- Table 36: Global US Pressure Sensitive Adhesives Industry Revenue billion Forecast, by Resin 2020 & 2033
- Table 37: Global US Pressure Sensitive Adhesives Industry Revenue billion Forecast, by Technology 2020 & 2033
- Table 38: Global US Pressure Sensitive Adhesives Industry Revenue billion Forecast, by Application 2020 & 2033
- Table 39: Global US Pressure Sensitive Adhesives Industry Revenue billion Forecast, by End-user Industry 2020 & 2033
- Table 40: Global US Pressure Sensitive Adhesives Industry Revenue billion Forecast, by Country 2020 & 2033
- Table 41: Turkey US Pressure Sensitive Adhesives Industry Revenue (billion) Forecast, by Application 2020 & 2033
- Table 42: Israel US Pressure Sensitive Adhesives Industry Revenue (billion) Forecast, by Application 2020 & 2033
- Table 43: GCC US Pressure Sensitive Adhesives Industry Revenue (billion) Forecast, by Application 2020 & 2033
- Table 44: North Africa US Pressure Sensitive Adhesives Industry Revenue (billion) Forecast, by Application 2020 & 2033
- Table 45: South Africa US Pressure Sensitive Adhesives Industry Revenue (billion) Forecast, by Application 2020 & 2033
- Table 46: Rest of Middle East & Africa US Pressure Sensitive Adhesives Industry Revenue (billion) Forecast, by Application 2020 & 2033
- Table 47: Global US Pressure Sensitive Adhesives Industry Revenue billion Forecast, by Resin 2020 & 2033
- Table 48: Global US Pressure Sensitive Adhesives Industry Revenue billion Forecast, by Technology 2020 & 2033
- Table 49: Global US Pressure Sensitive Adhesives Industry Revenue billion Forecast, by Application 2020 & 2033
- Table 50: Global US Pressure Sensitive Adhesives Industry Revenue billion Forecast, by End-user Industry 2020 & 2033
- Table 51: Global US Pressure Sensitive Adhesives Industry Revenue billion Forecast, by Country 2020 & 2033
- Table 52: China US Pressure Sensitive Adhesives Industry Revenue (billion) Forecast, by Application 2020 & 2033
- Table 53: India US Pressure Sensitive Adhesives Industry Revenue (billion) Forecast, by Application 2020 & 2033
- Table 54: Japan US Pressure Sensitive Adhesives Industry Revenue (billion) Forecast, by Application 2020 & 2033
- Table 55: South Korea US Pressure Sensitive Adhesives Industry Revenue (billion) Forecast, by Application 2020 & 2033
- Table 56: ASEAN US Pressure Sensitive Adhesives Industry Revenue (billion) Forecast, by Application 2020 & 2033
- Table 57: Oceania US Pressure Sensitive Adhesives Industry Revenue (billion) Forecast, by Application 2020 & 2033
- Table 58: Rest of Asia Pacific US Pressure Sensitive Adhesives Industry Revenue (billion) Forecast, by Application 2020 & 2033
Frequently Asked Questions
1. What is the projected Compound Annual Growth Rate (CAGR) of the US Pressure Sensitive Adhesives Industry?
The projected CAGR is approximately 6%.
2. Which companies are prominent players in the US Pressure Sensitive Adhesives Industry?
Key companies in the market include Henkel AG & Co KGaA, 3M, Mapei S p A, Ashland, Arkema Group, Dow, H B Fuller Company, Franklin International, Sika AG, Jowat SE, Wacker Chemie AG*List Not Exhaustive.
3. What are the main segments of the US Pressure Sensitive Adhesives Industry?
The market segments include Resin, Technology, Application, End-user Industry.
4. Can you provide details about the market size?
The market size is estimated to be USD 9.9 billion as of 2022.
5. What are some drivers contributing to market growth?
; Shifting Focus to Low-Cost Flexible Packaging; Other Drivers.
6. What are the notable trends driving market growth?
Packaging Industry to Dominate the Market.
7. Are there any restraints impacting market growth?
; Stringent Environmental Regulations Regarding VOC Emissions; Other Restraints.
8. Can you provide examples of recent developments in the market?
N/A
9. What pricing options are available for accessing the report?
Pricing options include single-user, multi-user, and enterprise licenses priced at USD 3800, USD 4500, and USD 5800 respectively.
10. Is the market size provided in terms of value or volume?
The market size is provided in terms of value, measured in billion.
11. Are there any specific market keywords associated with the report?
Yes, the market keyword associated with the report is "US Pressure Sensitive Adhesives Industry," which aids in identifying and referencing the specific market segment covered.
12. How do I determine which pricing option suits my needs best?
The pricing options vary based on user requirements and access needs. Individual users may opt for single-user licenses, while businesses requiring broader access may choose multi-user or enterprise licenses for cost-effective access to the report.
13. Are there any additional resources or data provided in the US Pressure Sensitive Adhesives Industry report?
While the report offers comprehensive insights, it's advisable to review the specific contents or supplementary materials provided to ascertain if additional resources or data are available.
14. How can I stay updated on further developments or reports in the US Pressure Sensitive Adhesives Industry?
To stay informed about further developments, trends, and reports in the US Pressure Sensitive Adhesives Industry, consider subscribing to industry newsletters, following relevant companies and organizations, or regularly checking reputable industry news sources and publications.
Methodology
Step 1 - Identification of Relevant Samples Size from Population Database


Step 2 - Approaches for Defining Global Market Size (Value, Volume* & Price*)

Note*: In applicable scenarios
Step 3 - Data Sources
Primary Research
- Web Analytics
- Survey Reports
- Research Institute
- Latest Research Reports
- Opinion Leaders
Secondary Research
- Annual Reports
- White Paper
- Latest Press Release
- Industry Association
- Paid Database
- Investor Presentations

Step 4 - Data Triangulation
Involves using different sources of information in order to increase the validity of a study
These sources are likely to be stakeholders in a program - participants, other researchers, program staff, other community members, and so on.
Then we put all data in single framework & apply various statistical tools to find out the dynamic on the market.
During the analysis stage, feedback from the stakeholder groups would be compared to determine areas of agreement as well as areas of divergence