

Key Insights
The US smart water meter market is poised for significant expansion, propelled by increasing urbanization, aging water infrastructure, and the imperative for efficient water resource management. Projections indicate a Compound Annual Growth Rate (CAGR) of 26.2%, with the market expected to reach $4.1 billion by 2025. This upward trajectory is underpinned by governmental support for water conservation and smart city initiatives, alongside the widespread adoption of Advanced Metering Infrastructure (AMI) for enhanced operational efficiency and minimized water loss. Key market segments include smart water meters and traditional meters; however, smart meters are outpacing traditional meters due to their advanced capabilities in remote monitoring, leak detection, and data analytics.
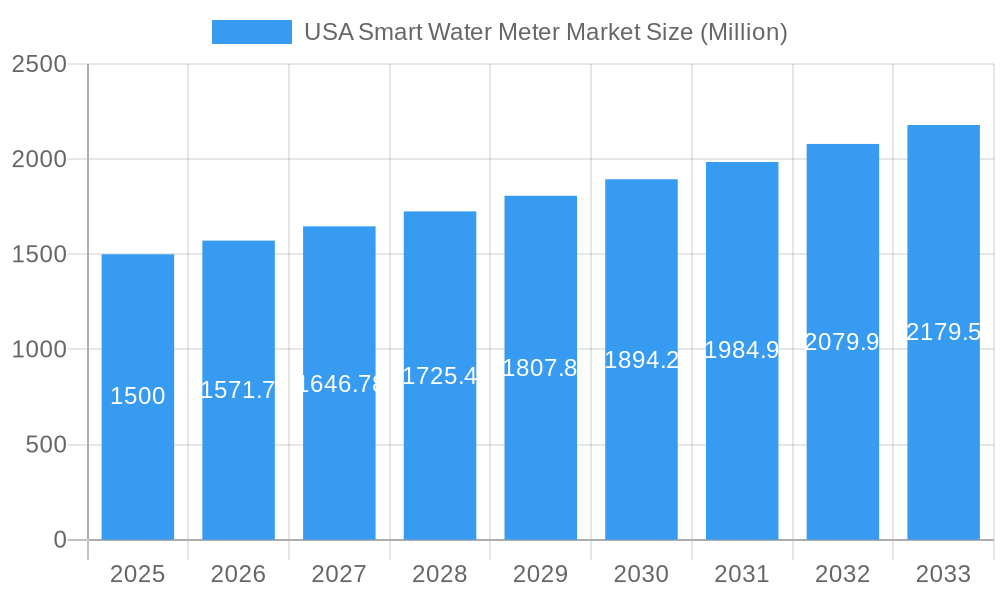
USA Smart Water Meter Market Market Size (In Billion)
Leading industry participants, including Badger Meter, Honeywell, and Neptune Technology Group, are actively investing in research and development and forming strategic alliances to leverage market growth. Regional adoption rates are influenced by factors such as water scarcity, with states like California and Texas demonstrating higher uptake. Market dynamics are also shaped by implementation costs, data security considerations, and the demand for a skilled workforce capable of managing and interpreting smart meter data.
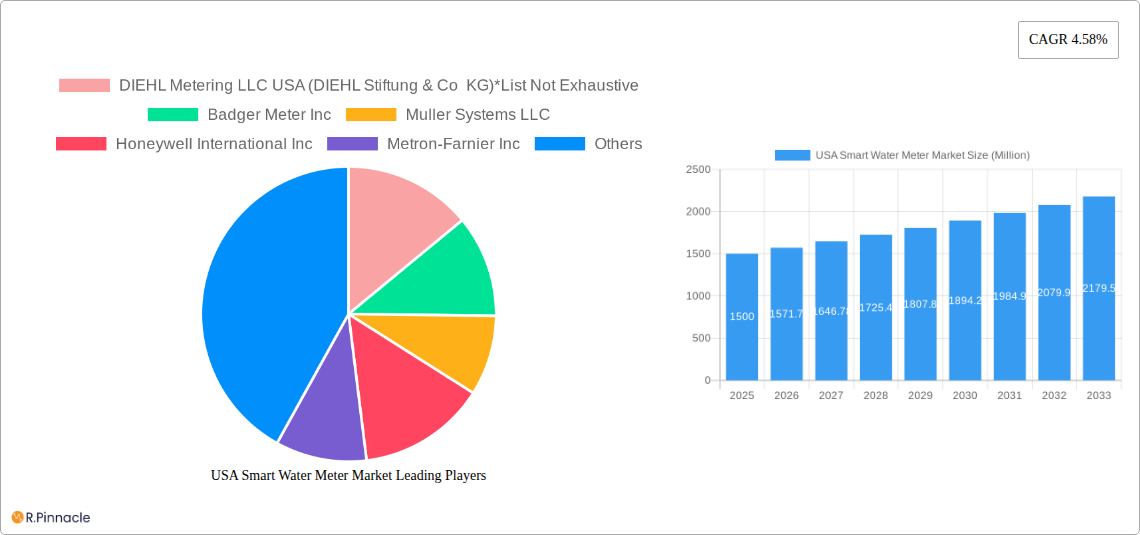
USA Smart Water Meter Market Company Market Share
The competitive arena features established companies and innovative technology providers vying for market dominance. Success in this sector relies on delivering cutting-edge solutions, comprehensive customer support, and stringent data security measures. While the upfront investment for smart meter deployment can be substantial, the long-term advantages, including reduced water loss, improved operational performance, and elevated customer service, present a compelling value proposition for water utilities. The integration of smart meters with broader smart city ecosystems further promotes sustainable and efficient urban environments. Ongoing advancements in data analytics and AI-driven solutions will continue to fuel market growth and create new avenues for both existing and emerging market players.
USA Smart Water Meter Market: A Comprehensive Report (2019-2033)
This comprehensive report provides an in-depth analysis of the USA Smart Water Meter Market, offering invaluable insights for industry professionals, investors, and stakeholders. The study covers the period 2019-2033, with a base year of 2025 and a forecast period of 2025-2033. Discover key trends, growth drivers, challenges, and opportunities shaping this dynamic market. The total market size in 2025 is estimated at xx Million, with a projected CAGR of xx% during the forecast period.
USA Smart Water Meter Market Structure & Innovation Trends
This section analyzes the competitive landscape, innovation drivers, and regulatory influences within the USA smart water meter market. We delve into market concentration, examining the market share held by key players such as DIEHL Metering LLC USA, Badger Meter Inc, Muller Systems LLC, Honeywell International Inc, and others. The report also explores the impact of mergers and acquisitions (M&A) activities, quantifying deal values where data is available (xx Million in total M&A value during 2019-2024, for example). Innovation drivers include the increasing demand for water conservation, advancements in IoT technology, and supportive government regulations. Regulatory frameworks, such as those promoting water efficiency and smart city initiatives, are also examined. The report further analyzes the impact of product substitutes and end-user demographics on market growth.
- Market Concentration: Highly fragmented with xx% market share held by top 5 players in 2024.
- Innovation Drivers: IoT advancements, water conservation initiatives, and smart city development.
- Regulatory Frameworks: Federal and state regulations promoting water efficiency and smart grid infrastructure.
- M&A Activities: xx Million in total deal value from 2019 to 2024 (estimated).
- Product Substitutes: Limited, mainly traditional water meters.
- End-User Demographics: Municipal water utilities, industrial users, and commercial properties.
USA Smart Water Meter Market Dynamics & Trends
This section examines the key factors driving market growth, including technological disruptions, consumer preferences, and competitive dynamics. The increasing adoption of smart water meters by municipalities to improve water management and reduce water loss is a major driver. Technological advancements, such as the development of advanced metering infrastructure (AMI) and low-power wide-area networks (LPWAN) technologies like LoRaWAN, are further accelerating market growth. The report also analyzes consumer preferences regarding features such as remote monitoring, leak detection, and real-time data analysis. Competitive dynamics are shaped by factors such as product innovation, pricing strategies, and partnerships.
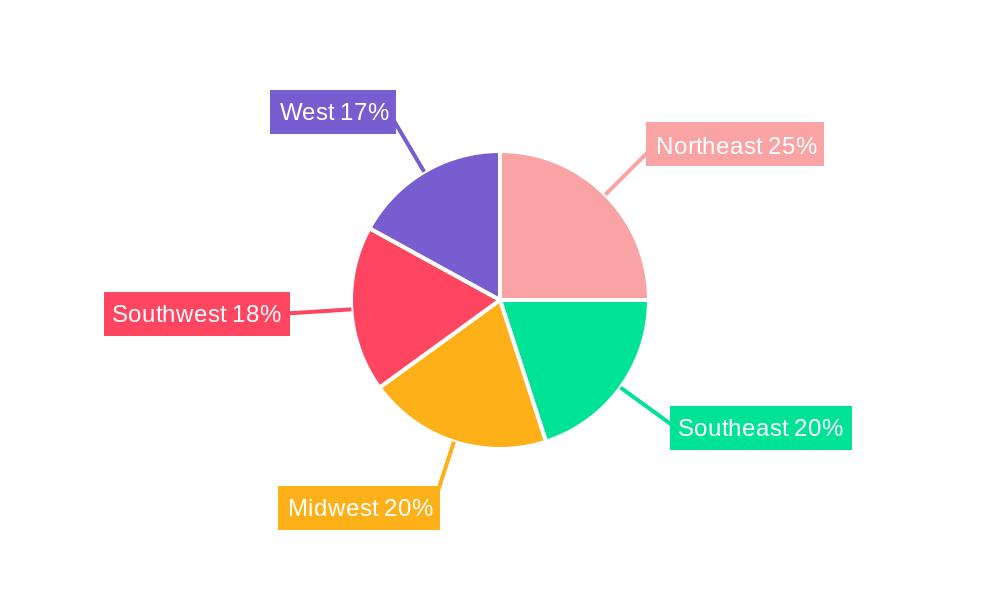
Dominant Regions & Segments in USA Smart Water Meter Market
This section identifies the leading regions and segments within the USA smart water meter market. The report analyzes the market share of each segment (Smart Water Meter and Basic Water Meter) and dominant regions based on factors like infrastructure development, economic policies, and water resource management strategies. Specific data on regional market size and growth projections for each segment is provided within the full report.
- Key Drivers (California, for example):
- Robust infrastructure investments in smart city initiatives.
- Stringent water conservation regulations.
- High adoption rate of smart technologies.
- Dominant Segment: Smart Water Meters due to their advanced functionalities and data-driven insights.
USA Smart Water Meter Market Product Innovations
Recent innovations focus on enhanced connectivity, improved data accuracy, and advanced analytics capabilities. The market is witnessing a shift toward cellular-based communication technologies, offering greater range and reliability compared to traditional networks. New products are emphasizing ease of installation, maintenance, and integration with existing water management systems. The integration of AI and machine learning capabilities for predictive maintenance and leak detection is a significant trend. This addresses market needs for improved efficiency, reduced operational costs, and enhanced water resource management.
Report Scope & Segmentation Analysis
This report segments the USA smart water meter market by type: Smart Water Meter and Basic Water Meter. Each segment's growth projections, market size, and competitive dynamics are analyzed in detail. The Smart Water Meter segment is expected to witness significant growth due to increased demand for advanced functionalities, while the Basic Water Meter segment will continue to maintain a sizable market share owing to its cost-effectiveness.
- Smart Water Meter: xx Million in 2025, projected to reach xx Million by 2033.
- Basic Water Meter: xx Million in 2025, projected to reach xx Million by 2033.
Key Drivers of USA Smart Water Meter Market Growth
The growth of the USA smart water meter market is driven by several factors. These include government initiatives promoting water conservation and efficiency, the increasing adoption of smart city technologies, and the rising demand for real-time water usage monitoring. Technological advancements, such as the development of low-power wide-area networks (LPWAN) and improved data analytics capabilities, are also major contributors to market growth. Furthermore, the need to reduce water loss and improve operational efficiency is driving demand among water utilities.
Challenges in the USA Smart Water Meter Market Sector
Challenges include the high initial investment costs associated with smart meter deployment, the need for reliable and secure communication networks, and the complexity of integrating smart meters with existing infrastructure. Concerns about data privacy and cybersecurity are also potential barriers. Supply chain disruptions and the availability of skilled labor can also impact market growth.
Emerging Opportunities in USA Smart Water Meter Market
Emerging opportunities include the expansion into underserved markets, the development of advanced analytics solutions for water management, and the integration of smart meters with other smart city infrastructure. There is also growing potential for the development of value-added services based on water usage data, such as customized billing and leak detection alerts. Further innovation in low-power, long-range communication technologies will also open new market opportunities.
Leading Players in the USA Smart Water Meter Market Market
- DIEHL Metering LLC USA (DIEHL Stiftung & Co KG)
- Badger Meter Inc
- Muller Systems LLC
- Honeywell International Inc
- Metron-Farnier Inc
- Neptune Technology Group Inc
- Kamstrup Water Metering LLC (Kamstrup A/S)
- Zenner USA Inc
- Carlon Meter Inc
- Sensus USA Inc
- Master Meter Inc
Key Developments in USA Smart Water Meter Market Industry
- August 2023: Mueller Systems announced the deployment of its Network as a Service (NaaS) AMI system with LoRaWAN in South Daytona, Florida, enabling real-time water consumption monitoring and improved customer service.
- May 2023: Honeywell International Inc. launched a next-generation cellular module for advanced metering infrastructure, facilitating easy upgrades of legacy meters to smart meters.
Future Outlook for USA Smart Water Meter Market Market
The future of the USA smart water meter market is promising, driven by continued technological advancements, supportive government policies, and the increasing need for efficient water management. The market is expected to witness significant growth, driven by the adoption of advanced technologies and the expansion into new markets. Strategic partnerships and investments in research and development will play a crucial role in shaping the future of this dynamic sector.
USA Smart Water Meter Market Segmentation
-
1. Type
- 1.1. Smart Water Meter
- 1.2. Basic Water Meter
USA Smart Water Meter Market Segmentation By Geography
-
1. North America
- 1.1. United States
- 1.2. Canada
- 1.3. Mexico
-
2. South America
- 2.1. Brazil
- 2.2. Argentina
- 2.3. Rest of South America
-
3. Europe
- 3.1. United Kingdom
- 3.2. Germany
- 3.3. France
- 3.4. Italy
- 3.5. Spain
- 3.6. Russia
- 3.7. Benelux
- 3.8. Nordics
- 3.9. Rest of Europe
-
4. Middle East & Africa
- 4.1. Turkey
- 4.2. Israel
- 4.3. GCC
- 4.4. North Africa
- 4.5. South Africa
- 4.6. Rest of Middle East & Africa
-
5. Asia Pacific
- 5.1. China
- 5.2. India
- 5.3. Japan
- 5.4. South Korea
- 5.5. ASEAN
- 5.6. Oceania
- 5.7. Rest of Asia Pacific
USA Smart Water Meter Market Regional Market Share
Geographic Coverage of USA Smart Water Meter Market
USA Smart Water Meter Market REPORT HIGHLIGHTS
| Aspects | Details |
|---|---|
| Study Period | 2020-2034 |
| Base Year | 2025 |
| Estimated Year | 2026 |
| Forecast Period | 2026-2034 |
| Historical Period | 2020-2025 |
| Growth Rate | CAGR of 26.2% from 2020-2034 |
| Segmentation |
|
Table of Contents
- 1. Introduction
- 1.1. Research Scope
- 1.2. Market Segmentation
- 1.3. Research Methodology
- 1.4. Definitions and Assumptions
- 2. Executive Summary
- 2.1. Introduction
- 3. Market Dynamics
- 3.1. Introduction
- 3.2. Market Drivers
- 3.2.1. Supportive State Regulations and Growing Awareness of the Wastage of Water; Fast-Paced Development of Water Infrastructure
- 3.3. Market Restrains
- 3.3.1. Costs Involved With Installation by Utility Providers and Security and Integration Challenges
- 3.4. Market Trends
- 3.4.1. Fast-paced Development of Water Infrastructure is Expected to Drive the Market
- 4. Market Factor Analysis
- 4.1. Porters Five Forces
- 4.2. Supply/Value Chain
- 4.3. PESTEL analysis
- 4.4. Market Entropy
- 4.5. Patent/Trademark Analysis
- 5. Global USA Smart Water Meter Market Analysis, Insights and Forecast, 2020-2032
- 5.1. Market Analysis, Insights and Forecast - by Type
- 5.1.1. Smart Water Meter
- 5.1.2. Basic Water Meter
- 5.2. Market Analysis, Insights and Forecast - by Region
- 5.2.1. North America
- 5.2.2. South America
- 5.2.3. Europe
- 5.2.4. Middle East & Africa
- 5.2.5. Asia Pacific
- 5.1. Market Analysis, Insights and Forecast - by Type
- 6. North America USA Smart Water Meter Market Analysis, Insights and Forecast, 2020-2032
- 6.1. Market Analysis, Insights and Forecast - by Type
- 6.1.1. Smart Water Meter
- 6.1.2. Basic Water Meter
- 6.1. Market Analysis, Insights and Forecast - by Type
- 7. South America USA Smart Water Meter Market Analysis, Insights and Forecast, 2020-2032
- 7.1. Market Analysis, Insights and Forecast - by Type
- 7.1.1. Smart Water Meter
- 7.1.2. Basic Water Meter
- 7.1. Market Analysis, Insights and Forecast - by Type
- 8. Europe USA Smart Water Meter Market Analysis, Insights and Forecast, 2020-2032
- 8.1. Market Analysis, Insights and Forecast - by Type
- 8.1.1. Smart Water Meter
- 8.1.2. Basic Water Meter
- 8.1. Market Analysis, Insights and Forecast - by Type
- 9. Middle East & Africa USA Smart Water Meter Market Analysis, Insights and Forecast, 2020-2032
- 9.1. Market Analysis, Insights and Forecast - by Type
- 9.1.1. Smart Water Meter
- 9.1.2. Basic Water Meter
- 9.1. Market Analysis, Insights and Forecast - by Type
- 10. Asia Pacific USA Smart Water Meter Market Analysis, Insights and Forecast, 2020-2032
- 10.1. Market Analysis, Insights and Forecast - by Type
- 10.1.1. Smart Water Meter
- 10.1.2. Basic Water Meter
- 10.1. Market Analysis, Insights and Forecast - by Type
- 11. Competitive Analysis
- 11.1. Global Market Share Analysis 2025
- 11.2. Company Profiles
- 11.2.1 DIEHL Metering LLC USA (DIEHL Stiftung & Co KG)*List Not Exhaustive
- 11.2.1.1. Overview
- 11.2.1.2. Products
- 11.2.1.3. SWOT Analysis
- 11.2.1.4. Recent Developments
- 11.2.1.5. Financials (Based on Availability)
- 11.2.2 Badger Meter Inc
- 11.2.2.1. Overview
- 11.2.2.2. Products
- 11.2.2.3. SWOT Analysis
- 11.2.2.4. Recent Developments
- 11.2.2.5. Financials (Based on Availability)
- 11.2.3 Muller Systems LLC
- 11.2.3.1. Overview
- 11.2.3.2. Products
- 11.2.3.3. SWOT Analysis
- 11.2.3.4. Recent Developments
- 11.2.3.5. Financials (Based on Availability)
- 11.2.4 Honeywell International Inc
- 11.2.4.1. Overview
- 11.2.4.2. Products
- 11.2.4.3. SWOT Analysis
- 11.2.4.4. Recent Developments
- 11.2.4.5. Financials (Based on Availability)
- 11.2.5 Metron-Farnier Inc
- 11.2.5.1. Overview
- 11.2.5.2. Products
- 11.2.5.3. SWOT Analysis
- 11.2.5.4. Recent Developments
- 11.2.5.5. Financials (Based on Availability)
- 11.2.6 Neptune Technology Group Inc
- 11.2.6.1. Overview
- 11.2.6.2. Products
- 11.2.6.3. SWOT Analysis
- 11.2.6.4. Recent Developments
- 11.2.6.5. Financials (Based on Availability)
- 11.2.7 Kamstrup Water Metering LLC (Kamstrup A/S)
- 11.2.7.1. Overview
- 11.2.7.2. Products
- 11.2.7.3. SWOT Analysis
- 11.2.7.4. Recent Developments
- 11.2.7.5. Financials (Based on Availability)
- 11.2.8 Zenner USA Inc
- 11.2.8.1. Overview
- 11.2.8.2. Products
- 11.2.8.3. SWOT Analysis
- 11.2.8.4. Recent Developments
- 11.2.8.5. Financials (Based on Availability)
- 11.2.9 Carlon Meter Inc
- 11.2.9.1. Overview
- 11.2.9.2. Products
- 11.2.9.3. SWOT Analysis
- 11.2.9.4. Recent Developments
- 11.2.9.5. Financials (Based on Availability)
- 11.2.10 Sensus USA Inc
- 11.2.10.1. Overview
- 11.2.10.2. Products
- 11.2.10.3. SWOT Analysis
- 11.2.10.4. Recent Developments
- 11.2.10.5. Financials (Based on Availability)
- 11.2.11 Master Meter Inc
- 11.2.11.1. Overview
- 11.2.11.2. Products
- 11.2.11.3. SWOT Analysis
- 11.2.11.4. Recent Developments
- 11.2.11.5. Financials (Based on Availability)
- 11.2.1 DIEHL Metering LLC USA (DIEHL Stiftung & Co KG)*List Not Exhaustive
List of Figures
- Figure 1: Global USA Smart Water Meter Market Revenue Breakdown (billion, %) by Region 2025 & 2033
- Figure 2: Global USA Smart Water Meter Market Volume Breakdown (Million, %) by Region 2025 & 2033
- Figure 3: North America USA Smart Water Meter Market Revenue (billion), by Type 2025 & 2033
- Figure 4: North America USA Smart Water Meter Market Volume (Million), by Type 2025 & 2033
- Figure 5: North America USA Smart Water Meter Market Revenue Share (%), by Type 2025 & 2033
- Figure 6: North America USA Smart Water Meter Market Volume Share (%), by Type 2025 & 2033
- Figure 7: North America USA Smart Water Meter Market Revenue (billion), by Country 2025 & 2033
- Figure 8: North America USA Smart Water Meter Market Volume (Million), by Country 2025 & 2033
- Figure 9: North America USA Smart Water Meter Market Revenue Share (%), by Country 2025 & 2033
- Figure 10: North America USA Smart Water Meter Market Volume Share (%), by Country 2025 & 2033
- Figure 11: South America USA Smart Water Meter Market Revenue (billion), by Type 2025 & 2033
- Figure 12: South America USA Smart Water Meter Market Volume (Million), by Type 2025 & 2033
- Figure 13: South America USA Smart Water Meter Market Revenue Share (%), by Type 2025 & 2033
- Figure 14: South America USA Smart Water Meter Market Volume Share (%), by Type 2025 & 2033
- Figure 15: South America USA Smart Water Meter Market Revenue (billion), by Country 2025 & 2033
- Figure 16: South America USA Smart Water Meter Market Volume (Million), by Country 2025 & 2033
- Figure 17: South America USA Smart Water Meter Market Revenue Share (%), by Country 2025 & 2033
- Figure 18: South America USA Smart Water Meter Market Volume Share (%), by Country 2025 & 2033
- Figure 19: Europe USA Smart Water Meter Market Revenue (billion), by Type 2025 & 2033
- Figure 20: Europe USA Smart Water Meter Market Volume (Million), by Type 2025 & 2033
- Figure 21: Europe USA Smart Water Meter Market Revenue Share (%), by Type 2025 & 2033
- Figure 22: Europe USA Smart Water Meter Market Volume Share (%), by Type 2025 & 2033
- Figure 23: Europe USA Smart Water Meter Market Revenue (billion), by Country 2025 & 2033
- Figure 24: Europe USA Smart Water Meter Market Volume (Million), by Country 2025 & 2033
- Figure 25: Europe USA Smart Water Meter Market Revenue Share (%), by Country 2025 & 2033
- Figure 26: Europe USA Smart Water Meter Market Volume Share (%), by Country 2025 & 2033
- Figure 27: Middle East & Africa USA Smart Water Meter Market Revenue (billion), by Type 2025 & 2033
- Figure 28: Middle East & Africa USA Smart Water Meter Market Volume (Million), by Type 2025 & 2033
- Figure 29: Middle East & Africa USA Smart Water Meter Market Revenue Share (%), by Type 2025 & 2033
- Figure 30: Middle East & Africa USA Smart Water Meter Market Volume Share (%), by Type 2025 & 2033
- Figure 31: Middle East & Africa USA Smart Water Meter Market Revenue (billion), by Country 2025 & 2033
- Figure 32: Middle East & Africa USA Smart Water Meter Market Volume (Million), by Country 2025 & 2033
- Figure 33: Middle East & Africa USA Smart Water Meter Market Revenue Share (%), by Country 2025 & 2033
- Figure 34: Middle East & Africa USA Smart Water Meter Market Volume Share (%), by Country 2025 & 2033
- Figure 35: Asia Pacific USA Smart Water Meter Market Revenue (billion), by Type 2025 & 2033
- Figure 36: Asia Pacific USA Smart Water Meter Market Volume (Million), by Type 2025 & 2033
- Figure 37: Asia Pacific USA Smart Water Meter Market Revenue Share (%), by Type 2025 & 2033
- Figure 38: Asia Pacific USA Smart Water Meter Market Volume Share (%), by Type 2025 & 2033
- Figure 39: Asia Pacific USA Smart Water Meter Market Revenue (billion), by Country 2025 & 2033
- Figure 40: Asia Pacific USA Smart Water Meter Market Volume (Million), by Country 2025 & 2033
- Figure 41: Asia Pacific USA Smart Water Meter Market Revenue Share (%), by Country 2025 & 2033
- Figure 42: Asia Pacific USA Smart Water Meter Market Volume Share (%), by Country 2025 & 2033
List of Tables
- Table 1: Global USA Smart Water Meter Market Revenue billion Forecast, by Type 2020 & 2033
- Table 2: Global USA Smart Water Meter Market Volume Million Forecast, by Type 2020 & 2033
- Table 3: Global USA Smart Water Meter Market Revenue billion Forecast, by Region 2020 & 2033
- Table 4: Global USA Smart Water Meter Market Volume Million Forecast, by Region 2020 & 2033
- Table 5: Global USA Smart Water Meter Market Revenue billion Forecast, by Type 2020 & 2033
- Table 6: Global USA Smart Water Meter Market Volume Million Forecast, by Type 2020 & 2033
- Table 7: Global USA Smart Water Meter Market Revenue billion Forecast, by Country 2020 & 2033
- Table 8: Global USA Smart Water Meter Market Volume Million Forecast, by Country 2020 & 2033
- Table 9: United States USA Smart Water Meter Market Revenue (billion) Forecast, by Application 2020 & 2033
- Table 10: United States USA Smart Water Meter Market Volume (Million) Forecast, by Application 2020 & 2033
- Table 11: Canada USA Smart Water Meter Market Revenue (billion) Forecast, by Application 2020 & 2033
- Table 12: Canada USA Smart Water Meter Market Volume (Million) Forecast, by Application 2020 & 2033
- Table 13: Mexico USA Smart Water Meter Market Revenue (billion) Forecast, by Application 2020 & 2033
- Table 14: Mexico USA Smart Water Meter Market Volume (Million) Forecast, by Application 2020 & 2033
- Table 15: Global USA Smart Water Meter Market Revenue billion Forecast, by Type 2020 & 2033
- Table 16: Global USA Smart Water Meter Market Volume Million Forecast, by Type 2020 & 2033
- Table 17: Global USA Smart Water Meter Market Revenue billion Forecast, by Country 2020 & 2033
- Table 18: Global USA Smart Water Meter Market Volume Million Forecast, by Country 2020 & 2033
- Table 19: Brazil USA Smart Water Meter Market Revenue (billion) Forecast, by Application 2020 & 2033
- Table 20: Brazil USA Smart Water Meter Market Volume (Million) Forecast, by Application 2020 & 2033
- Table 21: Argentina USA Smart Water Meter Market Revenue (billion) Forecast, by Application 2020 & 2033
- Table 22: Argentina USA Smart Water Meter Market Volume (Million) Forecast, by Application 2020 & 2033
- Table 23: Rest of South America USA Smart Water Meter Market Revenue (billion) Forecast, by Application 2020 & 2033
- Table 24: Rest of South America USA Smart Water Meter Market Volume (Million) Forecast, by Application 2020 & 2033
- Table 25: Global USA Smart Water Meter Market Revenue billion Forecast, by Type 2020 & 2033
- Table 26: Global USA Smart Water Meter Market Volume Million Forecast, by Type 2020 & 2033
- Table 27: Global USA Smart Water Meter Market Revenue billion Forecast, by Country 2020 & 2033
- Table 28: Global USA Smart Water Meter Market Volume Million Forecast, by Country 2020 & 2033
- Table 29: United Kingdom USA Smart Water Meter Market Revenue (billion) Forecast, by Application 2020 & 2033
- Table 30: United Kingdom USA Smart Water Meter Market Volume (Million) Forecast, by Application 2020 & 2033
- Table 31: Germany USA Smart Water Meter Market Revenue (billion) Forecast, by Application 2020 & 2033
- Table 32: Germany USA Smart Water Meter Market Volume (Million) Forecast, by Application 2020 & 2033
- Table 33: France USA Smart Water Meter Market Revenue (billion) Forecast, by Application 2020 & 2033
- Table 34: France USA Smart Water Meter Market Volume (Million) Forecast, by Application 2020 & 2033
- Table 35: Italy USA Smart Water Meter Market Revenue (billion) Forecast, by Application 2020 & 2033
- Table 36: Italy USA Smart Water Meter Market Volume (Million) Forecast, by Application 2020 & 2033
- Table 37: Spain USA Smart Water Meter Market Revenue (billion) Forecast, by Application 2020 & 2033
- Table 38: Spain USA Smart Water Meter Market Volume (Million) Forecast, by Application 2020 & 2033
- Table 39: Russia USA Smart Water Meter Market Revenue (billion) Forecast, by Application 2020 & 2033
- Table 40: Russia USA Smart Water Meter Market Volume (Million) Forecast, by Application 2020 & 2033
- Table 41: Benelux USA Smart Water Meter Market Revenue (billion) Forecast, by Application 2020 & 2033
- Table 42: Benelux USA Smart Water Meter Market Volume (Million) Forecast, by Application 2020 & 2033
- Table 43: Nordics USA Smart Water Meter Market Revenue (billion) Forecast, by Application 2020 & 2033
- Table 44: Nordics USA Smart Water Meter Market Volume (Million) Forecast, by Application 2020 & 2033
- Table 45: Rest of Europe USA Smart Water Meter Market Revenue (billion) Forecast, by Application 2020 & 2033
- Table 46: Rest of Europe USA Smart Water Meter Market Volume (Million) Forecast, by Application 2020 & 2033
- Table 47: Global USA Smart Water Meter Market Revenue billion Forecast, by Type 2020 & 2033
- Table 48: Global USA Smart Water Meter Market Volume Million Forecast, by Type 2020 & 2033
- Table 49: Global USA Smart Water Meter Market Revenue billion Forecast, by Country 2020 & 2033
- Table 50: Global USA Smart Water Meter Market Volume Million Forecast, by Country 2020 & 2033
- Table 51: Turkey USA Smart Water Meter Market Revenue (billion) Forecast, by Application 2020 & 2033
- Table 52: Turkey USA Smart Water Meter Market Volume (Million) Forecast, by Application 2020 & 2033
- Table 53: Israel USA Smart Water Meter Market Revenue (billion) Forecast, by Application 2020 & 2033
- Table 54: Israel USA Smart Water Meter Market Volume (Million) Forecast, by Application 2020 & 2033
- Table 55: GCC USA Smart Water Meter Market Revenue (billion) Forecast, by Application 2020 & 2033
- Table 56: GCC USA Smart Water Meter Market Volume (Million) Forecast, by Application 2020 & 2033
- Table 57: North Africa USA Smart Water Meter Market Revenue (billion) Forecast, by Application 2020 & 2033
- Table 58: North Africa USA Smart Water Meter Market Volume (Million) Forecast, by Application 2020 & 2033
- Table 59: South Africa USA Smart Water Meter Market Revenue (billion) Forecast, by Application 2020 & 2033
- Table 60: South Africa USA Smart Water Meter Market Volume (Million) Forecast, by Application 2020 & 2033
- Table 61: Rest of Middle East & Africa USA Smart Water Meter Market Revenue (billion) Forecast, by Application 2020 & 2033
- Table 62: Rest of Middle East & Africa USA Smart Water Meter Market Volume (Million) Forecast, by Application 2020 & 2033
- Table 63: Global USA Smart Water Meter Market Revenue billion Forecast, by Type 2020 & 2033
- Table 64: Global USA Smart Water Meter Market Volume Million Forecast, by Type 2020 & 2033
- Table 65: Global USA Smart Water Meter Market Revenue billion Forecast, by Country 2020 & 2033
- Table 66: Global USA Smart Water Meter Market Volume Million Forecast, by Country 2020 & 2033
- Table 67: China USA Smart Water Meter Market Revenue (billion) Forecast, by Application 2020 & 2033
- Table 68: China USA Smart Water Meter Market Volume (Million) Forecast, by Application 2020 & 2033
- Table 69: India USA Smart Water Meter Market Revenue (billion) Forecast, by Application 2020 & 2033
- Table 70: India USA Smart Water Meter Market Volume (Million) Forecast, by Application 2020 & 2033
- Table 71: Japan USA Smart Water Meter Market Revenue (billion) Forecast, by Application 2020 & 2033
- Table 72: Japan USA Smart Water Meter Market Volume (Million) Forecast, by Application 2020 & 2033
- Table 73: South Korea USA Smart Water Meter Market Revenue (billion) Forecast, by Application 2020 & 2033
- Table 74: South Korea USA Smart Water Meter Market Volume (Million) Forecast, by Application 2020 & 2033
- Table 75: ASEAN USA Smart Water Meter Market Revenue (billion) Forecast, by Application 2020 & 2033
- Table 76: ASEAN USA Smart Water Meter Market Volume (Million) Forecast, by Application 2020 & 2033
- Table 77: Oceania USA Smart Water Meter Market Revenue (billion) Forecast, by Application 2020 & 2033
- Table 78: Oceania USA Smart Water Meter Market Volume (Million) Forecast, by Application 2020 & 2033
- Table 79: Rest of Asia Pacific USA Smart Water Meter Market Revenue (billion) Forecast, by Application 2020 & 2033
- Table 80: Rest of Asia Pacific USA Smart Water Meter Market Volume (Million) Forecast, by Application 2020 & 2033
Frequently Asked Questions
1. What is the projected Compound Annual Growth Rate (CAGR) of the USA Smart Water Meter Market?
The projected CAGR is approximately 26.2%.
2. Which companies are prominent players in the USA Smart Water Meter Market?
Key companies in the market include DIEHL Metering LLC USA (DIEHL Stiftung & Co KG)*List Not Exhaustive, Badger Meter Inc, Muller Systems LLC, Honeywell International Inc, Metron-Farnier Inc, Neptune Technology Group Inc, Kamstrup Water Metering LLC (Kamstrup A/S), Zenner USA Inc, Carlon Meter Inc, Sensus USA Inc, Master Meter Inc.
3. What are the main segments of the USA Smart Water Meter Market?
The market segments include Type.
4. Can you provide details about the market size?
The market size is estimated to be USD 4.1 billion as of 2022.
5. What are some drivers contributing to market growth?
Supportive State Regulations and Growing Awareness of the Wastage of Water; Fast-Paced Development of Water Infrastructure.
6. What are the notable trends driving market growth?
Fast-paced Development of Water Infrastructure is Expected to Drive the Market.
7. Are there any restraints impacting market growth?
Costs Involved With Installation by Utility Providers and Security and Integration Challenges.
8. Can you provide examples of recent developments in the market?
August 2023 - Mueller Systems announced that the City of South Daytona, Florida, will soon begin deploying its Network as a Service (NaaS) AMI system with LoRaWAN. Mueller explains that by using the LoRaWAN endpoint, South Daytona can gather data on its customers' water consumption more effectively and monitor them in real-time. Mueller mentioned that requests for on-demand reads can be made immediately and received without delay at this communication speed. Customer service and operations data are available in near real-time, enabling quicker detection and resolution of leaks or billing problems.
9. What pricing options are available for accessing the report?
Pricing options include single-user, multi-user, and enterprise licenses priced at USD 3800, USD 4500, and USD 5800 respectively.
10. Is the market size provided in terms of value or volume?
The market size is provided in terms of value, measured in billion and volume, measured in Million.
11. Are there any specific market keywords associated with the report?
Yes, the market keyword associated with the report is "USA Smart Water Meter Market," which aids in identifying and referencing the specific market segment covered.
12. How do I determine which pricing option suits my needs best?
The pricing options vary based on user requirements and access needs. Individual users may opt for single-user licenses, while businesses requiring broader access may choose multi-user or enterprise licenses for cost-effective access to the report.
13. Are there any additional resources or data provided in the USA Smart Water Meter Market report?
While the report offers comprehensive insights, it's advisable to review the specific contents or supplementary materials provided to ascertain if additional resources or data are available.
14. How can I stay updated on further developments or reports in the USA Smart Water Meter Market?
To stay informed about further developments, trends, and reports in the USA Smart Water Meter Market, consider subscribing to industry newsletters, following relevant companies and organizations, or regularly checking reputable industry news sources and publications.
Methodology
Step 1 - Identification of Relevant Samples Size from Population Database


Step 2 - Approaches for Defining Global Market Size (Value, Volume* & Price*)

Note*: In applicable scenarios
Step 3 - Data Sources
Primary Research
- Web Analytics
- Survey Reports
- Research Institute
- Latest Research Reports
- Opinion Leaders
Secondary Research
- Annual Reports
- White Paper
- Latest Press Release
- Industry Association
- Paid Database
- Investor Presentations

Step 4 - Data Triangulation
Involves using different sources of information in order to increase the validity of a study
These sources are likely to be stakeholders in a program - participants, other researchers, program staff, other community members, and so on.
Then we put all data in single framework & apply various statistical tools to find out the dynamic on the market.
During the analysis stage, feedback from the stakeholder groups would be compared to determine areas of agreement as well as areas of divergence