

Key Insights
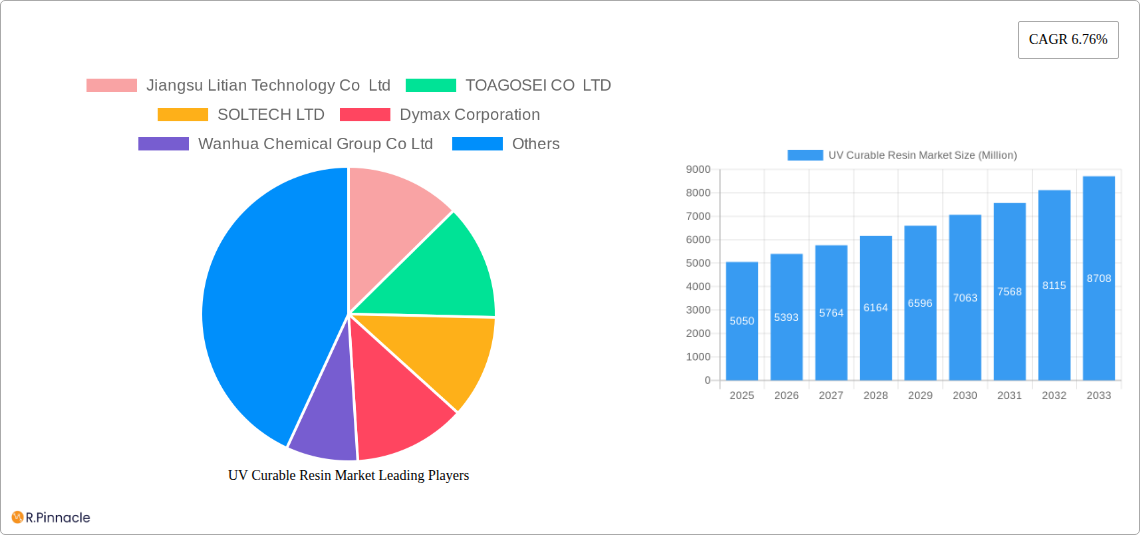
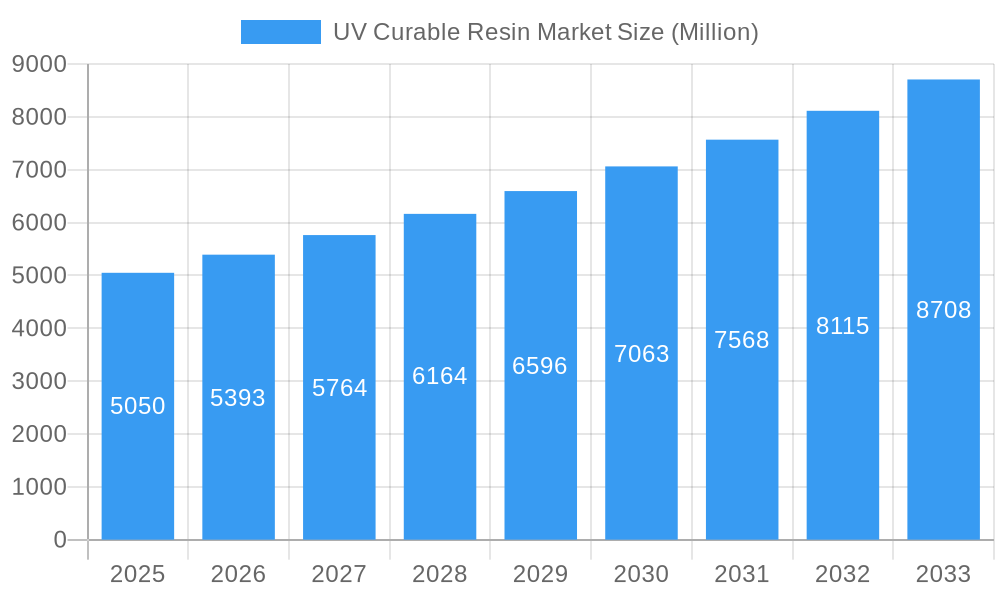
The UV curable resin market is experiencing robust growth, projected to reach a market size of $5.05 billion in 2025, expanding at a Compound Annual Growth Rate (CAGR) of 6.76%. This growth is fueled by several key drivers. The increasing demand for high-performance coatings in electronics manufacturing, driven by the miniaturization and sophistication of electronic devices, is a significant factor. The automotive industry's adoption of UV curable resins for lightweighting and improved aesthetics is another major contributor. Furthermore, the expanding medical device sector requires biocompatible and rapidly curing resins for applications like implantable devices and diagnostic tools, bolstering market demand. The packaging industry’s shift toward sustainable and high-speed printing solutions further fuels the growth trajectory. Specific resin types like acrylated epoxies and urethanes are witnessing particularly strong demand due to their versatility and superior performance characteristics. Growth is geographically diverse, with North America and Asia-Pacific acting as key market players.
UV Curable Resin Market Market Size (In Billion)
However, several factors could potentially restrain market growth. Fluctuations in raw material prices, particularly for photoinitiators and monomers, can impact profitability and potentially dampen investment. Stricter environmental regulations on volatile organic compounds (VOCs) could necessitate costly adjustments in manufacturing processes for some market participants. Furthermore, competition from alternative curing technologies, such as electron beam curing, might affect the growth rate. Despite these potential constraints, the overall market outlook remains positive, driven by continuous technological advancements, innovative applications in emerging sectors (like 3D printing and flexible electronics), and a growing preference for high-performance, eco-friendly solutions across various end-use industries. Segment-wise, the coatings application is expected to dominate the market, followed by printing and adhesives & sealants. Leading companies like BASF, Arkema, and DSM are strategically positioning themselves for market leadership through innovation, acquisitions, and global expansions.
UV Curable Resin Market Company Market Share
UV Curable Resin Market Report: A Comprehensive Analysis (2019-2033)
This in-depth report provides a comprehensive analysis of the UV Curable Resin market, offering valuable insights for industry professionals, investors, and strategic decision-makers. The study covers the period from 2019 to 2033, with a focus on the base year 2025 and a forecast period of 2025-2033. The market is segmented by application (Coating, Printing, Adhesives and Sealants, Others), end-user industry (Electronics, Industrial Coatings, Medical, Automotive, Packaging), resin type (Acrylated Epoxies, Acrylated Polyesters, Acrylated Urethanes, Acrylated Silicones, Others), and composition (Monomers, Photoinitiators, Oligomers, Coinitiators). Key players analyzed include Jiangsu Litian Technology Co Ltd, TOAGOSEI CO LTD, SOLTECH LTD, Dymax Corporation, Wanhua Chemical Group Co Ltd, BASF SE, Arkema Group, DSM, Resonac Holdings Corporation, Nippon-Gohsei, Allnex, Covestro AG, DIC CORPORATION, Eternal Materials Co Ltd, and IGM Resins.
UV Curable Resin Market Market Structure & Innovation Trends
This section delves into the competitive landscape of the UV Curable Resin market, analyzing market concentration, innovation drivers, regulatory frameworks, product substitutes, end-user demographics, and M&A activities. We examine market share distribution among key players, revealing the level of market fragmentation. The report analyzes the impact of regulatory changes and evolving consumer preferences on market dynamics. Further, the analysis includes a review of significant mergers and acquisitions (M&A) within the industry, providing insights into deal values and strategic implications. For example, we assess the influence of acquisitions on market share consolidation and technological advancements. The xx Million market is experiencing a [insert description: e.g., moderate level of consolidation, with the top 5 players holding approximately xx% of the market share]. Innovation drivers are explored, including advancements in resin chemistry and the growing demand for high-performance materials. We also analyze the impact of substitute materials and evolving end-user demographics on market growth.
- Market Concentration: xx% market share held by top 5 players.
- M&A Activity: Analysis of recent deals with estimated values (xx Million).
- Innovation Drivers: Advancements in resin chemistry and formulation.
- Regulatory Landscape: Impact of environmental regulations and safety standards.
UV Curable Resin Market Market Dynamics & Trends
This section provides a detailed analysis of market growth drivers, technological disruptions, consumer preferences, and competitive dynamics within the UV Curable Resin market. We project a Compound Annual Growth Rate (CAGR) of xx% during the forecast period (2025-2033), driven by factors such as the increasing demand from the electronics and automotive industries and advancements in UV curing technology. The report examines the market penetration of various resin types across different applications and end-user industries. The influence of technological advancements, like the development of new photoinitiators and improved curing processes, is also scrutinized. Furthermore, we assess the evolving consumer preferences regarding sustainability and the impact of competitive strategies on market share dynamics. Specific metrics such as market penetration rates for different resin types and the adoption rate of new technologies are presented.
Dominant Regions & Segments in UV Curable Resin Market
This section identifies the leading regions and segments within the UV Curable Resin market. The analysis considers geographical variations in market size and growth rates, pinpointing regions with significant market potential. Dominant segments are identified across applications, end-user industries, resin types, and compositions, based on their market share and growth prospects. We further explore the underlying drivers for dominance, considering regional economic conditions, government policies, and industrial development.
- Leading Region: [Name of region] – accounting for xx% of the market in 2025.
- Key Drivers: [List bullet points: e.g., robust economic growth, supportive government policies, well-developed infrastructure].
- Dominant Application Segment: [Name of segment] – due to its [Describe reasons: e.g., wide applicability, cost-effectiveness].
- Fastest Growing Segment: [Name of segment] - projected CAGR of xx% during the forecast period due to [Describe reasons: e.g., emergence of new applications, technological advancements].
UV Curable Resin Market Product Innovations
This section summarizes the latest product developments in UV curable resins, emphasizing technological advancements that enhance performance and expand applications. The focus is on innovative features, improved curing efficiency, and the competitive advantages offered by new products. The emergence of bio-based resins and environmentally friendly formulations are examined. Recent innovations address the demand for higher performance and sustainability in the UV curable resin market.
Report Scope & Segmentation Analysis
This report comprehensively segments the UV Curable Resin market by Application (Coating, Printing, Adhesives and Sealants, Others), End-user Industry (Electronics, Industrial Coatings, Medical, Automotive, Packaging), Resin Type (Acrylated Epoxies, Acrylated Polyesters, Acrylated Urethanes, Acrylated Silicones, Others), and Composition (Monomers, Photoinitiators, Oligomers, Coinitiators). Each segment's market size, growth projections, and competitive landscape are detailed. The report provides a clear understanding of the market structure and opportunities within each segment.
Key Drivers of UV Curable Resin Market Growth
The growth of the UV Curable Resin market is fueled by several key factors. The increasing demand for high-performance coatings in electronics and automotive applications is a significant driver. Advancements in UV curing technology, leading to faster curing times and improved efficiency, are also contributing to market expansion. Government regulations promoting sustainable manufacturing practices are further driving the adoption of UV curable resins.
Challenges in the UV Curable Resin Market Sector
The UV Curable Resin market faces certain challenges, including the volatility of raw material prices and the stringent regulatory requirements for the use of certain chemicals. Competition from alternative technologies and potential supply chain disruptions present additional obstacles. These factors can impact production costs and market profitability.
Emerging Opportunities in UV Curable Resin Market
Emerging opportunities lie in the development of bio-based UV curable resins and the expansion into new applications, such as 3D printing and flexible electronics. Growing demand in developing economies and the increasing focus on sustainable manufacturing offer significant potential for market growth.
Leading Players in the UV Curable Resin Market Market
- Jiangsu Litian Technology Co Ltd
- TOAGOSEI CO LTD
- SOLTECH LTD
- Dymax Corporation
- Wanhua Chemical Group Co Ltd
- BASF SE
- Arkema Group
- DSM
- Resonac Holdings Corporation
- Nippon-Gohsei
- Allnex
- Covestro AG
- DIC CORPORATION
- Eternal Materials Co Ltd
- IGM Resins
Key Developments in UV Curable Resin Market Industry
- [Insert bullet points of key developments with year/month, e.g., "January 2023: Company X launched a new UV curable resin with enhanced UV resistance."]
Future Outlook for UV Curable Resin Market Market
The future of the UV Curable Resin market looks promising, driven by technological innovation and the expansion into new applications. Continued growth is expected, especially in high-growth regions and sectors. Strategic partnerships and investments in research and development will play a crucial role in shaping the future of this market.
UV Curable Resin Market Segmentation
-
1. Resin Type
- 1.1. Acrylated Epoxies
- 1.2. Acrylated Polysters
- 1.3. Acrylated Urethanes
- 1.4. Acrylated Silicones
- 1.5. Others
-
2. Composition
- 2.1. Monomers
- 2.2. Photoinitiators
- 2.3. Oligomers
- 2.4. Coinitiators
-
3. Application
- 3.1. Coating
- 3.2. Printing
- 3.3. Adhesives and Sealants
- 3.4. Others
-
4. End-user Industry
- 4.1. Electronics
- 4.2. Industrial Coatings
- 4.3. Medical
- 4.4. Automotive
- 4.5. Packaging
UV Curable Resin Market Segmentation By Geography
-
1. Asia Pacific
- 1.1. China
- 1.2. India
- 1.3. Japan
- 1.4. South Korea
- 1.5. Rest of Asia Pacific
-
2. North America
- 2.1. United States
- 2.2. Canada
- 2.3. Mexico
-
3. Europe
- 3.1. Germany
- 3.2. United Kingdom
- 3.3. Italy
- 3.4. France
- 3.5. Rest of Europe
-
4. South America
- 4.1. Brazil
- 4.2. Argentina
- 4.3. Rest of South America
-
5. Middle East and Africa
- 5.1. Saudi Arabia
- 5.2. South Africa
- 5.3. Rest of Middle East
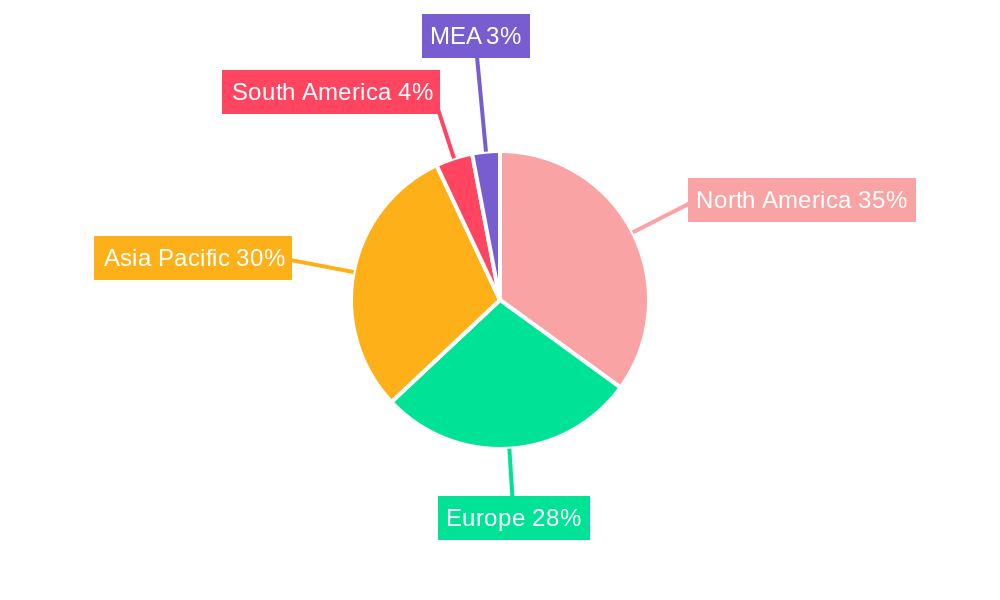
UV Curable Resin Market Regional Market Share
Geographic Coverage of UV Curable Resin Market
UV Curable Resin Market REPORT HIGHLIGHTS
| Aspects | Details |
|---|---|
| Study Period | 2020-2034 |
| Base Year | 2025 |
| Estimated Year | 2026 |
| Forecast Period | 2026-2034 |
| Historical Period | 2020-2025 |
| Growth Rate | CAGR of 6.76% from 2020-2034 |
| Segmentation |
|
Table of Contents
- 1. Introduction
- 1.1. Research Scope
- 1.2. Market Segmentation
- 1.3. Research Objective
- 1.4. Definitions and Assumptions
- 2. Executive Summary
- 2.1. Market Snapshot
- 3. Market Dynamics
- 3.1. Market Drivers
- 3.2. Market Restrains
- 3.3. Market Trends
- 3.4. Market Opportunities
- 4. Market Factor Analysis
- 4.1. Porters Five Forces
- 4.1.1. Bargaining Power of Suppliers
- 4.1.2. Bargaining Power of Buyers
- 4.1.3. Threat of New Entrants
- 4.1.4. Threat of Substitutes
- 4.1.5. Competitive Rivalry
- 4.2. PESTEL analysis
- 4.3. BCG Analysis
- 4.3.1. Stars (High Growth, High Market Share)
- 4.3.2. Cash Cows (Low Growth, High Market Share)
- 4.3.3. Question Mark (High Growth, Low Market Share)
- 4.3.4. Dogs (Low Growth, Low Market Share)
- 4.4. Ansoff Matrix Analysis
- 4.5. Supply Chain Analysis
- 4.6. Regulatory Landscape
- 4.7. Current Market Potential and Opportunity Assessment (TAM–SAM–SOM Framework)
- 4.8. PRI Analyst Note
- 4.1. Porters Five Forces
- 5. Market Analysis, Insights and Forecast 2021-2033
- 5.1. Market Analysis, Insights and Forecast - by Resin Type
- 5.1.1. Acrylated Epoxies
- 5.1.2. Acrylated Polysters
- 5.1.3. Acrylated Urethanes
- 5.1.4. Acrylated Silicones
- 5.1.5. Others
- 5.2. Market Analysis, Insights and Forecast - by Composition
- 5.2.1. Monomers
- 5.2.2. Photoinitiators
- 5.2.3. Oligomers
- 5.2.4. Coinitiators
- 5.3. Market Analysis, Insights and Forecast - by Application
- 5.3.1. Coating
- 5.3.2. Printing
- 5.3.3. Adhesives and Sealants
- 5.3.4. Others
- 5.4. Market Analysis, Insights and Forecast - by End-user Industry
- 5.4.1. Electronics
- 5.4.2. Industrial Coatings
- 5.4.3. Medical
- 5.4.4. Automotive
- 5.4.5. Packaging
- 5.5. Market Analysis, Insights and Forecast - by Region
- 5.5.1. Asia Pacific
- 5.5.2. North America
- 5.5.3. Europe
- 5.5.4. South America
- 5.5.5. Middle East and Africa
- 5.1. Market Analysis, Insights and Forecast - by Resin Type
- 6. Global UV Curable Resin Market Analysis, Insights and Forecast, 2021-2033
- 6.1. Market Analysis, Insights and Forecast - by Resin Type
- 6.1.1. Acrylated Epoxies
- 6.1.2. Acrylated Polysters
- 6.1.3. Acrylated Urethanes
- 6.1.4. Acrylated Silicones
- 6.1.5. Others
- 6.2. Market Analysis, Insights and Forecast - by Composition
- 6.2.1. Monomers
- 6.2.2. Photoinitiators
- 6.2.3. Oligomers
- 6.2.4. Coinitiators
- 6.3. Market Analysis, Insights and Forecast - by Application
- 6.3.1. Coating
- 6.3.2. Printing
- 6.3.3. Adhesives and Sealants
- 6.3.4. Others
- 6.4. Market Analysis, Insights and Forecast - by End-user Industry
- 6.4.1. Electronics
- 6.4.2. Industrial Coatings
- 6.4.3. Medical
- 6.4.4. Automotive
- 6.4.5. Packaging
- 6.1. Market Analysis, Insights and Forecast - by Resin Type
- 7. Asia Pacific UV Curable Resin Market Analysis, Insights and Forecast, 2020-2032
- 7.1. Market Analysis, Insights and Forecast - by Resin Type
- 7.1.1. Acrylated Epoxies
- 7.1.2. Acrylated Polysters
- 7.1.3. Acrylated Urethanes
- 7.1.4. Acrylated Silicones
- 7.1.5. Others
- 7.2. Market Analysis, Insights and Forecast - by Composition
- 7.2.1. Monomers
- 7.2.2. Photoinitiators
- 7.2.3. Oligomers
- 7.2.4. Coinitiators
- 7.3. Market Analysis, Insights and Forecast - by Application
- 7.3.1. Coating
- 7.3.2. Printing
- 7.3.3. Adhesives and Sealants
- 7.3.4. Others
- 7.4. Market Analysis, Insights and Forecast - by End-user Industry
- 7.4.1. Electronics
- 7.4.2. Industrial Coatings
- 7.4.3. Medical
- 7.4.4. Automotive
- 7.4.5. Packaging
- 7.1. Market Analysis, Insights and Forecast - by Resin Type
- 8. North America UV Curable Resin Market Analysis, Insights and Forecast, 2020-2032
- 8.1. Market Analysis, Insights and Forecast - by Resin Type
- 8.1.1. Acrylated Epoxies
- 8.1.2. Acrylated Polysters
- 8.1.3. Acrylated Urethanes
- 8.1.4. Acrylated Silicones
- 8.1.5. Others
- 8.2. Market Analysis, Insights and Forecast - by Composition
- 8.2.1. Monomers
- 8.2.2. Photoinitiators
- 8.2.3. Oligomers
- 8.2.4. Coinitiators
- 8.3. Market Analysis, Insights and Forecast - by Application
- 8.3.1. Coating
- 8.3.2. Printing
- 8.3.3. Adhesives and Sealants
- 8.3.4. Others
- 8.4. Market Analysis, Insights and Forecast - by End-user Industry
- 8.4.1. Electronics
- 8.4.2. Industrial Coatings
- 8.4.3. Medical
- 8.4.4. Automotive
- 8.4.5. Packaging
- 8.1. Market Analysis, Insights and Forecast - by Resin Type
- 9. Europe UV Curable Resin Market Analysis, Insights and Forecast, 2020-2032
- 9.1. Market Analysis, Insights and Forecast - by Resin Type
- 9.1.1. Acrylated Epoxies
- 9.1.2. Acrylated Polysters
- 9.1.3. Acrylated Urethanes
- 9.1.4. Acrylated Silicones
- 9.1.5. Others
- 9.2. Market Analysis, Insights and Forecast - by Composition
- 9.2.1. Monomers
- 9.2.2. Photoinitiators
- 9.2.3. Oligomers
- 9.2.4. Coinitiators
- 9.3. Market Analysis, Insights and Forecast - by Application
- 9.3.1. Coating
- 9.3.2. Printing
- 9.3.3. Adhesives and Sealants
- 9.3.4. Others
- 9.4. Market Analysis, Insights and Forecast - by End-user Industry
- 9.4.1. Electronics
- 9.4.2. Industrial Coatings
- 9.4.3. Medical
- 9.4.4. Automotive
- 9.4.5. Packaging
- 9.1. Market Analysis, Insights and Forecast - by Resin Type
- 10. South America UV Curable Resin Market Analysis, Insights and Forecast, 2020-2032
- 10.1. Market Analysis, Insights and Forecast - by Resin Type
- 10.1.1. Acrylated Epoxies
- 10.1.2. Acrylated Polysters
- 10.1.3. Acrylated Urethanes
- 10.1.4. Acrylated Silicones
- 10.1.5. Others
- 10.2. Market Analysis, Insights and Forecast - by Composition
- 10.2.1. Monomers
- 10.2.2. Photoinitiators
- 10.2.3. Oligomers
- 10.2.4. Coinitiators
- 10.3. Market Analysis, Insights and Forecast - by Application
- 10.3.1. Coating
- 10.3.2. Printing
- 10.3.3. Adhesives and Sealants
- 10.3.4. Others
- 10.4. Market Analysis, Insights and Forecast - by End-user Industry
- 10.4.1. Electronics
- 10.4.2. Industrial Coatings
- 10.4.3. Medical
- 10.4.4. Automotive
- 10.4.5. Packaging
- 10.1. Market Analysis, Insights and Forecast - by Resin Type
- 11. Middle East and Africa UV Curable Resin Market Analysis, Insights and Forecast, 2020-2032
- 11.1. Market Analysis, Insights and Forecast - by Resin Type
- 11.1.1. Acrylated Epoxies
- 11.1.2. Acrylated Polysters
- 11.1.3. Acrylated Urethanes
- 11.1.4. Acrylated Silicones
- 11.1.5. Others
- 11.2. Market Analysis, Insights and Forecast - by Composition
- 11.2.1. Monomers
- 11.2.2. Photoinitiators
- 11.2.3. Oligomers
- 11.2.4. Coinitiators
- 11.3. Market Analysis, Insights and Forecast - by Application
- 11.3.1. Coating
- 11.3.2. Printing
- 11.3.3. Adhesives and Sealants
- 11.3.4. Others
- 11.4. Market Analysis, Insights and Forecast - by End-user Industry
- 11.4.1. Electronics
- 11.4.2. Industrial Coatings
- 11.4.3. Medical
- 11.4.4. Automotive
- 11.4.5. Packaging
- 11.1. Market Analysis, Insights and Forecast - by Resin Type
- 12. Competitive Analysis
- 12.1. Company Profiles
- 12.1.1 Jiangsu Litian Technology Co Ltd
- 12.1.1.1. Company Overview
- 12.1.1.2. Products
- 12.1.1.3. Company Financials
- 12.1.1.4. SWOT Analysis
- 12.1.2 TOAGOSEI CO LTD
- 12.1.2.1. Company Overview
- 12.1.2.2. Products
- 12.1.2.3. Company Financials
- 12.1.2.4. SWOT Analysis
- 12.1.3 SOLTECH LTD
- 12.1.3.1. Company Overview
- 12.1.3.2. Products
- 12.1.3.3. Company Financials
- 12.1.3.4. SWOT Analysis
- 12.1.4 Dymax Corporation
- 12.1.4.1. Company Overview
- 12.1.4.2. Products
- 12.1.4.3. Company Financials
- 12.1.4.4. SWOT Analysis
- 12.1.5 Wanhua Chemical Group Co Ltd
- 12.1.5.1. Company Overview
- 12.1.5.2. Products
- 12.1.5.3. Company Financials
- 12.1.5.4. SWOT Analysis
- 12.1.6 BASF SE
- 12.1.6.1. Company Overview
- 12.1.6.2. Products
- 12.1.6.3. Company Financials
- 12.1.6.4. SWOT Analysis
- 12.1.7 Arkema Group
- 12.1.7.1. Company Overview
- 12.1.7.2. Products
- 12.1.7.3. Company Financials
- 12.1.7.4. SWOT Analysis
- 12.1.8 DSM
- 12.1.8.1. Company Overview
- 12.1.8.2. Products
- 12.1.8.3. Company Financials
- 12.1.8.4. SWOT Analysis
- 12.1.9 Resonac Holdings Corporation
- 12.1.9.1. Company Overview
- 12.1.9.2. Products
- 12.1.9.3. Company Financials
- 12.1.9.4. SWOT Analysis
- 12.1.10 Nippon-Gohsei
- 12.1.10.1. Company Overview
- 12.1.10.2. Products
- 12.1.10.3. Company Financials
- 12.1.10.4. SWOT Analysis
- 12.1.11 Allnex
- 12.1.11.1. Company Overview
- 12.1.11.2. Products
- 12.1.11.3. Company Financials
- 12.1.11.4. SWOT Analysis
- 12.1.12 Covestro AG
- 12.1.12.1. Company Overview
- 12.1.12.2. Products
- 12.1.12.3. Company Financials
- 12.1.12.4. SWOT Analysis
- 12.1.13 DIC CORPORATION
- 12.1.13.1. Company Overview
- 12.1.13.2. Products
- 12.1.13.3. Company Financials
- 12.1.13.4. SWOT Analysis
- 12.1.14 Eternal Materials Co Ltd
- 12.1.14.1. Company Overview
- 12.1.14.2. Products
- 12.1.14.3. Company Financials
- 12.1.14.4. SWOT Analysis
- 12.1.15 IGM Resins
- 12.1.15.1. Company Overview
- 12.1.15.2. Products
- 12.1.15.3. Company Financials
- 12.1.15.4. SWOT Analysis
- 12.1.1 Jiangsu Litian Technology Co Ltd
- 12.2. Market Entropy
- 12.2.1 Company's Key Areas Served
- 12.2.2 Recent Developments
- 12.3. Company Market Share Analysis 2025
- 12.3.1 Top 5 Companies Market Share Analysis
- 12.3.2 Top 3 Companies Market Share Analysis
- 12.4. List of Potential Customers
- 13. Research Methodology
List of Figures
- Figure 1: Global UV Curable Resin Market Revenue Breakdown (Million, %) by Region 2025 & 2033
- Figure 2: Global UV Curable Resin Market Volume Breakdown (K Tons, %) by Region 2025 & 2033
- Figure 3: Asia Pacific UV Curable Resin Market Revenue (Million), by Resin Type 2025 & 2033
- Figure 4: Asia Pacific UV Curable Resin Market Volume (K Tons), by Resin Type 2025 & 2033
- Figure 5: Asia Pacific UV Curable Resin Market Revenue Share (%), by Resin Type 2025 & 2033
- Figure 6: Asia Pacific UV Curable Resin Market Volume Share (%), by Resin Type 2025 & 2033
- Figure 7: Asia Pacific UV Curable Resin Market Revenue (Million), by Composition 2025 & 2033
- Figure 8: Asia Pacific UV Curable Resin Market Volume (K Tons), by Composition 2025 & 2033
- Figure 9: Asia Pacific UV Curable Resin Market Revenue Share (%), by Composition 2025 & 2033
- Figure 10: Asia Pacific UV Curable Resin Market Volume Share (%), by Composition 2025 & 2033
- Figure 11: Asia Pacific UV Curable Resin Market Revenue (Million), by Application 2025 & 2033
- Figure 12: Asia Pacific UV Curable Resin Market Volume (K Tons), by Application 2025 & 2033
- Figure 13: Asia Pacific UV Curable Resin Market Revenue Share (%), by Application 2025 & 2033
- Figure 14: Asia Pacific UV Curable Resin Market Volume Share (%), by Application 2025 & 2033
- Figure 15: Asia Pacific UV Curable Resin Market Revenue (Million), by End-user Industry 2025 & 2033
- Figure 16: Asia Pacific UV Curable Resin Market Volume (K Tons), by End-user Industry 2025 & 2033
- Figure 17: Asia Pacific UV Curable Resin Market Revenue Share (%), by End-user Industry 2025 & 2033
- Figure 18: Asia Pacific UV Curable Resin Market Volume Share (%), by End-user Industry 2025 & 2033
- Figure 19: Asia Pacific UV Curable Resin Market Revenue (Million), by Country 2025 & 2033
- Figure 20: Asia Pacific UV Curable Resin Market Volume (K Tons), by Country 2025 & 2033
- Figure 21: Asia Pacific UV Curable Resin Market Revenue Share (%), by Country 2025 & 2033
- Figure 22: Asia Pacific UV Curable Resin Market Volume Share (%), by Country 2025 & 2033
- Figure 23: North America UV Curable Resin Market Revenue (Million), by Resin Type 2025 & 2033
- Figure 24: North America UV Curable Resin Market Volume (K Tons), by Resin Type 2025 & 2033
- Figure 25: North America UV Curable Resin Market Revenue Share (%), by Resin Type 2025 & 2033
- Figure 26: North America UV Curable Resin Market Volume Share (%), by Resin Type 2025 & 2033
- Figure 27: North America UV Curable Resin Market Revenue (Million), by Composition 2025 & 2033
- Figure 28: North America UV Curable Resin Market Volume (K Tons), by Composition 2025 & 2033
- Figure 29: North America UV Curable Resin Market Revenue Share (%), by Composition 2025 & 2033
- Figure 30: North America UV Curable Resin Market Volume Share (%), by Composition 2025 & 2033
- Figure 31: North America UV Curable Resin Market Revenue (Million), by Application 2025 & 2033
- Figure 32: North America UV Curable Resin Market Volume (K Tons), by Application 2025 & 2033
- Figure 33: North America UV Curable Resin Market Revenue Share (%), by Application 2025 & 2033
- Figure 34: North America UV Curable Resin Market Volume Share (%), by Application 2025 & 2033
- Figure 35: North America UV Curable Resin Market Revenue (Million), by End-user Industry 2025 & 2033
- Figure 36: North America UV Curable Resin Market Volume (K Tons), by End-user Industry 2025 & 2033
- Figure 37: North America UV Curable Resin Market Revenue Share (%), by End-user Industry 2025 & 2033
- Figure 38: North America UV Curable Resin Market Volume Share (%), by End-user Industry 2025 & 2033
- Figure 39: North America UV Curable Resin Market Revenue (Million), by Country 2025 & 2033
- Figure 40: North America UV Curable Resin Market Volume (K Tons), by Country 2025 & 2033
- Figure 41: North America UV Curable Resin Market Revenue Share (%), by Country 2025 & 2033
- Figure 42: North America UV Curable Resin Market Volume Share (%), by Country 2025 & 2033
- Figure 43: Europe UV Curable Resin Market Revenue (Million), by Resin Type 2025 & 2033
- Figure 44: Europe UV Curable Resin Market Volume (K Tons), by Resin Type 2025 & 2033
- Figure 45: Europe UV Curable Resin Market Revenue Share (%), by Resin Type 2025 & 2033
- Figure 46: Europe UV Curable Resin Market Volume Share (%), by Resin Type 2025 & 2033
- Figure 47: Europe UV Curable Resin Market Revenue (Million), by Composition 2025 & 2033
- Figure 48: Europe UV Curable Resin Market Volume (K Tons), by Composition 2025 & 2033
- Figure 49: Europe UV Curable Resin Market Revenue Share (%), by Composition 2025 & 2033
- Figure 50: Europe UV Curable Resin Market Volume Share (%), by Composition 2025 & 2033
- Figure 51: Europe UV Curable Resin Market Revenue (Million), by Application 2025 & 2033
- Figure 52: Europe UV Curable Resin Market Volume (K Tons), by Application 2025 & 2033
- Figure 53: Europe UV Curable Resin Market Revenue Share (%), by Application 2025 & 2033
- Figure 54: Europe UV Curable Resin Market Volume Share (%), by Application 2025 & 2033
- Figure 55: Europe UV Curable Resin Market Revenue (Million), by End-user Industry 2025 & 2033
- Figure 56: Europe UV Curable Resin Market Volume (K Tons), by End-user Industry 2025 & 2033
- Figure 57: Europe UV Curable Resin Market Revenue Share (%), by End-user Industry 2025 & 2033
- Figure 58: Europe UV Curable Resin Market Volume Share (%), by End-user Industry 2025 & 2033
- Figure 59: Europe UV Curable Resin Market Revenue (Million), by Country 2025 & 2033
- Figure 60: Europe UV Curable Resin Market Volume (K Tons), by Country 2025 & 2033
- Figure 61: Europe UV Curable Resin Market Revenue Share (%), by Country 2025 & 2033
- Figure 62: Europe UV Curable Resin Market Volume Share (%), by Country 2025 & 2033
- Figure 63: South America UV Curable Resin Market Revenue (Million), by Resin Type 2025 & 2033
- Figure 64: South America UV Curable Resin Market Volume (K Tons), by Resin Type 2025 & 2033
- Figure 65: South America UV Curable Resin Market Revenue Share (%), by Resin Type 2025 & 2033
- Figure 66: South America UV Curable Resin Market Volume Share (%), by Resin Type 2025 & 2033
- Figure 67: South America UV Curable Resin Market Revenue (Million), by Composition 2025 & 2033
- Figure 68: South America UV Curable Resin Market Volume (K Tons), by Composition 2025 & 2033
- Figure 69: South America UV Curable Resin Market Revenue Share (%), by Composition 2025 & 2033
- Figure 70: South America UV Curable Resin Market Volume Share (%), by Composition 2025 & 2033
- Figure 71: South America UV Curable Resin Market Revenue (Million), by Application 2025 & 2033
- Figure 72: South America UV Curable Resin Market Volume (K Tons), by Application 2025 & 2033
- Figure 73: South America UV Curable Resin Market Revenue Share (%), by Application 2025 & 2033
- Figure 74: South America UV Curable Resin Market Volume Share (%), by Application 2025 & 2033
- Figure 75: South America UV Curable Resin Market Revenue (Million), by End-user Industry 2025 & 2033
- Figure 76: South America UV Curable Resin Market Volume (K Tons), by End-user Industry 2025 & 2033
- Figure 77: South America UV Curable Resin Market Revenue Share (%), by End-user Industry 2025 & 2033
- Figure 78: South America UV Curable Resin Market Volume Share (%), by End-user Industry 2025 & 2033
- Figure 79: South America UV Curable Resin Market Revenue (Million), by Country 2025 & 2033
- Figure 80: South America UV Curable Resin Market Volume (K Tons), by Country 2025 & 2033
- Figure 81: South America UV Curable Resin Market Revenue Share (%), by Country 2025 & 2033
- Figure 82: South America UV Curable Resin Market Volume Share (%), by Country 2025 & 2033
- Figure 83: Middle East and Africa UV Curable Resin Market Revenue (Million), by Resin Type 2025 & 2033
- Figure 84: Middle East and Africa UV Curable Resin Market Volume (K Tons), by Resin Type 2025 & 2033
- Figure 85: Middle East and Africa UV Curable Resin Market Revenue Share (%), by Resin Type 2025 & 2033
- Figure 86: Middle East and Africa UV Curable Resin Market Volume Share (%), by Resin Type 2025 & 2033
- Figure 87: Middle East and Africa UV Curable Resin Market Revenue (Million), by Composition 2025 & 2033
- Figure 88: Middle East and Africa UV Curable Resin Market Volume (K Tons), by Composition 2025 & 2033
- Figure 89: Middle East and Africa UV Curable Resin Market Revenue Share (%), by Composition 2025 & 2033
- Figure 90: Middle East and Africa UV Curable Resin Market Volume Share (%), by Composition 2025 & 2033
- Figure 91: Middle East and Africa UV Curable Resin Market Revenue (Million), by Application 2025 & 2033
- Figure 92: Middle East and Africa UV Curable Resin Market Volume (K Tons), by Application 2025 & 2033
- Figure 93: Middle East and Africa UV Curable Resin Market Revenue Share (%), by Application 2025 & 2033
- Figure 94: Middle East and Africa UV Curable Resin Market Volume Share (%), by Application 2025 & 2033
- Figure 95: Middle East and Africa UV Curable Resin Market Revenue (Million), by End-user Industry 2025 & 2033
- Figure 96: Middle East and Africa UV Curable Resin Market Volume (K Tons), by End-user Industry 2025 & 2033
- Figure 97: Middle East and Africa UV Curable Resin Market Revenue Share (%), by End-user Industry 2025 & 2033
- Figure 98: Middle East and Africa UV Curable Resin Market Volume Share (%), by End-user Industry 2025 & 2033
- Figure 99: Middle East and Africa UV Curable Resin Market Revenue (Million), by Country 2025 & 2033
- Figure 100: Middle East and Africa UV Curable Resin Market Volume (K Tons), by Country 2025 & 2033
- Figure 101: Middle East and Africa UV Curable Resin Market Revenue Share (%), by Country 2025 & 2033
- Figure 102: Middle East and Africa UV Curable Resin Market Volume Share (%), by Country 2025 & 2033
List of Tables
- Table 1: Global UV Curable Resin Market Revenue Million Forecast, by Resin Type 2020 & 2033
- Table 2: Global UV Curable Resin Market Volume K Tons Forecast, by Resin Type 2020 & 2033
- Table 3: Global UV Curable Resin Market Revenue Million Forecast, by Composition 2020 & 2033
- Table 4: Global UV Curable Resin Market Volume K Tons Forecast, by Composition 2020 & 2033
- Table 5: Global UV Curable Resin Market Revenue Million Forecast, by Application 2020 & 2033
- Table 6: Global UV Curable Resin Market Volume K Tons Forecast, by Application 2020 & 2033
- Table 7: Global UV Curable Resin Market Revenue Million Forecast, by End-user Industry 2020 & 2033
- Table 8: Global UV Curable Resin Market Volume K Tons Forecast, by End-user Industry 2020 & 2033
- Table 9: Global UV Curable Resin Market Revenue Million Forecast, by Region 2020 & 2033
- Table 10: Global UV Curable Resin Market Volume K Tons Forecast, by Region 2020 & 2033
- Table 11: Global UV Curable Resin Market Revenue Million Forecast, by Resin Type 2020 & 2033
- Table 12: Global UV Curable Resin Market Volume K Tons Forecast, by Resin Type 2020 & 2033
- Table 13: Global UV Curable Resin Market Revenue Million Forecast, by Composition 2020 & 2033
- Table 14: Global UV Curable Resin Market Volume K Tons Forecast, by Composition 2020 & 2033
- Table 15: Global UV Curable Resin Market Revenue Million Forecast, by Application 2020 & 2033
- Table 16: Global UV Curable Resin Market Volume K Tons Forecast, by Application 2020 & 2033
- Table 17: Global UV Curable Resin Market Revenue Million Forecast, by End-user Industry 2020 & 2033
- Table 18: Global UV Curable Resin Market Volume K Tons Forecast, by End-user Industry 2020 & 2033
- Table 19: Global UV Curable Resin Market Revenue Million Forecast, by Country 2020 & 2033
- Table 20: Global UV Curable Resin Market Volume K Tons Forecast, by Country 2020 & 2033
- Table 21: China UV Curable Resin Market Revenue (Million) Forecast, by Application 2020 & 2033
- Table 22: China UV Curable Resin Market Volume (K Tons) Forecast, by Application 2020 & 2033
- Table 23: India UV Curable Resin Market Revenue (Million) Forecast, by Application 2020 & 2033
- Table 24: India UV Curable Resin Market Volume (K Tons) Forecast, by Application 2020 & 2033
- Table 25: Japan UV Curable Resin Market Revenue (Million) Forecast, by Application 2020 & 2033
- Table 26: Japan UV Curable Resin Market Volume (K Tons) Forecast, by Application 2020 & 2033
- Table 27: South Korea UV Curable Resin Market Revenue (Million) Forecast, by Application 2020 & 2033
- Table 28: South Korea UV Curable Resin Market Volume (K Tons) Forecast, by Application 2020 & 2033
- Table 29: Rest of Asia Pacific UV Curable Resin Market Revenue (Million) Forecast, by Application 2020 & 2033
- Table 30: Rest of Asia Pacific UV Curable Resin Market Volume (K Tons) Forecast, by Application 2020 & 2033
- Table 31: Global UV Curable Resin Market Revenue Million Forecast, by Resin Type 2020 & 2033
- Table 32: Global UV Curable Resin Market Volume K Tons Forecast, by Resin Type 2020 & 2033
- Table 33: Global UV Curable Resin Market Revenue Million Forecast, by Composition 2020 & 2033
- Table 34: Global UV Curable Resin Market Volume K Tons Forecast, by Composition 2020 & 2033
- Table 35: Global UV Curable Resin Market Revenue Million Forecast, by Application 2020 & 2033
- Table 36: Global UV Curable Resin Market Volume K Tons Forecast, by Application 2020 & 2033
- Table 37: Global UV Curable Resin Market Revenue Million Forecast, by End-user Industry 2020 & 2033
- Table 38: Global UV Curable Resin Market Volume K Tons Forecast, by End-user Industry 2020 & 2033
- Table 39: Global UV Curable Resin Market Revenue Million Forecast, by Country 2020 & 2033
- Table 40: Global UV Curable Resin Market Volume K Tons Forecast, by Country 2020 & 2033
- Table 41: United States UV Curable Resin Market Revenue (Million) Forecast, by Application 2020 & 2033
- Table 42: United States UV Curable Resin Market Volume (K Tons) Forecast, by Application 2020 & 2033
- Table 43: Canada UV Curable Resin Market Revenue (Million) Forecast, by Application 2020 & 2033
- Table 44: Canada UV Curable Resin Market Volume (K Tons) Forecast, by Application 2020 & 2033
- Table 45: Mexico UV Curable Resin Market Revenue (Million) Forecast, by Application 2020 & 2033
- Table 46: Mexico UV Curable Resin Market Volume (K Tons) Forecast, by Application 2020 & 2033
- Table 47: Global UV Curable Resin Market Revenue Million Forecast, by Resin Type 2020 & 2033
- Table 48: Global UV Curable Resin Market Volume K Tons Forecast, by Resin Type 2020 & 2033
- Table 49: Global UV Curable Resin Market Revenue Million Forecast, by Composition 2020 & 2033
- Table 50: Global UV Curable Resin Market Volume K Tons Forecast, by Composition 2020 & 2033
- Table 51: Global UV Curable Resin Market Revenue Million Forecast, by Application 2020 & 2033
- Table 52: Global UV Curable Resin Market Volume K Tons Forecast, by Application 2020 & 2033
- Table 53: Global UV Curable Resin Market Revenue Million Forecast, by End-user Industry 2020 & 2033
- Table 54: Global UV Curable Resin Market Volume K Tons Forecast, by End-user Industry 2020 & 2033
- Table 55: Global UV Curable Resin Market Revenue Million Forecast, by Country 2020 & 2033
- Table 56: Global UV Curable Resin Market Volume K Tons Forecast, by Country 2020 & 2033
- Table 57: Germany UV Curable Resin Market Revenue (Million) Forecast, by Application 2020 & 2033
- Table 58: Germany UV Curable Resin Market Volume (K Tons) Forecast, by Application 2020 & 2033
- Table 59: United Kingdom UV Curable Resin Market Revenue (Million) Forecast, by Application 2020 & 2033
- Table 60: United Kingdom UV Curable Resin Market Volume (K Tons) Forecast, by Application 2020 & 2033
- Table 61: Italy UV Curable Resin Market Revenue (Million) Forecast, by Application 2020 & 2033
- Table 62: Italy UV Curable Resin Market Volume (K Tons) Forecast, by Application 2020 & 2033
- Table 63: France UV Curable Resin Market Revenue (Million) Forecast, by Application 2020 & 2033
- Table 64: France UV Curable Resin Market Volume (K Tons) Forecast, by Application 2020 & 2033
- Table 65: Rest of Europe UV Curable Resin Market Revenue (Million) Forecast, by Application 2020 & 2033
- Table 66: Rest of Europe UV Curable Resin Market Volume (K Tons) Forecast, by Application 2020 & 2033
- Table 67: Global UV Curable Resin Market Revenue Million Forecast, by Resin Type 2020 & 2033
- Table 68: Global UV Curable Resin Market Volume K Tons Forecast, by Resin Type 2020 & 2033
- Table 69: Global UV Curable Resin Market Revenue Million Forecast, by Composition 2020 & 2033
- Table 70: Global UV Curable Resin Market Volume K Tons Forecast, by Composition 2020 & 2033
- Table 71: Global UV Curable Resin Market Revenue Million Forecast, by Application 2020 & 2033
- Table 72: Global UV Curable Resin Market Volume K Tons Forecast, by Application 2020 & 2033
- Table 73: Global UV Curable Resin Market Revenue Million Forecast, by End-user Industry 2020 & 2033
- Table 74: Global UV Curable Resin Market Volume K Tons Forecast, by End-user Industry 2020 & 2033
- Table 75: Global UV Curable Resin Market Revenue Million Forecast, by Country 2020 & 2033
- Table 76: Global UV Curable Resin Market Volume K Tons Forecast, by Country 2020 & 2033
- Table 77: Brazil UV Curable Resin Market Revenue (Million) Forecast, by Application 2020 & 2033
- Table 78: Brazil UV Curable Resin Market Volume (K Tons) Forecast, by Application 2020 & 2033
- Table 79: Argentina UV Curable Resin Market Revenue (Million) Forecast, by Application 2020 & 2033
- Table 80: Argentina UV Curable Resin Market Volume (K Tons) Forecast, by Application 2020 & 2033
- Table 81: Rest of South America UV Curable Resin Market Revenue (Million) Forecast, by Application 2020 & 2033
- Table 82: Rest of South America UV Curable Resin Market Volume (K Tons) Forecast, by Application 2020 & 2033
- Table 83: Global UV Curable Resin Market Revenue Million Forecast, by Resin Type 2020 & 2033
- Table 84: Global UV Curable Resin Market Volume K Tons Forecast, by Resin Type 2020 & 2033
- Table 85: Global UV Curable Resin Market Revenue Million Forecast, by Composition 2020 & 2033
- Table 86: Global UV Curable Resin Market Volume K Tons Forecast, by Composition 2020 & 2033
- Table 87: Global UV Curable Resin Market Revenue Million Forecast, by Application 2020 & 2033
- Table 88: Global UV Curable Resin Market Volume K Tons Forecast, by Application 2020 & 2033
- Table 89: Global UV Curable Resin Market Revenue Million Forecast, by End-user Industry 2020 & 2033
- Table 90: Global UV Curable Resin Market Volume K Tons Forecast, by End-user Industry 2020 & 2033
- Table 91: Global UV Curable Resin Market Revenue Million Forecast, by Country 2020 & 2033
- Table 92: Global UV Curable Resin Market Volume K Tons Forecast, by Country 2020 & 2033
- Table 93: Saudi Arabia UV Curable Resin Market Revenue (Million) Forecast, by Application 2020 & 2033
- Table 94: Saudi Arabia UV Curable Resin Market Volume (K Tons) Forecast, by Application 2020 & 2033
- Table 95: South Africa UV Curable Resin Market Revenue (Million) Forecast, by Application 2020 & 2033
- Table 96: South Africa UV Curable Resin Market Volume (K Tons) Forecast, by Application 2020 & 2033
- Table 97: Rest of Middle East UV Curable Resin Market Revenue (Million) Forecast, by Application 2020 & 2033
- Table 98: Rest of Middle East UV Curable Resin Market Volume (K Tons) Forecast, by Application 2020 & 2033
Frequently Asked Questions
1. What is the projected Compound Annual Growth Rate (CAGR) of the UV Curable Resin Market?
The projected CAGR is approximately 6.76%.
2. Which companies are prominent players in the UV Curable Resin Market?
Key companies in the market include Jiangsu Litian Technology Co Ltd, TOAGOSEI CO LTD, SOLTECH LTD, Dymax Corporation, Wanhua Chemical Group Co Ltd , BASF SE, Arkema Group, DSM, Resonac Holdings Corporation, Nippon-Gohsei, Allnex, Covestro AG, DIC CORPORATION, Eternal Materials Co Ltd, IGM Resins.
3. What are the main segments of the UV Curable Resin Market?
The market segments include Resin Type, Composition, Application, End-user Industry.
4. Can you provide details about the market size?
The market size is estimated to be USD 5.05 Million as of 2022.
5. What are some drivers contributing to market growth?
Increase in Use of Environment-Friendly Industrial Coatings; Rising Demand for UV Curable Inks in Packaging Application; Other Drivers.
6. What are the notable trends driving market growth?
Increasing Demand from Packaging Industry.
7. Are there any restraints impacting market growth?
High Initial Capital Cost; Other Restraints.
8. Can you provide examples of recent developments in the market?
Recent developments in the market studied will be covered in the final report.
9. What pricing options are available for accessing the report?
Pricing options include single-user, multi-user, and enterprise licenses priced at USD 4750, USD 5250, and USD 8750 respectively.
10. Is the market size provided in terms of value or volume?
The market size is provided in terms of value, measured in Million and volume, measured in K Tons.
11. Are there any specific market keywords associated with the report?
Yes, the market keyword associated with the report is "UV Curable Resin Market," which aids in identifying and referencing the specific market segment covered.
12. How do I determine which pricing option suits my needs best?
The pricing options vary based on user requirements and access needs. Individual users may opt for single-user licenses, while businesses requiring broader access may choose multi-user or enterprise licenses for cost-effective access to the report.
13. Are there any additional resources or data provided in the UV Curable Resin Market report?
While the report offers comprehensive insights, it's advisable to review the specific contents or supplementary materials provided to ascertain if additional resources or data are available.
14. How can I stay updated on further developments or reports in the UV Curable Resin Market?
To stay informed about further developments, trends, and reports in the UV Curable Resin Market, consider subscribing to industry newsletters, following relevant companies and organizations, or regularly checking reputable industry news sources and publications.
Methodology
Step 1 - Identification of Relevant Samples Size from Population Database


Step 2 - Approaches for Defining Global Market Size (Value, Volume* & Price*)

Note*: In applicable scenarios
Step 3 - Data Sources
Primary Research
- Web Analytics
- Survey Reports
- Research Institute
- Latest Research Reports
- Opinion Leaders
Secondary Research
- Annual Reports
- White Paper
- Latest Press Release
- Industry Association
- Paid Database
- Investor Presentations

Step 4 - Data Triangulation
Involves using different sources of information in order to increase the validity of a study
These sources are likely to be stakeholders in a program - participants, other researchers, program staff, other community members, and so on.
Then we put all data in single framework & apply various statistical tools to find out the dynamic on the market.
During the analysis stage, feedback from the stakeholder groups would be compared to determine areas of agreement as well as areas of divergence