

Key Insights
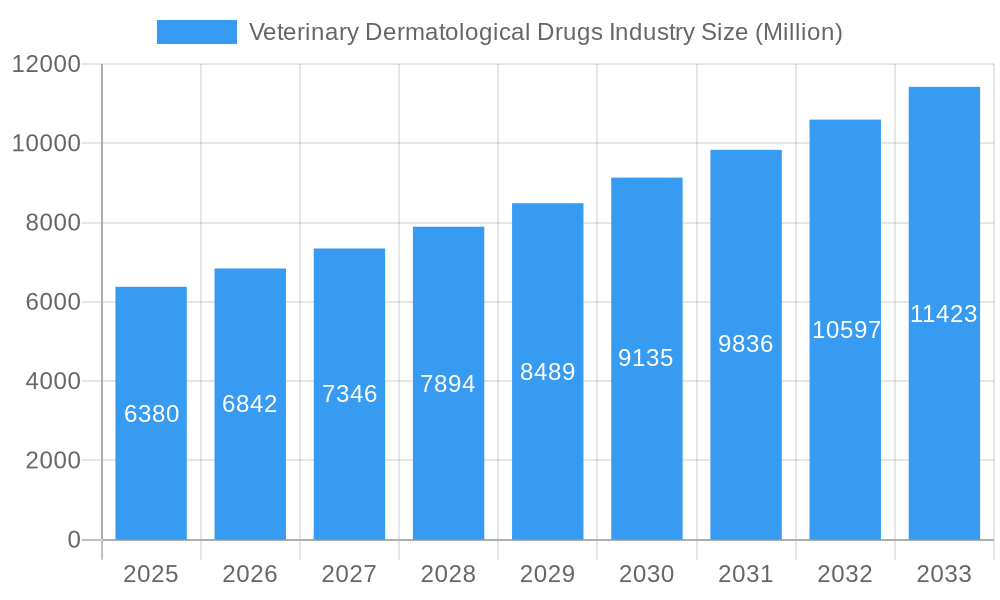
The global veterinary dermatological drugs market, valued at $6.38 billion in 2025, is projected to experience robust growth, driven by increasing pet ownership, rising pet humanization, and a growing awareness of animal health. The market's Compound Annual Growth Rate (CAGR) of 7.11% from 2019 to 2024 indicates a consistently expanding demand for effective treatments for skin conditions in animals. Key market drivers include the escalating prevalence of allergic and parasitic skin infections in companion animals (dogs and cats) and livestock, leading to increased veterinary visits and prescription drug usage. The rising adoption of e-commerce platforms for purchasing veterinary products further fuels market expansion, offering convenience and broader access to specialized treatments. Growth is segmented across various distribution channels (retail, hospital pharmacies, e-commerce), animal types (companion, livestock), and routes of administration (topical, injectable, oral). While the market enjoys strong growth, potential restraints include the high cost of certain advanced therapies and the development of drug resistance in some parasitic infections. The market's geographical distribution sees strong performance in North America and Europe, driven by higher pet ownership rates and established veterinary infrastructure, but the Asia-Pacific region is expected to exhibit significant growth potential due to rising disposable incomes and increasing awareness of animal welfare.
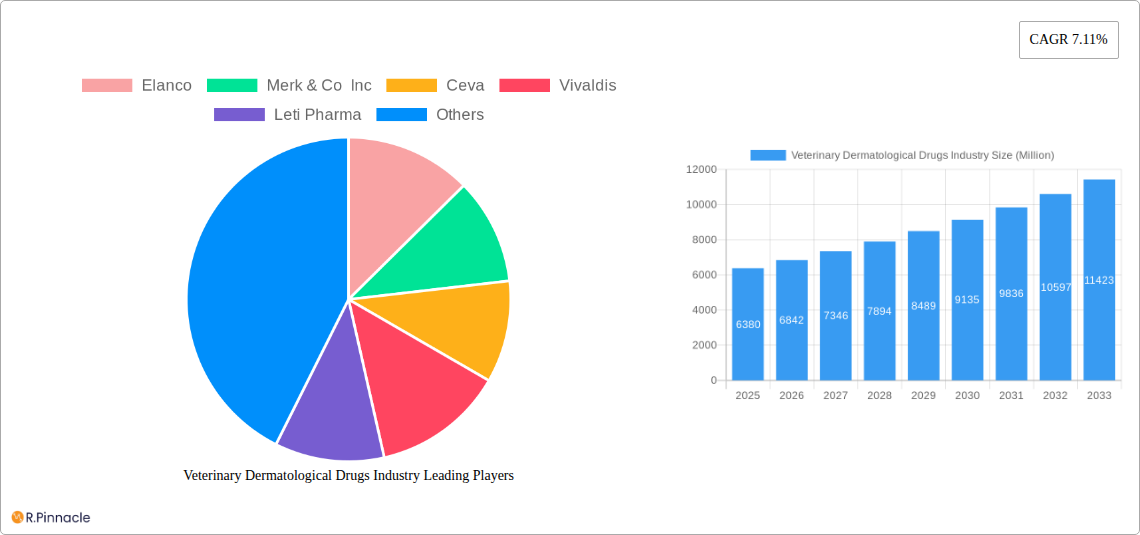
Veterinary Dermatological Drugs Industry Market Size (In Billion)
The competitive landscape includes both multinational pharmaceutical giants such as Zoetis Inc, Elanco, and Merck & Co Inc, and specialized veterinary companies like Ceva and Virbac. These companies are actively engaged in research and development, aiming to introduce innovative, effective, and safer dermatological treatments. The focus on developing targeted therapies, enhancing product efficacy, and improving convenience of administration will be crucial in shaping future market dynamics. The forecast period (2025-2033) anticipates sustained growth, largely driven by ongoing technological advancements in veterinary dermatology and the expansion of veterinary services in emerging markets. Further segmentation by indication (parasitic infections, allergic infections, other) highlights the diverse needs of the market and the opportunities for specialized product development.
Veterinary Dermatological Drugs Industry Company Market Share
Veterinary Dermatological Drugs Market Report: 2019-2033
This comprehensive report provides a detailed analysis of the Veterinary Dermatological Drugs industry, offering invaluable insights for industry professionals, investors, and stakeholders. Covering the period from 2019 to 2033, with a focus on 2025, this report analyzes market trends, competitive dynamics, and future growth potential. The report leverages extensive data and research to provide actionable intelligence for strategic decision-making.
Keywords: Veterinary dermatological drugs, animal health, companion animals, livestock, pharmaceuticals, market analysis, market size, market share, CAGR, Elanco, Zoetis, Merck, Ceva, Virbac, Bioiberica, Topical, Injectable, Oral, Parasitic Infections, Allergic Infections, Retail, Hospital Pharmacies, E-commerce, Market growth, Market trends, Industry analysis
Veterinary Dermatological Drugs Industry Market Structure & Innovation Trends
The veterinary dermatological drugs market is moderately concentrated, with key players like Zoetis, Elanco, Merck & Co Inc., and Ceva holding significant market share. However, smaller companies and new entrants are actively driving innovation, leading to a dynamic market landscape. Market share data for 2024 suggests Zoetis holds approximately xx% market share, followed by Elanco with xx%, Merck with xx%, and Ceva with xx%. The remaining share is distributed amongst other players, including Vivaldis, Leti Pharma, Mars Incorporated, Indian Immunologicals Ltd, Bimeda Inc, Virbac, and Bioiberica S.A.U.
Innovation is fueled by increasing pet ownership, rising awareness of animal health, and the need for more effective and convenient treatment options. Regulatory frameworks, such as FDA approvals in the US and EMA approvals in Europe, significantly influence market access and product development. Substitutes, including alternative therapies and homeopathic remedies, exist but generally hold a smaller market share compared to pharmaceutical treatments. The end-user demographics are increasingly sophisticated, demanding more targeted and personalized solutions. M&A activities, while not as frequent as in some other pharmaceutical sectors, still impact market dynamics. Deal values in recent years averaged approximately $xx Million, primarily focused on strengthening product portfolios or expanding geographical reach.
- Market Concentration: Moderately concentrated
- Innovation Drivers: Increasing pet ownership, rising awareness of animal health, demand for better treatments.
- Regulatory Framework: FDA (US), EMA (Europe) and other regional bodies.
- Product Substitutes: Alternative therapies, homeopathic remedies.
- M&A Activity: Moderate activity with average deal values around $xx Million.
Veterinary Dermatological Drugs Industry Market Dynamics & Trends
The veterinary dermatological drugs market is experiencing robust growth, driven by several factors. Rising pet ownership globally is a primary driver, particularly in developing economies. Increasing pet humanization and expenditure on pet healthcare also contribute significantly. Technological advancements, such as the development of novel drug delivery systems (e.g., targeted therapies, microchips) are disrupting the industry. Consumer preferences are shifting towards more convenient, safer, and effective treatments with fewer side effects.
The competitive landscape is intensely competitive, with established players constantly innovating and smaller companies entering with niche products. This leads to a dynamic price environment and a continuous pressure on margins. The market exhibits a significant growth opportunity through the adoption of e-commerce platforms for purchasing veterinary medications. Increasing awareness of allergic dermatitis and parasitic infections in animals are fueling market demand for related treatments. The CAGR for the market from 2025-2033 is projected to be approximately xx%, driven primarily by companion animal segment growth. Market penetration varies by region and product category, with topical treatments holding a larger market share compared to injectable or oral formulations.
Dominant Regions & Segments in Veterinary Dermatological Drugs Industry
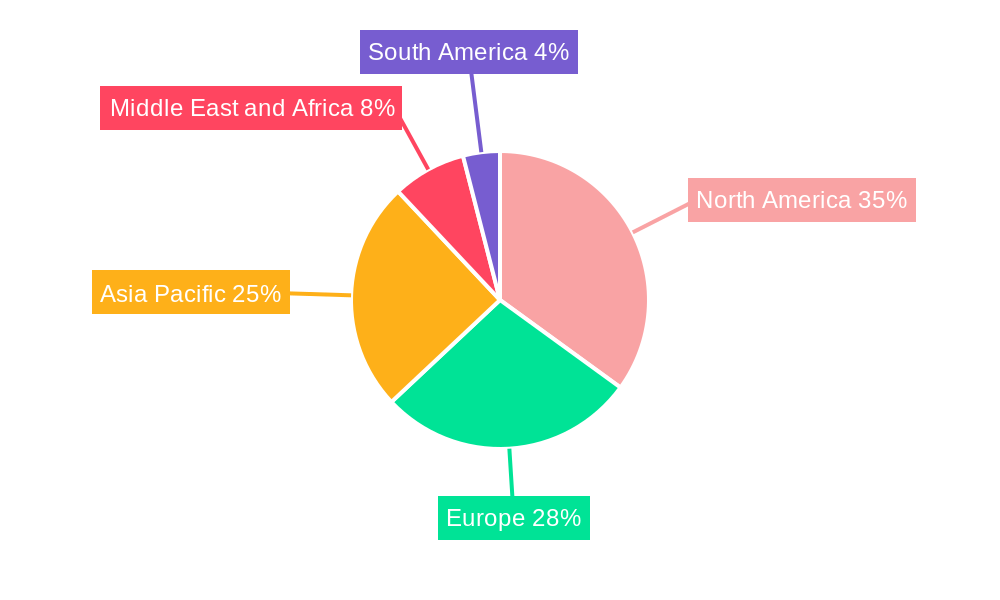
North America currently dominates the veterinary dermatological drugs market, followed by Europe. This dominance is attributed to factors such as high pet ownership rates, higher disposable incomes, advanced healthcare infrastructure, and greater awareness of animal health issues. Asia-Pacific is a rapidly growing region, showing high potential for future growth.
- Leading Region: North America
- Key Drivers (North America): High pet ownership, high disposable incomes, advanced veterinary care infrastructure.
- Key Drivers (Europe): Increasing pet humanization, stringent animal welfare regulations.
- Key Drivers (Asia-Pacific): Rising pet ownership, increasing veterinary care awareness.
Dominant Segments:
- Animal: Companion animals (dogs and cats) constitute the largest segment, driven by high pet ownership and spending on pet healthcare. Livestock animals represent a smaller but growing segment, particularly in regions with intensive farming practices.
- Route of Administration: Topical applications are currently the most prevalent route, followed by oral and injectable medications. However, innovation in drug delivery systems is expected to expand the market for injectable and implantable formulations.
- Distribution Channel: Retail pharmacies and veterinary hospitals constitute the major distribution channels, with e-commerce showing significant growth potential.
- Indication: Parasitic infections and allergic infections are the dominant indications, while the "other indications" segment includes diverse dermatological conditions.
Veterinary Dermatological Drugs Industry Product Innovations
Recent innovations include the development of novel drug delivery systems that improve efficacy and reduce side effects, as well as the introduction of more targeted therapies for specific dermatological conditions. For example, the FDA approval of Zoetis' Apoquel® Chewable in June 2023 exemplifies the focus on convenient and effective oral treatments for allergic dermatitis. Bioiberica's launch of the Atopivet Collar in April 2023 highlights the ongoing innovation in topical treatments. This ongoing innovation ensures the market remains dynamic and responsive to evolving animal health needs.
Report Scope & Segmentation Analysis
This report comprehensively segments the veterinary dermatological drugs market based on animal type (companion animals, livestock), route of administration (topical, injectable, oral), distribution channel (retail, hospital pharmacies, e-commerce), and indication (parasitic infections, allergic infections, other indications). Each segment is analyzed in detail, considering market size, growth projections, and competitive dynamics. The report provides detailed forecasts for each segment from 2025 to 2033. The companion animal segment is anticipated to experience the highest CAGR during the forecast period, primarily driven by the dog and cat segments.
Key Drivers of Veterinary Dermatological Drugs Industry Growth
The market is driven by several key factors, including rising pet ownership globally, increasing disposable incomes, heightened pet humanization, technological advancements in drug delivery systems, and growing awareness of animal health issues, particularly related to dermatological conditions. Government regulations promoting animal welfare and the increasing availability of veterinary services also play a significant role.
Challenges in the Veterinary Dermatological Drugs Industry Sector
The industry faces several challenges including stringent regulatory approvals, potential supply chain disruptions, intense competition among established players and new entrants, pricing pressures, and the need for continuous innovation to stay ahead of evolving consumer preferences and new scientific findings. The high cost of R&D and regulatory compliance is also a significant hurdle for smaller companies.
Emerging Opportunities in Veterinary Dermatological Drugs Industry
Significant opportunities exist in emerging economies with growing pet ownership, personalized medicine advancements, development of novel drug delivery systems (e.g., transdermal patches, microneedle arrays), expanding e-commerce penetration in veterinary supplies, and growth in specialized veterinary dermatology clinics.
Leading Players in the Veterinary Dermatological Drugs Industry Market
- Elanco
- Merck & Co Inc
- Ceva
- Vivaldis
- Leti Pharma
- Mars Incorporated
- Indian Immunologicals Ltd
- Bimeda Inc
- Virbac
- Bioiberica S A U
- Zoetis Inc
Key Developments in Veterinary Dermatological Drugs Industry Industry
- June 2023: Zoetis announced FDA approval of Apoquel® Chewable (oclacitinib chewable tablet) for the control of pruritus associated with allergic dermatitis and the control of atopic dermatitis in dogs. This significantly expands market access for a key treatment option.
- April 2023: Bioiberica launched the Atopivet Collar, a novel topical treatment for atopic dermatitis, offering an alternative to oral and traditional topical therapies. This demonstrates innovation in treatment delivery systems.
Future Outlook for Veterinary Dermatological Drugs Industry Market
The future outlook for the veterinary dermatological drugs market is positive, with continued growth driven by factors discussed above. Strategic opportunities exist for companies focusing on innovation, personalized medicine, expansion into emerging markets, and the development of convenient and effective treatment options. The market is poised for significant expansion in the next decade, with the potential for substantial market value growth.
Veterinary Dermatological Drugs Industry Segmentation
-
1. Animal
- 1.1. Companion Animal
- 1.2. Livestock Animal
-
2. Route Of Administration
- 2.1. Topical
- 2.2. Injectable
- 2.3. Oral
-
3. Indication
- 3.1. Parasitic Infections
- 3.2. Allergic Infections
- 3.3. Other Indications
-
4. Distribution Channel
- 4.1. Retail
- 4.2. Hospital Pharmacies
- 4.3. E-commerce
Veterinary Dermatological Drugs Industry Segmentation By Geography
-
1. North America
- 1.1. United States
- 1.2. Canada
- 1.3. Mexico
-
2. Europe
- 2.1. United Kingdom
- 2.2. France
- 2.3. Germany
- 2.4. Italy
- 2.5. Spain
- 2.6. Rest of Europe
-
3. Asia Pacific
- 3.1. India
- 3.2. China
- 3.3. Japan
- 3.4. Australia
- 3.5. South Korea
- 3.6. Rest of Asia Pacific
-
4. Middle East and Africa
- 4.1. GCC
- 4.2. South Africa
- 4.3. Rest of Middle East and Africa
-
5. South America
- 5.1. Brazil
- 5.2. Argentina
- 5.3. Rest of South America
Veterinary Dermatological Drugs Industry Regional Market Share
Geographic Coverage of Veterinary Dermatological Drugs Industry
Veterinary Dermatological Drugs Industry REPORT HIGHLIGHTS
| Aspects | Details |
|---|---|
| Study Period | 2020-2034 |
| Base Year | 2025 |
| Estimated Year | 2026 |
| Forecast Period | 2026-2034 |
| Historical Period | 2020-2025 |
| Growth Rate | CAGR of 7.11% from 2020-2034 |
| Segmentation |
|
Table of Contents
- 1. Introduction
- 1.1. Research Scope
- 1.2. Market Segmentation
- 1.3. Research Objective
- 1.4. Definitions and Assumptions
- 2. Executive Summary
- 2.1. Market Snapshot
- 3. Market Dynamics
- 3.1. Market Drivers
- 3.2. Market Restrains
- 3.3. Market Trends
- 3.4. Market Opportunities
- 4. Market Factor Analysis
- 4.1. Porters Five Forces
- 4.1.1. Bargaining Power of Suppliers
- 4.1.2. Bargaining Power of Buyers
- 4.1.3. Threat of New Entrants
- 4.1.4. Threat of Substitutes
- 4.1.5. Competitive Rivalry
- 4.2. PESTEL analysis
- 4.3. BCG Analysis
- 4.3.1. Stars (High Growth, High Market Share)
- 4.3.2. Cash Cows (Low Growth, High Market Share)
- 4.3.3. Question Mark (High Growth, Low Market Share)
- 4.3.4. Dogs (Low Growth, Low Market Share)
- 4.4. Ansoff Matrix Analysis
- 4.5. Supply Chain Analysis
- 4.6. Regulatory Landscape
- 4.7. Current Market Potential and Opportunity Assessment (TAM–SAM–SOM Framework)
- 4.8. PRI Analyst Note
- 4.1. Porters Five Forces
- 5. Market Analysis, Insights and Forecast 2021-2033
- 5.1. Market Analysis, Insights and Forecast - by Animal
- 5.1.1. Companion Animal
- 5.1.2. Livestock Animal
- 5.2. Market Analysis, Insights and Forecast - by Route Of Administration
- 5.2.1. Topical
- 5.2.2. Injectable
- 5.2.3. Oral
- 5.3. Market Analysis, Insights and Forecast - by Indication
- 5.3.1. Parasitic Infections
- 5.3.2. Allergic Infections
- 5.3.3. Other Indications
- 5.4. Market Analysis, Insights and Forecast - by Distribution Channel
- 5.4.1. Retail
- 5.4.2. Hospital Pharmacies
- 5.4.3. E-commerce
- 5.5. Market Analysis, Insights and Forecast - by Region
- 5.5.1. North America
- 5.5.2. Europe
- 5.5.3. Asia Pacific
- 5.5.4. Middle East and Africa
- 5.5.5. South America
- 5.1. Market Analysis, Insights and Forecast - by Animal
- 6. Global Veterinary Dermatological Drugs Industry Analysis, Insights and Forecast, 2021-2033
- 6.1. Market Analysis, Insights and Forecast - by Animal
- 6.1.1. Companion Animal
- 6.1.2. Livestock Animal
- 6.2. Market Analysis, Insights and Forecast - by Route Of Administration
- 6.2.1. Topical
- 6.2.2. Injectable
- 6.2.3. Oral
- 6.3. Market Analysis, Insights and Forecast - by Indication
- 6.3.1. Parasitic Infections
- 6.3.2. Allergic Infections
- 6.3.3. Other Indications
- 6.4. Market Analysis, Insights and Forecast - by Distribution Channel
- 6.4.1. Retail
- 6.4.2. Hospital Pharmacies
- 6.4.3. E-commerce
- 6.1. Market Analysis, Insights and Forecast - by Animal
- 7. North America Veterinary Dermatological Drugs Industry Analysis, Insights and Forecast, 2020-2032
- 7.1. Market Analysis, Insights and Forecast - by Animal
- 7.1.1. Companion Animal
- 7.1.2. Livestock Animal
- 7.2. Market Analysis, Insights and Forecast - by Route Of Administration
- 7.2.1. Topical
- 7.2.2. Injectable
- 7.2.3. Oral
- 7.3. Market Analysis, Insights and Forecast - by Indication
- 7.3.1. Parasitic Infections
- 7.3.2. Allergic Infections
- 7.3.3. Other Indications
- 7.4. Market Analysis, Insights and Forecast - by Distribution Channel
- 7.4.1. Retail
- 7.4.2. Hospital Pharmacies
- 7.4.3. E-commerce
- 7.1. Market Analysis, Insights and Forecast - by Animal
- 8. Europe Veterinary Dermatological Drugs Industry Analysis, Insights and Forecast, 2020-2032
- 8.1. Market Analysis, Insights and Forecast - by Animal
- 8.1.1. Companion Animal
- 8.1.2. Livestock Animal
- 8.2. Market Analysis, Insights and Forecast - by Route Of Administration
- 8.2.1. Topical
- 8.2.2. Injectable
- 8.2.3. Oral
- 8.3. Market Analysis, Insights and Forecast - by Indication
- 8.3.1. Parasitic Infections
- 8.3.2. Allergic Infections
- 8.3.3. Other Indications
- 8.4. Market Analysis, Insights and Forecast - by Distribution Channel
- 8.4.1. Retail
- 8.4.2. Hospital Pharmacies
- 8.4.3. E-commerce
- 8.1. Market Analysis, Insights and Forecast - by Animal
- 9. Asia Pacific Veterinary Dermatological Drugs Industry Analysis, Insights and Forecast, 2020-2032
- 9.1. Market Analysis, Insights and Forecast - by Animal
- 9.1.1. Companion Animal
- 9.1.2. Livestock Animal
- 9.2. Market Analysis, Insights and Forecast - by Route Of Administration
- 9.2.1. Topical
- 9.2.2. Injectable
- 9.2.3. Oral
- 9.3. Market Analysis, Insights and Forecast - by Indication
- 9.3.1. Parasitic Infections
- 9.3.2. Allergic Infections
- 9.3.3. Other Indications
- 9.4. Market Analysis, Insights and Forecast - by Distribution Channel
- 9.4.1. Retail
- 9.4.2. Hospital Pharmacies
- 9.4.3. E-commerce
- 9.1. Market Analysis, Insights and Forecast - by Animal
- 10. Middle East and Africa Veterinary Dermatological Drugs Industry Analysis, Insights and Forecast, 2020-2032
- 10.1. Market Analysis, Insights and Forecast - by Animal
- 10.1.1. Companion Animal
- 10.1.2. Livestock Animal
- 10.2. Market Analysis, Insights and Forecast - by Route Of Administration
- 10.2.1. Topical
- 10.2.2. Injectable
- 10.2.3. Oral
- 10.3. Market Analysis, Insights and Forecast - by Indication
- 10.3.1. Parasitic Infections
- 10.3.2. Allergic Infections
- 10.3.3. Other Indications
- 10.4. Market Analysis, Insights and Forecast - by Distribution Channel
- 10.4.1. Retail
- 10.4.2. Hospital Pharmacies
- 10.4.3. E-commerce
- 10.1. Market Analysis, Insights and Forecast - by Animal
- 11. South America Veterinary Dermatological Drugs Industry Analysis, Insights and Forecast, 2020-2032
- 11.1. Market Analysis, Insights and Forecast - by Animal
- 11.1.1. Companion Animal
- 11.1.2. Livestock Animal
- 11.2. Market Analysis, Insights and Forecast - by Route Of Administration
- 11.2.1. Topical
- 11.2.2. Injectable
- 11.2.3. Oral
- 11.3. Market Analysis, Insights and Forecast - by Indication
- 11.3.1. Parasitic Infections
- 11.3.2. Allergic Infections
- 11.3.3. Other Indications
- 11.4. Market Analysis, Insights and Forecast - by Distribution Channel
- 11.4.1. Retail
- 11.4.2. Hospital Pharmacies
- 11.4.3. E-commerce
- 11.1. Market Analysis, Insights and Forecast - by Animal
- 12. Competitive Analysis
- 12.1. Company Profiles
- 12.1.1 Elanco
- 12.1.1.1. Company Overview
- 12.1.1.2. Products
- 12.1.1.3. Company Financials
- 12.1.1.4. SWOT Analysis
- 12.1.2 Merk & Co Inc
- 12.1.2.1. Company Overview
- 12.1.2.2. Products
- 12.1.2.3. Company Financials
- 12.1.2.4. SWOT Analysis
- 12.1.3 Ceva
- 12.1.3.1. Company Overview
- 12.1.3.2. Products
- 12.1.3.3. Company Financials
- 12.1.3.4. SWOT Analysis
- 12.1.4 Vivaldis
- 12.1.4.1. Company Overview
- 12.1.4.2. Products
- 12.1.4.3. Company Financials
- 12.1.4.4. SWOT Analysis
- 12.1.5 Leti Pharma
- 12.1.5.1. Company Overview
- 12.1.5.2. Products
- 12.1.5.3. Company Financials
- 12.1.5.4. SWOT Analysis
- 12.1.6 Mars Incorporated
- 12.1.6.1. Company Overview
- 12.1.6.2. Products
- 12.1.6.3. Company Financials
- 12.1.6.4. SWOT Analysis
- 12.1.7 Indian Immunologicals Ltd
- 12.1.7.1. Company Overview
- 12.1.7.2. Products
- 12.1.7.3. Company Financials
- 12.1.7.4. SWOT Analysis
- 12.1.8 Bimeda Inc
- 12.1.8.1. Company Overview
- 12.1.8.2. Products
- 12.1.8.3. Company Financials
- 12.1.8.4. SWOT Analysis
- 12.1.9 Virbac
- 12.1.9.1. Company Overview
- 12.1.9.2. Products
- 12.1.9.3. Company Financials
- 12.1.9.4. SWOT Analysis
- 12.1.10 Bioiberica S A U
- 12.1.10.1. Company Overview
- 12.1.10.2. Products
- 12.1.10.3. Company Financials
- 12.1.10.4. SWOT Analysis
- 12.1.11 Zoetis Inc
- 12.1.11.1. Company Overview
- 12.1.11.2. Products
- 12.1.11.3. Company Financials
- 12.1.11.4. SWOT Analysis
- 12.1.1 Elanco
- 12.2. Market Entropy
- 12.2.1 Company's Key Areas Served
- 12.2.2 Recent Developments
- 12.3. Company Market Share Analysis 2025
- 12.3.1 Top 5 Companies Market Share Analysis
- 12.3.2 Top 3 Companies Market Share Analysis
- 12.4. List of Potential Customers
- 13. Research Methodology
List of Figures
- Figure 1: Global Veterinary Dermatological Drugs Industry Revenue Breakdown (Million, %) by Region 2025 & 2033
- Figure 2: Global Veterinary Dermatological Drugs Industry Volume Breakdown (Dosage, %) by Region 2025 & 2033
- Figure 3: North America Veterinary Dermatological Drugs Industry Revenue (Million), by Animal 2025 & 2033
- Figure 4: North America Veterinary Dermatological Drugs Industry Volume (Dosage), by Animal 2025 & 2033
- Figure 5: North America Veterinary Dermatological Drugs Industry Revenue Share (%), by Animal 2025 & 2033
- Figure 6: North America Veterinary Dermatological Drugs Industry Volume Share (%), by Animal 2025 & 2033
- Figure 7: North America Veterinary Dermatological Drugs Industry Revenue (Million), by Route Of Administration 2025 & 2033
- Figure 8: North America Veterinary Dermatological Drugs Industry Volume (Dosage), by Route Of Administration 2025 & 2033
- Figure 9: North America Veterinary Dermatological Drugs Industry Revenue Share (%), by Route Of Administration 2025 & 2033
- Figure 10: North America Veterinary Dermatological Drugs Industry Volume Share (%), by Route Of Administration 2025 & 2033
- Figure 11: North America Veterinary Dermatological Drugs Industry Revenue (Million), by Indication 2025 & 2033
- Figure 12: North America Veterinary Dermatological Drugs Industry Volume (Dosage), by Indication 2025 & 2033
- Figure 13: North America Veterinary Dermatological Drugs Industry Revenue Share (%), by Indication 2025 & 2033
- Figure 14: North America Veterinary Dermatological Drugs Industry Volume Share (%), by Indication 2025 & 2033
- Figure 15: North America Veterinary Dermatological Drugs Industry Revenue (Million), by Distribution Channel 2025 & 2033
- Figure 16: North America Veterinary Dermatological Drugs Industry Volume (Dosage), by Distribution Channel 2025 & 2033
- Figure 17: North America Veterinary Dermatological Drugs Industry Revenue Share (%), by Distribution Channel 2025 & 2033
- Figure 18: North America Veterinary Dermatological Drugs Industry Volume Share (%), by Distribution Channel 2025 & 2033
- Figure 19: North America Veterinary Dermatological Drugs Industry Revenue (Million), by Country 2025 & 2033
- Figure 20: North America Veterinary Dermatological Drugs Industry Volume (Dosage), by Country 2025 & 2033
- Figure 21: North America Veterinary Dermatological Drugs Industry Revenue Share (%), by Country 2025 & 2033
- Figure 22: North America Veterinary Dermatological Drugs Industry Volume Share (%), by Country 2025 & 2033
- Figure 23: Europe Veterinary Dermatological Drugs Industry Revenue (Million), by Animal 2025 & 2033
- Figure 24: Europe Veterinary Dermatological Drugs Industry Volume (Dosage), by Animal 2025 & 2033
- Figure 25: Europe Veterinary Dermatological Drugs Industry Revenue Share (%), by Animal 2025 & 2033
- Figure 26: Europe Veterinary Dermatological Drugs Industry Volume Share (%), by Animal 2025 & 2033
- Figure 27: Europe Veterinary Dermatological Drugs Industry Revenue (Million), by Route Of Administration 2025 & 2033
- Figure 28: Europe Veterinary Dermatological Drugs Industry Volume (Dosage), by Route Of Administration 2025 & 2033
- Figure 29: Europe Veterinary Dermatological Drugs Industry Revenue Share (%), by Route Of Administration 2025 & 2033
- Figure 30: Europe Veterinary Dermatological Drugs Industry Volume Share (%), by Route Of Administration 2025 & 2033
- Figure 31: Europe Veterinary Dermatological Drugs Industry Revenue (Million), by Indication 2025 & 2033
- Figure 32: Europe Veterinary Dermatological Drugs Industry Volume (Dosage), by Indication 2025 & 2033
- Figure 33: Europe Veterinary Dermatological Drugs Industry Revenue Share (%), by Indication 2025 & 2033
- Figure 34: Europe Veterinary Dermatological Drugs Industry Volume Share (%), by Indication 2025 & 2033
- Figure 35: Europe Veterinary Dermatological Drugs Industry Revenue (Million), by Distribution Channel 2025 & 2033
- Figure 36: Europe Veterinary Dermatological Drugs Industry Volume (Dosage), by Distribution Channel 2025 & 2033
- Figure 37: Europe Veterinary Dermatological Drugs Industry Revenue Share (%), by Distribution Channel 2025 & 2033
- Figure 38: Europe Veterinary Dermatological Drugs Industry Volume Share (%), by Distribution Channel 2025 & 2033
- Figure 39: Europe Veterinary Dermatological Drugs Industry Revenue (Million), by Country 2025 & 2033
- Figure 40: Europe Veterinary Dermatological Drugs Industry Volume (Dosage), by Country 2025 & 2033
- Figure 41: Europe Veterinary Dermatological Drugs Industry Revenue Share (%), by Country 2025 & 2033
- Figure 42: Europe Veterinary Dermatological Drugs Industry Volume Share (%), by Country 2025 & 2033
- Figure 43: Asia Pacific Veterinary Dermatological Drugs Industry Revenue (Million), by Animal 2025 & 2033
- Figure 44: Asia Pacific Veterinary Dermatological Drugs Industry Volume (Dosage), by Animal 2025 & 2033
- Figure 45: Asia Pacific Veterinary Dermatological Drugs Industry Revenue Share (%), by Animal 2025 & 2033
- Figure 46: Asia Pacific Veterinary Dermatological Drugs Industry Volume Share (%), by Animal 2025 & 2033
- Figure 47: Asia Pacific Veterinary Dermatological Drugs Industry Revenue (Million), by Route Of Administration 2025 & 2033
- Figure 48: Asia Pacific Veterinary Dermatological Drugs Industry Volume (Dosage), by Route Of Administration 2025 & 2033
- Figure 49: Asia Pacific Veterinary Dermatological Drugs Industry Revenue Share (%), by Route Of Administration 2025 & 2033
- Figure 50: Asia Pacific Veterinary Dermatological Drugs Industry Volume Share (%), by Route Of Administration 2025 & 2033
- Figure 51: Asia Pacific Veterinary Dermatological Drugs Industry Revenue (Million), by Indication 2025 & 2033
- Figure 52: Asia Pacific Veterinary Dermatological Drugs Industry Volume (Dosage), by Indication 2025 & 2033
- Figure 53: Asia Pacific Veterinary Dermatological Drugs Industry Revenue Share (%), by Indication 2025 & 2033
- Figure 54: Asia Pacific Veterinary Dermatological Drugs Industry Volume Share (%), by Indication 2025 & 2033
- Figure 55: Asia Pacific Veterinary Dermatological Drugs Industry Revenue (Million), by Distribution Channel 2025 & 2033
- Figure 56: Asia Pacific Veterinary Dermatological Drugs Industry Volume (Dosage), by Distribution Channel 2025 & 2033
- Figure 57: Asia Pacific Veterinary Dermatological Drugs Industry Revenue Share (%), by Distribution Channel 2025 & 2033
- Figure 58: Asia Pacific Veterinary Dermatological Drugs Industry Volume Share (%), by Distribution Channel 2025 & 2033
- Figure 59: Asia Pacific Veterinary Dermatological Drugs Industry Revenue (Million), by Country 2025 & 2033
- Figure 60: Asia Pacific Veterinary Dermatological Drugs Industry Volume (Dosage), by Country 2025 & 2033
- Figure 61: Asia Pacific Veterinary Dermatological Drugs Industry Revenue Share (%), by Country 2025 & 2033
- Figure 62: Asia Pacific Veterinary Dermatological Drugs Industry Volume Share (%), by Country 2025 & 2033
- Figure 63: Middle East and Africa Veterinary Dermatological Drugs Industry Revenue (Million), by Animal 2025 & 2033
- Figure 64: Middle East and Africa Veterinary Dermatological Drugs Industry Volume (Dosage), by Animal 2025 & 2033
- Figure 65: Middle East and Africa Veterinary Dermatological Drugs Industry Revenue Share (%), by Animal 2025 & 2033
- Figure 66: Middle East and Africa Veterinary Dermatological Drugs Industry Volume Share (%), by Animal 2025 & 2033
- Figure 67: Middle East and Africa Veterinary Dermatological Drugs Industry Revenue (Million), by Route Of Administration 2025 & 2033
- Figure 68: Middle East and Africa Veterinary Dermatological Drugs Industry Volume (Dosage), by Route Of Administration 2025 & 2033
- Figure 69: Middle East and Africa Veterinary Dermatological Drugs Industry Revenue Share (%), by Route Of Administration 2025 & 2033
- Figure 70: Middle East and Africa Veterinary Dermatological Drugs Industry Volume Share (%), by Route Of Administration 2025 & 2033
- Figure 71: Middle East and Africa Veterinary Dermatological Drugs Industry Revenue (Million), by Indication 2025 & 2033
- Figure 72: Middle East and Africa Veterinary Dermatological Drugs Industry Volume (Dosage), by Indication 2025 & 2033
- Figure 73: Middle East and Africa Veterinary Dermatological Drugs Industry Revenue Share (%), by Indication 2025 & 2033
- Figure 74: Middle East and Africa Veterinary Dermatological Drugs Industry Volume Share (%), by Indication 2025 & 2033
- Figure 75: Middle East and Africa Veterinary Dermatological Drugs Industry Revenue (Million), by Distribution Channel 2025 & 2033
- Figure 76: Middle East and Africa Veterinary Dermatological Drugs Industry Volume (Dosage), by Distribution Channel 2025 & 2033
- Figure 77: Middle East and Africa Veterinary Dermatological Drugs Industry Revenue Share (%), by Distribution Channel 2025 & 2033
- Figure 78: Middle East and Africa Veterinary Dermatological Drugs Industry Volume Share (%), by Distribution Channel 2025 & 2033
- Figure 79: Middle East and Africa Veterinary Dermatological Drugs Industry Revenue (Million), by Country 2025 & 2033
- Figure 80: Middle East and Africa Veterinary Dermatological Drugs Industry Volume (Dosage), by Country 2025 & 2033
- Figure 81: Middle East and Africa Veterinary Dermatological Drugs Industry Revenue Share (%), by Country 2025 & 2033
- Figure 82: Middle East and Africa Veterinary Dermatological Drugs Industry Volume Share (%), by Country 2025 & 2033
- Figure 83: South America Veterinary Dermatological Drugs Industry Revenue (Million), by Animal 2025 & 2033
- Figure 84: South America Veterinary Dermatological Drugs Industry Volume (Dosage), by Animal 2025 & 2033
- Figure 85: South America Veterinary Dermatological Drugs Industry Revenue Share (%), by Animal 2025 & 2033
- Figure 86: South America Veterinary Dermatological Drugs Industry Volume Share (%), by Animal 2025 & 2033
- Figure 87: South America Veterinary Dermatological Drugs Industry Revenue (Million), by Route Of Administration 2025 & 2033
- Figure 88: South America Veterinary Dermatological Drugs Industry Volume (Dosage), by Route Of Administration 2025 & 2033
- Figure 89: South America Veterinary Dermatological Drugs Industry Revenue Share (%), by Route Of Administration 2025 & 2033
- Figure 90: South America Veterinary Dermatological Drugs Industry Volume Share (%), by Route Of Administration 2025 & 2033
- Figure 91: South America Veterinary Dermatological Drugs Industry Revenue (Million), by Indication 2025 & 2033
- Figure 92: South America Veterinary Dermatological Drugs Industry Volume (Dosage), by Indication 2025 & 2033
- Figure 93: South America Veterinary Dermatological Drugs Industry Revenue Share (%), by Indication 2025 & 2033
- Figure 94: South America Veterinary Dermatological Drugs Industry Volume Share (%), by Indication 2025 & 2033
- Figure 95: South America Veterinary Dermatological Drugs Industry Revenue (Million), by Distribution Channel 2025 & 2033
- Figure 96: South America Veterinary Dermatological Drugs Industry Volume (Dosage), by Distribution Channel 2025 & 2033
- Figure 97: South America Veterinary Dermatological Drugs Industry Revenue Share (%), by Distribution Channel 2025 & 2033
- Figure 98: South America Veterinary Dermatological Drugs Industry Volume Share (%), by Distribution Channel 2025 & 2033
- Figure 99: South America Veterinary Dermatological Drugs Industry Revenue (Million), by Country 2025 & 2033
- Figure 100: South America Veterinary Dermatological Drugs Industry Volume (Dosage), by Country 2025 & 2033
- Figure 101: South America Veterinary Dermatological Drugs Industry Revenue Share (%), by Country 2025 & 2033
- Figure 102: South America Veterinary Dermatological Drugs Industry Volume Share (%), by Country 2025 & 2033
List of Tables
- Table 1: Global Veterinary Dermatological Drugs Industry Revenue Million Forecast, by Animal 2020 & 2033
- Table 2: Global Veterinary Dermatological Drugs Industry Volume Dosage Forecast, by Animal 2020 & 2033
- Table 3: Global Veterinary Dermatological Drugs Industry Revenue Million Forecast, by Route Of Administration 2020 & 2033
- Table 4: Global Veterinary Dermatological Drugs Industry Volume Dosage Forecast, by Route Of Administration 2020 & 2033
- Table 5: Global Veterinary Dermatological Drugs Industry Revenue Million Forecast, by Indication 2020 & 2033
- Table 6: Global Veterinary Dermatological Drugs Industry Volume Dosage Forecast, by Indication 2020 & 2033
- Table 7: Global Veterinary Dermatological Drugs Industry Revenue Million Forecast, by Distribution Channel 2020 & 2033
- Table 8: Global Veterinary Dermatological Drugs Industry Volume Dosage Forecast, by Distribution Channel 2020 & 2033
- Table 9: Global Veterinary Dermatological Drugs Industry Revenue Million Forecast, by Region 2020 & 2033
- Table 10: Global Veterinary Dermatological Drugs Industry Volume Dosage Forecast, by Region 2020 & 2033
- Table 11: Global Veterinary Dermatological Drugs Industry Revenue Million Forecast, by Animal 2020 & 2033
- Table 12: Global Veterinary Dermatological Drugs Industry Volume Dosage Forecast, by Animal 2020 & 2033
- Table 13: Global Veterinary Dermatological Drugs Industry Revenue Million Forecast, by Route Of Administration 2020 & 2033
- Table 14: Global Veterinary Dermatological Drugs Industry Volume Dosage Forecast, by Route Of Administration 2020 & 2033
- Table 15: Global Veterinary Dermatological Drugs Industry Revenue Million Forecast, by Indication 2020 & 2033
- Table 16: Global Veterinary Dermatological Drugs Industry Volume Dosage Forecast, by Indication 2020 & 2033
- Table 17: Global Veterinary Dermatological Drugs Industry Revenue Million Forecast, by Distribution Channel 2020 & 2033
- Table 18: Global Veterinary Dermatological Drugs Industry Volume Dosage Forecast, by Distribution Channel 2020 & 2033
- Table 19: Global Veterinary Dermatological Drugs Industry Revenue Million Forecast, by Country 2020 & 2033
- Table 20: Global Veterinary Dermatological Drugs Industry Volume Dosage Forecast, by Country 2020 & 2033
- Table 21: United States Veterinary Dermatological Drugs Industry Revenue (Million) Forecast, by Application 2020 & 2033
- Table 22: United States Veterinary Dermatological Drugs Industry Volume (Dosage) Forecast, by Application 2020 & 2033
- Table 23: Canada Veterinary Dermatological Drugs Industry Revenue (Million) Forecast, by Application 2020 & 2033
- Table 24: Canada Veterinary Dermatological Drugs Industry Volume (Dosage) Forecast, by Application 2020 & 2033
- Table 25: Mexico Veterinary Dermatological Drugs Industry Revenue (Million) Forecast, by Application 2020 & 2033
- Table 26: Mexico Veterinary Dermatological Drugs Industry Volume (Dosage) Forecast, by Application 2020 & 2033
- Table 27: Global Veterinary Dermatological Drugs Industry Revenue Million Forecast, by Animal 2020 & 2033
- Table 28: Global Veterinary Dermatological Drugs Industry Volume Dosage Forecast, by Animal 2020 & 2033
- Table 29: Global Veterinary Dermatological Drugs Industry Revenue Million Forecast, by Route Of Administration 2020 & 2033
- Table 30: Global Veterinary Dermatological Drugs Industry Volume Dosage Forecast, by Route Of Administration 2020 & 2033
- Table 31: Global Veterinary Dermatological Drugs Industry Revenue Million Forecast, by Indication 2020 & 2033
- Table 32: Global Veterinary Dermatological Drugs Industry Volume Dosage Forecast, by Indication 2020 & 2033
- Table 33: Global Veterinary Dermatological Drugs Industry Revenue Million Forecast, by Distribution Channel 2020 & 2033
- Table 34: Global Veterinary Dermatological Drugs Industry Volume Dosage Forecast, by Distribution Channel 2020 & 2033
- Table 35: Global Veterinary Dermatological Drugs Industry Revenue Million Forecast, by Country 2020 & 2033
- Table 36: Global Veterinary Dermatological Drugs Industry Volume Dosage Forecast, by Country 2020 & 2033
- Table 37: United Kingdom Veterinary Dermatological Drugs Industry Revenue (Million) Forecast, by Application 2020 & 2033
- Table 38: United Kingdom Veterinary Dermatological Drugs Industry Volume (Dosage) Forecast, by Application 2020 & 2033
- Table 39: France Veterinary Dermatological Drugs Industry Revenue (Million) Forecast, by Application 2020 & 2033
- Table 40: France Veterinary Dermatological Drugs Industry Volume (Dosage) Forecast, by Application 2020 & 2033
- Table 41: Germany Veterinary Dermatological Drugs Industry Revenue (Million) Forecast, by Application 2020 & 2033
- Table 42: Germany Veterinary Dermatological Drugs Industry Volume (Dosage) Forecast, by Application 2020 & 2033
- Table 43: Italy Veterinary Dermatological Drugs Industry Revenue (Million) Forecast, by Application 2020 & 2033
- Table 44: Italy Veterinary Dermatological Drugs Industry Volume (Dosage) Forecast, by Application 2020 & 2033
- Table 45: Spain Veterinary Dermatological Drugs Industry Revenue (Million) Forecast, by Application 2020 & 2033
- Table 46: Spain Veterinary Dermatological Drugs Industry Volume (Dosage) Forecast, by Application 2020 & 2033
- Table 47: Rest of Europe Veterinary Dermatological Drugs Industry Revenue (Million) Forecast, by Application 2020 & 2033
- Table 48: Rest of Europe Veterinary Dermatological Drugs Industry Volume (Dosage) Forecast, by Application 2020 & 2033
- Table 49: Global Veterinary Dermatological Drugs Industry Revenue Million Forecast, by Animal 2020 & 2033
- Table 50: Global Veterinary Dermatological Drugs Industry Volume Dosage Forecast, by Animal 2020 & 2033
- Table 51: Global Veterinary Dermatological Drugs Industry Revenue Million Forecast, by Route Of Administration 2020 & 2033
- Table 52: Global Veterinary Dermatological Drugs Industry Volume Dosage Forecast, by Route Of Administration 2020 & 2033
- Table 53: Global Veterinary Dermatological Drugs Industry Revenue Million Forecast, by Indication 2020 & 2033
- Table 54: Global Veterinary Dermatological Drugs Industry Volume Dosage Forecast, by Indication 2020 & 2033
- Table 55: Global Veterinary Dermatological Drugs Industry Revenue Million Forecast, by Distribution Channel 2020 & 2033
- Table 56: Global Veterinary Dermatological Drugs Industry Volume Dosage Forecast, by Distribution Channel 2020 & 2033
- Table 57: Global Veterinary Dermatological Drugs Industry Revenue Million Forecast, by Country 2020 & 2033
- Table 58: Global Veterinary Dermatological Drugs Industry Volume Dosage Forecast, by Country 2020 & 2033
- Table 59: India Veterinary Dermatological Drugs Industry Revenue (Million) Forecast, by Application 2020 & 2033
- Table 60: India Veterinary Dermatological Drugs Industry Volume (Dosage) Forecast, by Application 2020 & 2033
- Table 61: China Veterinary Dermatological Drugs Industry Revenue (Million) Forecast, by Application 2020 & 2033
- Table 62: China Veterinary Dermatological Drugs Industry Volume (Dosage) Forecast, by Application 2020 & 2033
- Table 63: Japan Veterinary Dermatological Drugs Industry Revenue (Million) Forecast, by Application 2020 & 2033
- Table 64: Japan Veterinary Dermatological Drugs Industry Volume (Dosage) Forecast, by Application 2020 & 2033
- Table 65: Australia Veterinary Dermatological Drugs Industry Revenue (Million) Forecast, by Application 2020 & 2033
- Table 66: Australia Veterinary Dermatological Drugs Industry Volume (Dosage) Forecast, by Application 2020 & 2033
- Table 67: South Korea Veterinary Dermatological Drugs Industry Revenue (Million) Forecast, by Application 2020 & 2033
- Table 68: South Korea Veterinary Dermatological Drugs Industry Volume (Dosage) Forecast, by Application 2020 & 2033
- Table 69: Rest of Asia Pacific Veterinary Dermatological Drugs Industry Revenue (Million) Forecast, by Application 2020 & 2033
- Table 70: Rest of Asia Pacific Veterinary Dermatological Drugs Industry Volume (Dosage) Forecast, by Application 2020 & 2033
- Table 71: Global Veterinary Dermatological Drugs Industry Revenue Million Forecast, by Animal 2020 & 2033
- Table 72: Global Veterinary Dermatological Drugs Industry Volume Dosage Forecast, by Animal 2020 & 2033
- Table 73: Global Veterinary Dermatological Drugs Industry Revenue Million Forecast, by Route Of Administration 2020 & 2033
- Table 74: Global Veterinary Dermatological Drugs Industry Volume Dosage Forecast, by Route Of Administration 2020 & 2033
- Table 75: Global Veterinary Dermatological Drugs Industry Revenue Million Forecast, by Indication 2020 & 2033
- Table 76: Global Veterinary Dermatological Drugs Industry Volume Dosage Forecast, by Indication 2020 & 2033
- Table 77: Global Veterinary Dermatological Drugs Industry Revenue Million Forecast, by Distribution Channel 2020 & 2033
- Table 78: Global Veterinary Dermatological Drugs Industry Volume Dosage Forecast, by Distribution Channel 2020 & 2033
- Table 79: Global Veterinary Dermatological Drugs Industry Revenue Million Forecast, by Country 2020 & 2033
- Table 80: Global Veterinary Dermatological Drugs Industry Volume Dosage Forecast, by Country 2020 & 2033
- Table 81: GCC Veterinary Dermatological Drugs Industry Revenue (Million) Forecast, by Application 2020 & 2033
- Table 82: GCC Veterinary Dermatological Drugs Industry Volume (Dosage) Forecast, by Application 2020 & 2033
- Table 83: South Africa Veterinary Dermatological Drugs Industry Revenue (Million) Forecast, by Application 2020 & 2033
- Table 84: South Africa Veterinary Dermatological Drugs Industry Volume (Dosage) Forecast, by Application 2020 & 2033
- Table 85: Rest of Middle East and Africa Veterinary Dermatological Drugs Industry Revenue (Million) Forecast, by Application 2020 & 2033
- Table 86: Rest of Middle East and Africa Veterinary Dermatological Drugs Industry Volume (Dosage) Forecast, by Application 2020 & 2033
- Table 87: Global Veterinary Dermatological Drugs Industry Revenue Million Forecast, by Animal 2020 & 2033
- Table 88: Global Veterinary Dermatological Drugs Industry Volume Dosage Forecast, by Animal 2020 & 2033
- Table 89: Global Veterinary Dermatological Drugs Industry Revenue Million Forecast, by Route Of Administration 2020 & 2033
- Table 90: Global Veterinary Dermatological Drugs Industry Volume Dosage Forecast, by Route Of Administration 2020 & 2033
- Table 91: Global Veterinary Dermatological Drugs Industry Revenue Million Forecast, by Indication 2020 & 2033
- Table 92: Global Veterinary Dermatological Drugs Industry Volume Dosage Forecast, by Indication 2020 & 2033
- Table 93: Global Veterinary Dermatological Drugs Industry Revenue Million Forecast, by Distribution Channel 2020 & 2033
- Table 94: Global Veterinary Dermatological Drugs Industry Volume Dosage Forecast, by Distribution Channel 2020 & 2033
- Table 95: Global Veterinary Dermatological Drugs Industry Revenue Million Forecast, by Country 2020 & 2033
- Table 96: Global Veterinary Dermatological Drugs Industry Volume Dosage Forecast, by Country 2020 & 2033
- Table 97: Brazil Veterinary Dermatological Drugs Industry Revenue (Million) Forecast, by Application 2020 & 2033
- Table 98: Brazil Veterinary Dermatological Drugs Industry Volume (Dosage) Forecast, by Application 2020 & 2033
- Table 99: Argentina Veterinary Dermatological Drugs Industry Revenue (Million) Forecast, by Application 2020 & 2033
- Table 100: Argentina Veterinary Dermatological Drugs Industry Volume (Dosage) Forecast, by Application 2020 & 2033
- Table 101: Rest of South America Veterinary Dermatological Drugs Industry Revenue (Million) Forecast, by Application 2020 & 2033
- Table 102: Rest of South America Veterinary Dermatological Drugs Industry Volume (Dosage) Forecast, by Application 2020 & 2033
Frequently Asked Questions
1. What is the projected Compound Annual Growth Rate (CAGR) of the Veterinary Dermatological Drugs Industry?
The projected CAGR is approximately 7.11%.
2. Which companies are prominent players in the Veterinary Dermatological Drugs Industry?
Key companies in the market include Elanco, Merk & Co Inc, Ceva, Vivaldis, Leti Pharma, Mars Incorporated, Indian Immunologicals Ltd, Bimeda Inc, Virbac, Bioiberica S A U, Zoetis Inc.
3. What are the main segments of the Veterinary Dermatological Drugs Industry?
The market segments include Animal, Route Of Administration, Indication, Distribution Channel.
4. Can you provide details about the market size?
The market size is estimated to be USD 6.38 Million as of 2022.
5. What are some drivers contributing to market growth?
Increasing Burden of Dermatological Diseases in Pets; Increasing Pet adoption and Animal Care.
6. What are the notable trends driving market growth?
Companion Animal Segment is Expected to have Significant Growth Over the Forecast period.
7. Are there any restraints impacting market growth?
Low availability and Lack of awareness of the drugs.
8. Can you provide examples of recent developments in the market?
In June 2023: Zoetis Announced FDA Approval of Apoquel® Chewable (oclacitinib chewable tablet) for Control of Pruritus Associated With Allergic Dermatitis and Control of Atopic Dermatitis in Dogs
9. What pricing options are available for accessing the report?
Pricing options include single-user, multi-user, and enterprise licenses priced at USD 4750, USD 5250, and USD 8750 respectively.
10. Is the market size provided in terms of value or volume?
The market size is provided in terms of value, measured in Million and volume, measured in Dosage.
11. Are there any specific market keywords associated with the report?
Yes, the market keyword associated with the report is "Veterinary Dermatological Drugs Industry," which aids in identifying and referencing the specific market segment covered.
12. How do I determine which pricing option suits my needs best?
The pricing options vary based on user requirements and access needs. Individual users may opt for single-user licenses, while businesses requiring broader access may choose multi-user or enterprise licenses for cost-effective access to the report.
13. Are there any additional resources or data provided in the Veterinary Dermatological Drugs Industry report?
While the report offers comprehensive insights, it's advisable to review the specific contents or supplementary materials provided to ascertain if additional resources or data are available.
14. How can I stay updated on further developments or reports in the Veterinary Dermatological Drugs Industry?
To stay informed about further developments, trends, and reports in the Veterinary Dermatological Drugs Industry, consider subscribing to industry newsletters, following relevant companies and organizations, or regularly checking reputable industry news sources and publications.
Methodology
Step 1 - Identification of Relevant Samples Size from Population Database


Step 2 - Approaches for Defining Global Market Size (Value, Volume* & Price*)

Note*: In applicable scenarios
Step 3 - Data Sources
Primary Research
- Web Analytics
- Survey Reports
- Research Institute
- Latest Research Reports
- Opinion Leaders
Secondary Research
- Annual Reports
- White Paper
- Latest Press Release
- Industry Association
- Paid Database
- Investor Presentations

Step 4 - Data Triangulation
Involves using different sources of information in order to increase the validity of a study
These sources are likely to be stakeholders in a program - participants, other researchers, program staff, other community members, and so on.
Then we put all data in single framework & apply various statistical tools to find out the dynamic on the market.
During the analysis stage, feedback from the stakeholder groups would be compared to determine areas of agreement as well as areas of divergence