

Key Insights
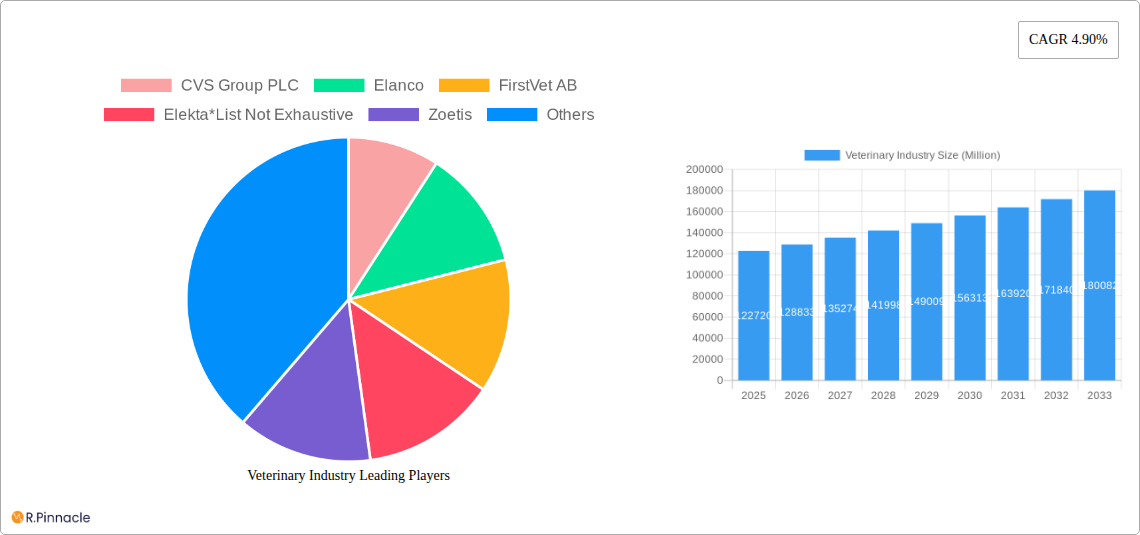
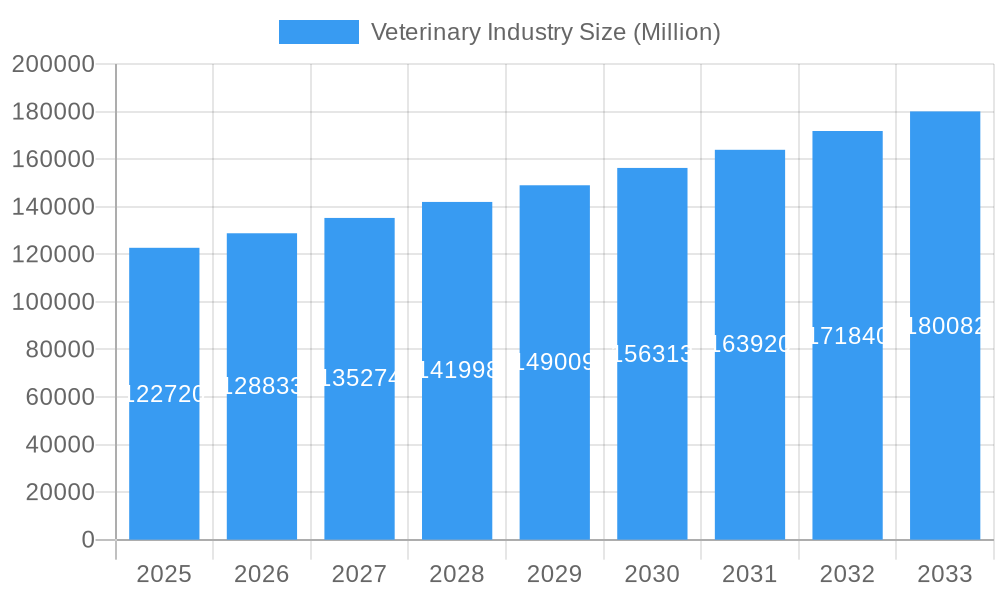
The global veterinary industry, valued at $122.72 billion in 2025, is experiencing robust growth, projected to expand at a compound annual growth rate (CAGR) of 4.90% from 2025 to 2033. This growth is fueled by several key factors. The increasing humanization of pets, leading to higher pet ownership and increased spending on pet healthcare, is a significant driver. Advances in veterinary medicine, including sophisticated diagnostic imaging, minimally invasive surgical techniques, and specialized treatments, are enhancing the quality and scope of animal care, further boosting market demand. The rising prevalence of chronic diseases in companion animals, mirroring trends in human health, necessitates ongoing veterinary care, contributing to sustained market expansion. Furthermore, the growing awareness of animal welfare and the increasing availability of pet insurance are contributing to higher veterinary service utilization rates.
Veterinary Industry Market Size (In Billion)
Geographic expansion also plays a significant role. While North America currently holds a substantial market share, driven by high pet ownership and advanced veterinary infrastructure, regions like Asia-Pacific are experiencing rapid growth due to rising disposable incomes and increasing pet adoption. Market segmentation reveals a strong demand for services across companion animals and farm animals, with surgery, diagnostic testing, and physical health monitoring segments representing major revenue contributors. The competitive landscape is characterized by a mix of large multinational corporations, smaller specialized veterinary practices, and emerging technology companies, all vying for market share through innovation and service diversification. Challenges remain, including varying regulatory landscapes across different regions, the rising cost of veterinary care, and potential labor shortages within the profession. However, the overall outlook for the veterinary industry remains positive, driven by consistent growth in pet ownership, technological advancements, and a growing commitment to animal health and welfare worldwide.
Veterinary Industry Company Market Share
Veterinary Industry Market Report: 2019-2033
This comprehensive report provides a detailed analysis of the global veterinary industry, projecting a market value exceeding $XX Million by 2033. It offers invaluable insights for industry professionals, investors, and stakeholders seeking to navigate the dynamic landscape of animal health. The report covers key market segments, leading players, and emerging trends, offering actionable intelligence for strategic decision-making. The study period is 2019-2033, with 2025 as the base and estimated year.
Veterinary Industry Market Structure & Innovation Trends
This section analyzes the structure of the $XX Million veterinary market, focusing on market concentration, innovation, regulations, and M&A activity from 2019 to 2024. The report examines the competitive landscape, identifying key players like Zoetis, Idexx Laboratories, and Mars Inc., and assessing their respective market shares. The analysis includes:
- Market Concentration: A detailed examination of market share distribution among major players, revealing the level of competition and potential for consolidation. Preliminary estimates suggest a moderately concentrated market with a few dominant players controlling a significant share.
- Innovation Drivers: An in-depth study of factors driving innovation, including technological advancements in diagnostics, therapeutics, and surgical techniques, alongside increasing demand for advanced animal healthcare solutions.
- Regulatory Frameworks: An assessment of the impact of global and regional regulations on market growth, including licensing, approvals, and safety standards.
- Product Substitutes: An evaluation of alternative treatments and technologies impacting market competition and influencing industry growth.
- End-User Demographics: A thorough analysis of changing demographics and their influence on demand for veterinary services, including the growing pet owner population and evolving pet ownership trends.
- M&A Activities: A review of significant mergers and acquisitions (M&A) in the industry during the historical period (2019-2024), including deal values and their impact on market dynamics. Total M&A deal value is estimated to have exceeded $XX Million during this period.
Veterinary Industry Market Dynamics & Trends
This section delves into the market dynamics and trends shaping the veterinary industry's growth trajectory from 2019 to 2033, focusing on key factors influencing market expansion. The analysis includes:
- Market Growth Drivers: Exploration of factors driving market expansion, such as rising pet ownership, increasing pet humanization, growing awareness of animal health, and technological advancements in veterinary care.
- Technological Disruptions: An examination of the impact of new technologies, such as telemedicine, AI-powered diagnostics, and personalized medicine, on the veterinary industry.
- Consumer Preferences: An analysis of changing consumer preferences, including increased demand for preventative care, specialized veterinary services, and pet insurance.
- Competitive Dynamics: An assessment of the competitive landscape, including the strategies employed by leading players to maintain or gain market share. The estimated Compound Annual Growth Rate (CAGR) for the forecast period (2025-2033) is projected to be XX%. Market penetration of key services will also be analyzed.
Dominant Regions & Segments in Veterinary Industry
This section identifies the dominant regions and segments within the veterinary industry based on service type (Surgery, Diagnostic Tests and Imaging, Physical Health Monitoring, Other Services) and animal type (Companion Animal, Farm Animal).
- Leading Regions: Analysis of regional market dominance, considering factors like economic development, infrastructure, and regulatory frameworks. The North American market is projected to maintain its leadership due to high pet ownership and advanced healthcare infrastructure.
- Leading Segments: Identification of the fastest-growing segments by service type and animal type, along with detailed analysis of their respective market drivers.
- Key Drivers (Bullet Points):
- Companion Animal Segment: Rising pet ownership, increasing humanization of pets, higher disposable incomes.
- Farm Animal Segment: Growing demand for livestock products, increasing focus on animal welfare, government initiatives promoting animal health.
- Diagnostic Tests and Imaging Segment: Advancements in diagnostic technologies, increased accuracy and efficiency of diagnosis.
- Surgery Segment: Growing demand for advanced surgical procedures, increased availability of specialized veterinary surgeons.
Veterinary Industry Product Innovations
This section summarizes key product developments, their applications, and their competitive advantages. Recent advancements include improved diagnostic tools, more effective therapeutics, and minimally invasive surgical techniques. These innovations are driving market growth by enhancing treatment outcomes and improving animal welfare. The integration of AI and telemedicine is also transforming veterinary practices, leading to enhanced efficiency and accessibility of care.
Report Scope & Segmentation Analysis
This report provides a comprehensive segmentation analysis of the veterinary market across various parameters. The analysis includes:
- By Service: Surgery, Diagnostic Tests and Imaging, Physical Health Monitoring, Other Services - each segment's market size, growth projections, and competitive dynamics are evaluated.
- By Animal Type: Companion Animal, Farm Animal - Market size, growth projections, and competitive dynamics are provided for each animal type. Growth projections for each segment are presented, outlining expected market sizes and competitive landscapes for the forecast period (2025-2033).
Key Drivers of Veterinary Industry Growth
The veterinary industry's growth is propelled by several factors: rising pet ownership and humanization of pets; increasing disposable incomes; advancements in diagnostic and therapeutic technologies; growing awareness of animal welfare; and supportive government regulations and initiatives. The increasing prevalence of chronic diseases in animals is also contributing to the growth.
Challenges in the Veterinary Industry Sector
The veterinary industry faces several challenges, including regulatory hurdles for new product approvals, supply chain disruptions impacting the availability of essential medicines and equipment, and intense competition among established players and new entrants. These challenges can impact market growth and profitability, requiring innovative solutions and strategic adaptations.
Emerging Opportunities in Veterinary Industry
Emerging opportunities include the expansion of telemedicine, the development of personalized medicine for animals, the increasing use of AI-powered diagnostic tools, and the growth of specialized veterinary services. These opportunities offer significant potential for market expansion and innovation.
Leading Players in the Veterinary Industry Market
- CVS Group PLC
- Elanco
- FirstVet AB
- Elekta
- Zoetis
- CityVet Inc
- Kremer Veterinary Services
- Ethos Veterinary Health
- Torigen Pharmaceuticals Inc
- Karyopharm Therapeutics Inc
- ELIAS Animal Health
- Greencross Limited
- Armor Animal Health (Animart)
- Mars Inc
- Idexx laboratories
Key Developments in Veterinary Industry Industry
- May 2022: Launch of 175 Mobile Ambulatory Veterinary Clinics (MAVCs) in Andhra Pradesh, India, signifying improved accessibility of veterinary services. This initiative, with a Rs 278 crore investment, aims to reach 340 MAVCs across the state.
- March 2022: Hacarus Inc. and DS Pharma Animal Health launched an ECG platform for early detection of canine cardiac disease, impacting diagnostics and preventative care.
Future Outlook for Veterinary Industry Market
The veterinary industry is poised for continued growth, driven by technological advancements, increasing pet humanization, and rising demand for specialized animal healthcare services. Strategic investments in innovation, expansion into new markets, and a focus on preventative care will be crucial for success in this dynamic sector. The market is projected to experience significant expansion throughout the forecast period (2025-2033).
Veterinary Industry Segmentation
-
1. Service
- 1.1. Surgery
- 1.2. Diagnostic Tests and Imaging
- 1.3. Physical Health Monitoring
- 1.4. Other Services
-
2. Animal Type
- 2.1. Companion Animal
- 2.2. Farm Animal
Veterinary Industry Segmentation By Geography
-
1. North America
- 1.1. United States
- 1.2. Canada
- 1.3. Mexico
-
2. Europe
- 2.1. Germany
- 2.2. United Kingdom
- 2.3. France
- 2.4. Italy
- 2.5. Spain
- 2.6. Rest of Europe
-
3. Asia Pacific
- 3.1. China
- 3.2. Japan
- 3.3. India
- 3.4. Australia
- 3.5. South Korea
- 3.6. Rest of Asia Pacific
-
4. Middle East and Africa
- 4.1. GCC
- 4.2. South Africa
- 4.3. Rest of Middle East and Africa
-
5. South America
- 5.1. Brazil
- 5.2. Argentina
- 5.3. Rest of South America
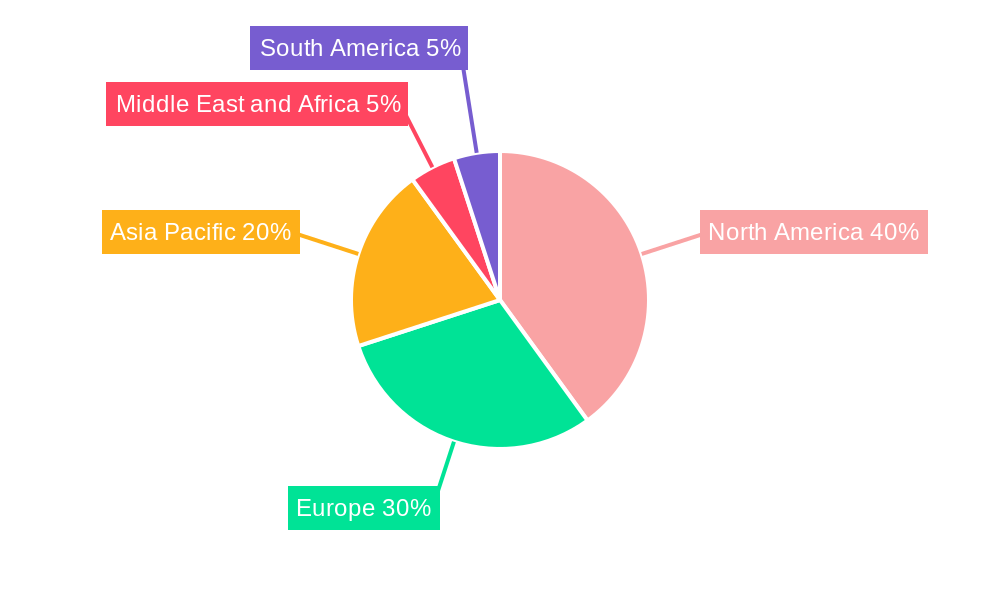
Veterinary Industry Regional Market Share
Geographic Coverage of Veterinary Industry
Veterinary Industry REPORT HIGHLIGHTS
| Aspects | Details |
|---|---|
| Study Period | 2020-2034 |
| Base Year | 2025 |
| Estimated Year | 2026 |
| Forecast Period | 2026-2034 |
| Historical Period | 2020-2025 |
| Growth Rate | CAGR of 4.90% from 2020-2034 |
| Segmentation |
|
Table of Contents
- 1. Introduction
- 1.1. Research Scope
- 1.2. Market Segmentation
- 1.3. Research Objective
- 1.4. Definitions and Assumptions
- 2. Executive Summary
- 2.1. Market Snapshot
- 3. Market Dynamics
- 3.1. Market Drivers
- 3.2. Market Restrains
- 3.3. Market Trends
- 3.4. Market Opportunities
- 4. Market Factor Analysis
- 4.1. Porters Five Forces
- 4.1.1. Bargaining Power of Suppliers
- 4.1.2. Bargaining Power of Buyers
- 4.1.3. Threat of New Entrants
- 4.1.4. Threat of Substitutes
- 4.1.5. Competitive Rivalry
- 4.2. PESTEL analysis
- 4.3. BCG Analysis
- 4.3.1. Stars (High Growth, High Market Share)
- 4.3.2. Cash Cows (Low Growth, High Market Share)
- 4.3.3. Question Mark (High Growth, Low Market Share)
- 4.3.4. Dogs (Low Growth, Low Market Share)
- 4.4. Ansoff Matrix Analysis
- 4.5. Supply Chain Analysis
- 4.6. Regulatory Landscape
- 4.7. Current Market Potential and Opportunity Assessment (TAM–SAM–SOM Framework)
- 4.8. PRI Analyst Note
- 4.1. Porters Five Forces
- 5. Market Analysis, Insights and Forecast 2021-2033
- 5.1. Market Analysis, Insights and Forecast - by Service
- 5.1.1. Surgery
- 5.1.2. Diagnostic Tests and Imaging
- 5.1.3. Physical Health Monitoring
- 5.1.4. Other Services
- 5.2. Market Analysis, Insights and Forecast - by Animal Type
- 5.2.1. Companion Animal
- 5.2.2. Farm Animal
- 5.3. Market Analysis, Insights and Forecast - by Region
- 5.3.1. North America
- 5.3.2. Europe
- 5.3.3. Asia Pacific
- 5.3.4. Middle East and Africa
- 5.3.5. South America
- 5.1. Market Analysis, Insights and Forecast - by Service
- 6. Global Veterinary Industry Analysis, Insights and Forecast, 2021-2033
- 6.1. Market Analysis, Insights and Forecast - by Service
- 6.1.1. Surgery
- 6.1.2. Diagnostic Tests and Imaging
- 6.1.3. Physical Health Monitoring
- 6.1.4. Other Services
- 6.2. Market Analysis, Insights and Forecast - by Animal Type
- 6.2.1. Companion Animal
- 6.2.2. Farm Animal
- 6.1. Market Analysis, Insights and Forecast - by Service
- 7. North America Veterinary Industry Analysis, Insights and Forecast, 2020-2032
- 7.1. Market Analysis, Insights and Forecast - by Service
- 7.1.1. Surgery
- 7.1.2. Diagnostic Tests and Imaging
- 7.1.3. Physical Health Monitoring
- 7.1.4. Other Services
- 7.2. Market Analysis, Insights and Forecast - by Animal Type
- 7.2.1. Companion Animal
- 7.2.2. Farm Animal
- 7.1. Market Analysis, Insights and Forecast - by Service
- 8. Europe Veterinary Industry Analysis, Insights and Forecast, 2020-2032
- 8.1. Market Analysis, Insights and Forecast - by Service
- 8.1.1. Surgery
- 8.1.2. Diagnostic Tests and Imaging
- 8.1.3. Physical Health Monitoring
- 8.1.4. Other Services
- 8.2. Market Analysis, Insights and Forecast - by Animal Type
- 8.2.1. Companion Animal
- 8.2.2. Farm Animal
- 8.1. Market Analysis, Insights and Forecast - by Service
- 9. Asia Pacific Veterinary Industry Analysis, Insights and Forecast, 2020-2032
- 9.1. Market Analysis, Insights and Forecast - by Service
- 9.1.1. Surgery
- 9.1.2. Diagnostic Tests and Imaging
- 9.1.3. Physical Health Monitoring
- 9.1.4. Other Services
- 9.2. Market Analysis, Insights and Forecast - by Animal Type
- 9.2.1. Companion Animal
- 9.2.2. Farm Animal
- 9.1. Market Analysis, Insights and Forecast - by Service
- 10. Middle East and Africa Veterinary Industry Analysis, Insights and Forecast, 2020-2032
- 10.1. Market Analysis, Insights and Forecast - by Service
- 10.1.1. Surgery
- 10.1.2. Diagnostic Tests and Imaging
- 10.1.3. Physical Health Monitoring
- 10.1.4. Other Services
- 10.2. Market Analysis, Insights and Forecast - by Animal Type
- 10.2.1. Companion Animal
- 10.2.2. Farm Animal
- 10.1. Market Analysis, Insights and Forecast - by Service
- 11. South America Veterinary Industry Analysis, Insights and Forecast, 2020-2032
- 11.1. Market Analysis, Insights and Forecast - by Service
- 11.1.1. Surgery
- 11.1.2. Diagnostic Tests and Imaging
- 11.1.3. Physical Health Monitoring
- 11.1.4. Other Services
- 11.2. Market Analysis, Insights and Forecast - by Animal Type
- 11.2.1. Companion Animal
- 11.2.2. Farm Animal
- 11.1. Market Analysis, Insights and Forecast - by Service
- 12. Competitive Analysis
- 12.1. Company Profiles
- 12.1.1 CVS Group PLC
- 12.1.1.1. Company Overview
- 12.1.1.2. Products
- 12.1.1.3. Company Financials
- 12.1.1.4. SWOT Analysis
- 12.1.2 Elanco
- 12.1.2.1. Company Overview
- 12.1.2.2. Products
- 12.1.2.3. Company Financials
- 12.1.2.4. SWOT Analysis
- 12.1.3 FirstVet AB
- 12.1.3.1. Company Overview
- 12.1.3.2. Products
- 12.1.3.3. Company Financials
- 12.1.3.4. SWOT Analysis
- 12.1.4 Elekta*List Not Exhaustive
- 12.1.4.1. Company Overview
- 12.1.4.2. Products
- 12.1.4.3. Company Financials
- 12.1.4.4. SWOT Analysis
- 12.1.5 Zoetis
- 12.1.5.1. Company Overview
- 12.1.5.2. Products
- 12.1.5.3. Company Financials
- 12.1.5.4. SWOT Analysis
- 12.1.6 CityVet Inc
- 12.1.6.1. Company Overview
- 12.1.6.2. Products
- 12.1.6.3. Company Financials
- 12.1.6.4. SWOT Analysis
- 12.1.7 Kremer Veterinary Services
- 12.1.7.1. Company Overview
- 12.1.7.2. Products
- 12.1.7.3. Company Financials
- 12.1.7.4. SWOT Analysis
- 12.1.8 Ethos Veterinary Health
- 12.1.8.1. Company Overview
- 12.1.8.2. Products
- 12.1.8.3. Company Financials
- 12.1.8.4. SWOT Analysis
- 12.1.9 Torigen Pharmaceuticals Inc
- 12.1.9.1. Company Overview
- 12.1.9.2. Products
- 12.1.9.3. Company Financials
- 12.1.9.4. SWOT Analysis
- 12.1.10 Karyopharm Therapeutics Inc
- 12.1.10.1. Company Overview
- 12.1.10.2. Products
- 12.1.10.3. Company Financials
- 12.1.10.4. SWOT Analysis
- 12.1.11 ELIAS Animal Health
- 12.1.11.1. Company Overview
- 12.1.11.2. Products
- 12.1.11.3. Company Financials
- 12.1.11.4. SWOT Analysis
- 12.1.12 Greencross Limited
- 12.1.12.1. Company Overview
- 12.1.12.2. Products
- 12.1.12.3. Company Financials
- 12.1.12.4. SWOT Analysis
- 12.1.13 Armor Animal Health (Animart)
- 12.1.13.1. Company Overview
- 12.1.13.2. Products
- 12.1.13.3. Company Financials
- 12.1.13.4. SWOT Analysis
- 12.1.14 Mars Inc
- 12.1.14.1. Company Overview
- 12.1.14.2. Products
- 12.1.14.3. Company Financials
- 12.1.14.4. SWOT Analysis
- 12.1.15 Idexx laboratories
- 12.1.15.1. Company Overview
- 12.1.15.2. Products
- 12.1.15.3. Company Financials
- 12.1.15.4. SWOT Analysis
- 12.1.1 CVS Group PLC
- 12.2. Market Entropy
- 12.2.1 Company's Key Areas Served
- 12.2.2 Recent Developments
- 12.3. Company Market Share Analysis 2025
- 12.3.1 Top 5 Companies Market Share Analysis
- 12.3.2 Top 3 Companies Market Share Analysis
- 12.4. List of Potential Customers
- 13. Research Methodology
List of Figures
- Figure 1: Global Veterinary Industry Revenue Breakdown (Million, %) by Region 2025 & 2033
- Figure 2: North America Veterinary Industry Revenue (Million), by Service 2025 & 2033
- Figure 3: North America Veterinary Industry Revenue Share (%), by Service 2025 & 2033
- Figure 4: North America Veterinary Industry Revenue (Million), by Animal Type 2025 & 2033
- Figure 5: North America Veterinary Industry Revenue Share (%), by Animal Type 2025 & 2033
- Figure 6: North America Veterinary Industry Revenue (Million), by Country 2025 & 2033
- Figure 7: North America Veterinary Industry Revenue Share (%), by Country 2025 & 2033
- Figure 8: Europe Veterinary Industry Revenue (Million), by Service 2025 & 2033
- Figure 9: Europe Veterinary Industry Revenue Share (%), by Service 2025 & 2033
- Figure 10: Europe Veterinary Industry Revenue (Million), by Animal Type 2025 & 2033
- Figure 11: Europe Veterinary Industry Revenue Share (%), by Animal Type 2025 & 2033
- Figure 12: Europe Veterinary Industry Revenue (Million), by Country 2025 & 2033
- Figure 13: Europe Veterinary Industry Revenue Share (%), by Country 2025 & 2033
- Figure 14: Asia Pacific Veterinary Industry Revenue (Million), by Service 2025 & 2033
- Figure 15: Asia Pacific Veterinary Industry Revenue Share (%), by Service 2025 & 2033
- Figure 16: Asia Pacific Veterinary Industry Revenue (Million), by Animal Type 2025 & 2033
- Figure 17: Asia Pacific Veterinary Industry Revenue Share (%), by Animal Type 2025 & 2033
- Figure 18: Asia Pacific Veterinary Industry Revenue (Million), by Country 2025 & 2033
- Figure 19: Asia Pacific Veterinary Industry Revenue Share (%), by Country 2025 & 2033
- Figure 20: Middle East and Africa Veterinary Industry Revenue (Million), by Service 2025 & 2033
- Figure 21: Middle East and Africa Veterinary Industry Revenue Share (%), by Service 2025 & 2033
- Figure 22: Middle East and Africa Veterinary Industry Revenue (Million), by Animal Type 2025 & 2033
- Figure 23: Middle East and Africa Veterinary Industry Revenue Share (%), by Animal Type 2025 & 2033
- Figure 24: Middle East and Africa Veterinary Industry Revenue (Million), by Country 2025 & 2033
- Figure 25: Middle East and Africa Veterinary Industry Revenue Share (%), by Country 2025 & 2033
- Figure 26: South America Veterinary Industry Revenue (Million), by Service 2025 & 2033
- Figure 27: South America Veterinary Industry Revenue Share (%), by Service 2025 & 2033
- Figure 28: South America Veterinary Industry Revenue (Million), by Animal Type 2025 & 2033
- Figure 29: South America Veterinary Industry Revenue Share (%), by Animal Type 2025 & 2033
- Figure 30: South America Veterinary Industry Revenue (Million), by Country 2025 & 2033
- Figure 31: South America Veterinary Industry Revenue Share (%), by Country 2025 & 2033
List of Tables
- Table 1: Global Veterinary Industry Revenue Million Forecast, by Service 2020 & 2033
- Table 2: Global Veterinary Industry Revenue Million Forecast, by Animal Type 2020 & 2033
- Table 3: Global Veterinary Industry Revenue Million Forecast, by Region 2020 & 2033
- Table 4: Global Veterinary Industry Revenue Million Forecast, by Service 2020 & 2033
- Table 5: Global Veterinary Industry Revenue Million Forecast, by Animal Type 2020 & 2033
- Table 6: Global Veterinary Industry Revenue Million Forecast, by Country 2020 & 2033
- Table 7: United States Veterinary Industry Revenue (Million) Forecast, by Application 2020 & 2033
- Table 8: Canada Veterinary Industry Revenue (Million) Forecast, by Application 2020 & 2033
- Table 9: Mexico Veterinary Industry Revenue (Million) Forecast, by Application 2020 & 2033
- Table 10: Global Veterinary Industry Revenue Million Forecast, by Service 2020 & 2033
- Table 11: Global Veterinary Industry Revenue Million Forecast, by Animal Type 2020 & 2033
- Table 12: Global Veterinary Industry Revenue Million Forecast, by Country 2020 & 2033
- Table 13: Germany Veterinary Industry Revenue (Million) Forecast, by Application 2020 & 2033
- Table 14: United Kingdom Veterinary Industry Revenue (Million) Forecast, by Application 2020 & 2033
- Table 15: France Veterinary Industry Revenue (Million) Forecast, by Application 2020 & 2033
- Table 16: Italy Veterinary Industry Revenue (Million) Forecast, by Application 2020 & 2033
- Table 17: Spain Veterinary Industry Revenue (Million) Forecast, by Application 2020 & 2033
- Table 18: Rest of Europe Veterinary Industry Revenue (Million) Forecast, by Application 2020 & 2033
- Table 19: Global Veterinary Industry Revenue Million Forecast, by Service 2020 & 2033
- Table 20: Global Veterinary Industry Revenue Million Forecast, by Animal Type 2020 & 2033
- Table 21: Global Veterinary Industry Revenue Million Forecast, by Country 2020 & 2033
- Table 22: China Veterinary Industry Revenue (Million) Forecast, by Application 2020 & 2033
- Table 23: Japan Veterinary Industry Revenue (Million) Forecast, by Application 2020 & 2033
- Table 24: India Veterinary Industry Revenue (Million) Forecast, by Application 2020 & 2033
- Table 25: Australia Veterinary Industry Revenue (Million) Forecast, by Application 2020 & 2033
- Table 26: South Korea Veterinary Industry Revenue (Million) Forecast, by Application 2020 & 2033
- Table 27: Rest of Asia Pacific Veterinary Industry Revenue (Million) Forecast, by Application 2020 & 2033
- Table 28: Global Veterinary Industry Revenue Million Forecast, by Service 2020 & 2033
- Table 29: Global Veterinary Industry Revenue Million Forecast, by Animal Type 2020 & 2033
- Table 30: Global Veterinary Industry Revenue Million Forecast, by Country 2020 & 2033
- Table 31: GCC Veterinary Industry Revenue (Million) Forecast, by Application 2020 & 2033
- Table 32: South Africa Veterinary Industry Revenue (Million) Forecast, by Application 2020 & 2033
- Table 33: Rest of Middle East and Africa Veterinary Industry Revenue (Million) Forecast, by Application 2020 & 2033
- Table 34: Global Veterinary Industry Revenue Million Forecast, by Service 2020 & 2033
- Table 35: Global Veterinary Industry Revenue Million Forecast, by Animal Type 2020 & 2033
- Table 36: Global Veterinary Industry Revenue Million Forecast, by Country 2020 & 2033
- Table 37: Brazil Veterinary Industry Revenue (Million) Forecast, by Application 2020 & 2033
- Table 38: Argentina Veterinary Industry Revenue (Million) Forecast, by Application 2020 & 2033
- Table 39: Rest of South America Veterinary Industry Revenue (Million) Forecast, by Application 2020 & 2033
Frequently Asked Questions
1. What is the projected Compound Annual Growth Rate (CAGR) of the Veterinary Industry?
The projected CAGR is approximately 4.90%.
2. Which companies are prominent players in the Veterinary Industry?
Key companies in the market include CVS Group PLC, Elanco, FirstVet AB, Elekta*List Not Exhaustive, Zoetis, CityVet Inc, Kremer Veterinary Services, Ethos Veterinary Health, Torigen Pharmaceuticals Inc, Karyopharm Therapeutics Inc, ELIAS Animal Health, Greencross Limited, Armor Animal Health (Animart), Mars Inc, Idexx laboratories.
3. What are the main segments of the Veterinary Industry?
The market segments include Service, Animal Type.
4. Can you provide details about the market size?
The market size is estimated to be USD 122.72 Million as of 2022.
5. What are some drivers contributing to market growth?
Increasing Prevalence of Various Diseases in Animals; Rising Adoption of Animals; Growing Expenditure on Animals/Pets.
6. What are the notable trends driving market growth?
The Companion Animal Segment is Expected to Dominate the Market.
7. Are there any restraints impacting market growth?
Shortage of Skilled Personnel; Increasing Cost of Veterinary Services.
8. Can you provide examples of recent developments in the market?
May 2022: The Chief Minister of Andhra Pradesh, Sri YS Jagan Mohan Reddy, officially launched 175 Mobile Ambulatory Veterinary Clinics (MAVCs) with an investment of Rs 278 crore. The state government planned to establish 340 Dr. YSR Sanchaara Pasu Aarogya Seva, or Mobile Ambulatory Veterinary Clinics (MAVC), in the state to improve the service delivery system and ensure that the veterinary services provided by the animal husbandry department are more easily accessible to the public.
9. What pricing options are available for accessing the report?
Pricing options include single-user, multi-user, and enterprise licenses priced at USD 4750, USD 5250, and USD 8750 respectively.
10. Is the market size provided in terms of value or volume?
The market size is provided in terms of value, measured in Million.
11. Are there any specific market keywords associated with the report?
Yes, the market keyword associated with the report is "Veterinary Industry," which aids in identifying and referencing the specific market segment covered.
12. How do I determine which pricing option suits my needs best?
The pricing options vary based on user requirements and access needs. Individual users may opt for single-user licenses, while businesses requiring broader access may choose multi-user or enterprise licenses for cost-effective access to the report.
13. Are there any additional resources or data provided in the Veterinary Industry report?
While the report offers comprehensive insights, it's advisable to review the specific contents or supplementary materials provided to ascertain if additional resources or data are available.
14. How can I stay updated on further developments or reports in the Veterinary Industry?
To stay informed about further developments, trends, and reports in the Veterinary Industry, consider subscribing to industry newsletters, following relevant companies and organizations, or regularly checking reputable industry news sources and publications.
Methodology
Step 1 - Identification of Relevant Samples Size from Population Database


Step 2 - Approaches for Defining Global Market Size (Value, Volume* & Price*)

Note*: In applicable scenarios
Step 3 - Data Sources
Primary Research
- Web Analytics
- Survey Reports
- Research Institute
- Latest Research Reports
- Opinion Leaders
Secondary Research
- Annual Reports
- White Paper
- Latest Press Release
- Industry Association
- Paid Database
- Investor Presentations

Step 4 - Data Triangulation
Involves using different sources of information in order to increase the validity of a study
These sources are likely to be stakeholders in a program - participants, other researchers, program staff, other community members, and so on.
Then we put all data in single framework & apply various statistical tools to find out the dynamic on the market.
During the analysis stage, feedback from the stakeholder groups would be compared to determine areas of agreement as well as areas of divergence