Video-on-Demand Market in Emerging Markets: Analysis and Projections 2025-2033

Video-on-Demand Market by Business Model (Subscription Video-on-demand (SVoD), Transactional Video-on-demand (TVoD), Other Business Models), by End-User (Consumers, Enterprises), by Device Type ( Smartphones, Tablets, TVs ), by Content Type (Movies, TV Shows, Sports), by North America, by Europe, by Asia Pacific, by Middle East and Africa, by Rest of the World Forecast 2025-2033

Jul 1 2025
Base Year: 2024

234 Pages
Main Logo

Video-on-Demand Market in Emerging Markets: Analysis and Projections 2025-2033


Home
Industries
Technology, Media and Telecom
sponsor image
sponsor image
sponsor image
sponsor image
sponsor image
sponsor image
sponsor image
sponsor image
sponsor image
sponsor image
sponsor image
sponsor image
sponsor image
sponsor image
sponsor image
sponsor image
sponsor image
sponsor image
sponsor image
sponsor image

Tailored for you

  • In-depth Analysis Tailored to Specified Regions or Segments
  • Company Profiles Customized to User Preferences
  • Comprehensive Insights Focused on Specific Segments or Regions
  • Customized Evaluation of Competitive Landscape to Meet Your Needs
  • Tailored Customization to Address Other Specific Requirements
Ask for customization


Key Insights

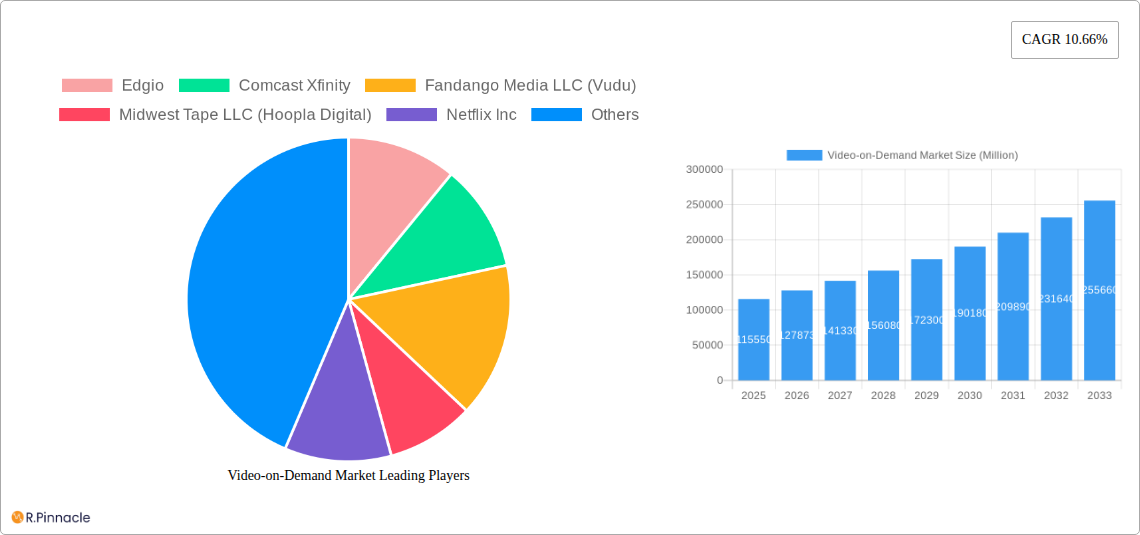
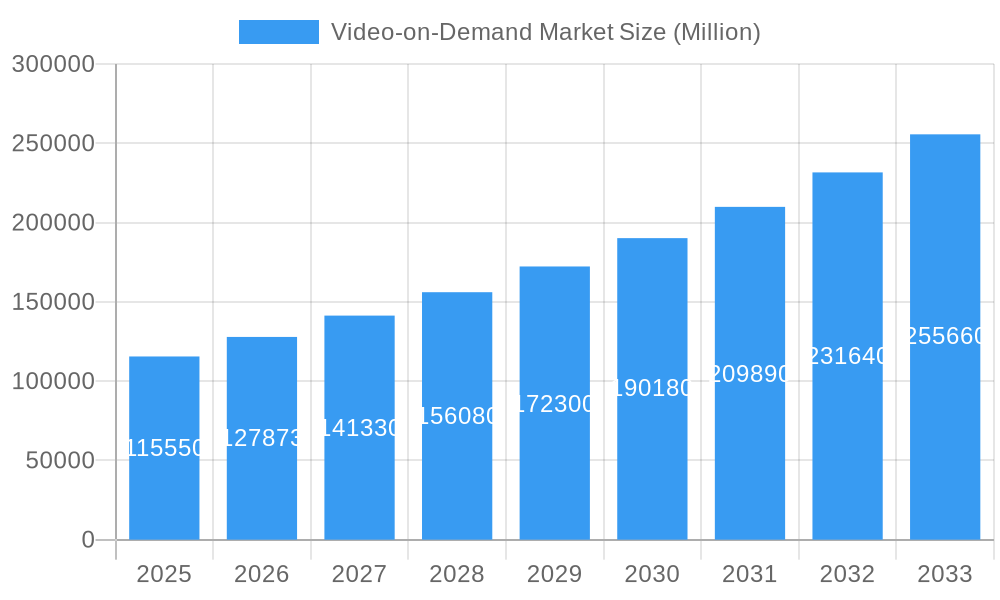
The Video-on-Demand (VOD) market, valued at $115.55 billion in 2025, is projected to experience robust growth, exhibiting a Compound Annual Growth Rate (CAGR) of 10.66% from 2025 to 2033. This expansion is fueled by several key drivers. The increasing penetration of high-speed internet globally, coupled with the rising affordability of smart devices like smartphones and tablets, has significantly broadened the accessibility of VOD services. Consumer preference for on-demand content consumption, flexible viewing options, and personalized viewing experiences further propel market growth. Furthermore, the continuous influx of high-quality original content from major streaming platforms, coupled with the integration of advanced features such as interactive content and personalized recommendations, enhances user engagement and fuels subscription rates. The market is segmented by business model, with Subscription Video-on-Demand (SVoD) currently dominating, followed by Transactional Video-on-Demand (TVoD). Competition is intense, with established players like Netflix, Disney+, and Amazon Prime Video vying for market share alongside emerging platforms and niche providers. Geographic expansion, particularly in developing economies with growing internet penetration, presents significant opportunities.

However, certain restraints also influence the market trajectory. These include the increasing cost of content acquisition and production, particularly for high-quality original programming. Competition for consumer spending on entertainment remains fierce, with other avenues like gaming and live events vying for attention. Furthermore, the prevalence of piracy and concerns around data privacy can pose challenges. Nevertheless, the market's overall growth trajectory remains positive, driven by ongoing technological advancements, content innovation, and evolving consumer preferences. The continued development of personalized recommendations, improved user interfaces, and the integration of virtual reality (VR) and augmented reality (AR) technologies are likely to shape the future landscape of the VOD market. The emergence of new business models and innovative monetization strategies will also contribute to this evolving market dynamic.

Video-on-Demand Market Research Report - Market Size, Growth & Forecast

Video-on-Demand Market Report: 2019-2033

This comprehensive report provides an in-depth analysis of the Video-on-Demand (VOD) market, offering crucial insights for industry professionals, investors, and strategists. The study period covers 2019-2033, with a base year of 2025 and a forecast period of 2025-2033. The report projects a market valuation exceeding xx Million by 2033, driven by significant technological advancements and evolving consumer preferences. Key players like Netflix, Amazon Prime Video, and Disney+ are analyzed alongside emerging competitors, revealing market share dynamics and competitive strategies. This report is essential for understanding the current landscape and future trajectory of the VOD market, a sector poised for continued expansion.

Video-on-Demand Market Market Structure & Innovation Trends

The Video-on-Demand market exhibits a dynamic structure characterized by a mix of established giants and emerging players. Market concentration is moderate, with a few dominant players holding significant shares, while numerous smaller companies compete in niche segments. Netflix, Amazon Prime Video, and Disney+ command considerable market share, estimated at xx%, xx%, and xx% respectively in 2025. However, the market's fragmented nature presents opportunities for agile startups.

Innovation is a key driver, fueled by advancements in streaming technology, personalized content recommendations, and immersive viewing experiences. Regulatory frameworks, particularly concerning content licensing, data privacy, and net neutrality, significantly impact market dynamics. Product substitutes, such as traditional television and other forms of entertainment, exert competitive pressure, although the convenience and flexibility of VOD services have significantly reduced their influence.

End-user demographics are expanding, with significant growth in both developed and emerging markets. The increasing adoption of smartphones and high-speed internet access fuels this expansion. Mergers and acquisitions (M&A) activity is prevalent, with deal values in the billions of dollars observed in recent years. For example, the Amazon-AMC Networks partnership in June 2022 reflects the strategic consolidation shaping the market landscape.

Video-on-Demand Market Growth

Video-on-Demand Market Market Dynamics & Trends

The Video-on-Demand market is experiencing robust growth, with a projected Compound Annual Growth Rate (CAGR) of xx% during the forecast period (2025-2033). Several factors contribute to this expansion. The rising affordability and accessibility of high-speed internet, coupled with the proliferation of smart devices, have broadened the reach of VOD services. Consumer preferences are shifting towards on-demand content consumption, favoring the flexibility and convenience offered by VOD platforms over traditional linear television. Technological disruptions, such as the rise of 4K and HDR streaming, enhanced personalization algorithms, and the integration of virtual reality (VR) and augmented reality (AR) technologies, are transforming the user experience and fueling market growth. Competitive dynamics are intense, with established players investing heavily in content acquisition, technological innovation, and user experience enhancements to maintain their market positions. Market penetration is high in developed countries, but substantial growth potential remains in emerging markets with expanding internet infrastructure and rising disposable incomes.

Video-on-Demand Market Growth

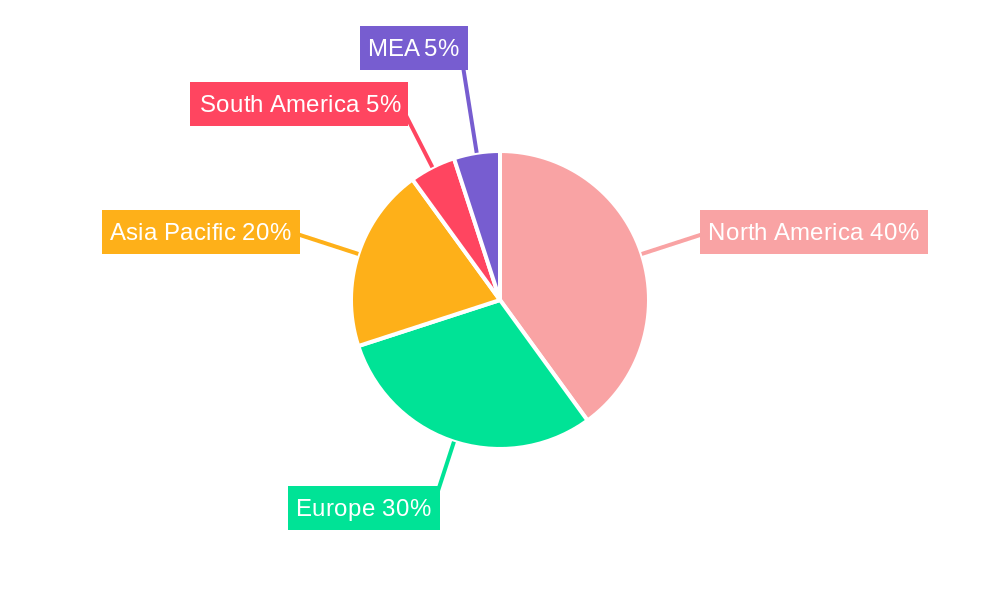
Dominant Regions & Segments in Video-on-Demand Market

The Video-on-Demand market exhibits significant regional variations in growth and adoption rates. North America currently holds the largest market share, driven by high internet penetration, strong consumer spending power, and a mature technological infrastructure. However, Asia-Pacific is projected to experience the fastest growth rate during the forecast period, fueled by the expanding subscriber base in countries like India and China.

  • By Business Model:

    • Subscription Video-on-Demand (SVoD): This segment dominates the market, with a projected market size exceeding xx Million in 2025. Key drivers include the convenience of fixed monthly subscriptions and extensive content libraries.
    • Transactional Video-on-Demand (TVoD): This segment offers consumers the flexibility to purchase individual videos or movies. Growth in this segment is influenced by factors such as the release of new movie titles and consumer preferences for specific content.
    • Other Business Models: This segment encompasses various models, including advertising-supported VOD (AVOD) and freemium models. Growth in this segment is dependent upon the success of various business models and effective advertising strategies.

The dominance of specific regions and segments is primarily attributed to factors such as economic growth, internet penetration, technological advancement, regulatory environments and cultural factors.

Video-on-Demand Market Product Innovations

Recent product innovations in the Video-on-Demand market are focused on enhancing user experience, personalizing content delivery, and expanding content options. High-definition streaming (4K, HDR), interactive content, and personalized recommendations are becoming increasingly prevalent. The integration of artificial intelligence (AI) for content discovery and improved user interfaces are also key trends. These innovations are enhancing the value proposition of VOD services, attracting new subscribers and fostering loyalty among existing users. Furthermore, the emergence of virtual and augmented reality applications within the VOD space is creating new market opportunities.

Report Scope & Segmentation Analysis

This report segments the Video-on-Demand market primarily by business model: Subscription Video-on-Demand (SVoD), Transactional Video-on-Demand (TVoD), and Other Business Models.

  • SVoD: This segment is characterized by high growth due to the convenience and value offered to consumers. Market size in 2025 is estimated at xx Million, and competition is intense among major players.

  • TVoD: This segment provides flexibility, but is subject to fluctuating demand based on new releases and consumer preferences. Market size in 2025 is estimated at xx Million.

  • Other Business Models: This encompasses various models, each with varying growth trajectories and competitive dynamics. Market size in 2025 is projected at xx Million.

Key Drivers of Video-on-Demand Market Growth

The Video-on-Demand market's growth is driven by several interconnected factors. Technological advancements, including higher-bandwidth internet access and improved streaming technologies, have enhanced the viewing experience and broadened accessibility. Economic factors, such as rising disposable incomes and the increasing affordability of smart devices, have fueled consumer adoption. Favorable regulatory environments that promote competition and innovation have also contributed to market expansion. Examples include government initiatives supporting broadband infrastructure development and policies encouraging the creation of local content.

Challenges in the Video-on-Demand Market Sector

The Video-on-Demand market faces several challenges, including increasing competition, content piracy, and the high cost of content acquisition. Regulatory hurdles, such as varying content licensing agreements across different regions, add complexity to operations. Supply chain disruptions, including bandwidth limitations and network congestion, can impact service delivery. These challenges can affect market growth and profitability if not effectively addressed by industry players. The impact of piracy on revenue streams is estimated to be xx Million annually.

Emerging Opportunities in Video-on-Demand Market

Emerging opportunities exist in expanding into new markets with growing internet penetration, particularly in developing economies. The integration of new technologies, such as virtual and augmented reality, artificial intelligence, and the metaverse, presents significant potential for innovation and service diversification. The rise of personalized content experiences tailored to individual user preferences offers a competitive advantage. Furthermore, partnerships and collaborations between VOD platforms and content creators can unlock unique opportunities for growth and expansion.

Leading Players in the Video-on-Demand Market Market

  • Edgio
  • Comcast Xfinity
  • Fandango Media LLC (Vudu)
  • Midwest Tape LLC (Hoopla Digital)
  • Netflix Inc
  • DirecTV
  • Vubiquity Inc
  • The Walt Disney Company (Disney+)
  • DISH Network LLC
  • Dacast Inc
  • Wistia Inc
  • Warner Bros Discovery Inc
  • Novi Digital Entertainment Private Limited (Hotstar)
  • Hulu LLC
  • Fujitsu
  • Amazon com Inc (Amazon Prime Video)
  • Kaltura
  • Popcornflix LLC
  • Apple Inc
  • Zee Entertainment Enterprises Ltd (Zee5)

Key Developments in Video-on-Demand Market Industry

  • January 2023: FOX Entertainment and Hulu announced a multi-year content partnership, significantly expanding Hulu's content library and strengthening its market position. This move impacts market dynamics by consolidating content rights and promoting cross-platform marketing.

  • June 2022: Amazon Prime Video partnered with AMC Networks in India, expanding its content offerings and increasing its competitive edge in the Indian VOD market. This partnership exemplifies the strategic alliances shaping the industry.

Future Outlook for Video-on-Demand Market Market

The Video-on-Demand market is poised for continued expansion, driven by sustained technological innovation, growing consumer demand, and the entry of new players. Strategic opportunities abound in expanding into underserved markets, developing personalized content experiences, and integrating emerging technologies such as VR/AR and AI. The market’s future trajectory hinges on the ability of companies to adapt to evolving consumer preferences, manage content costs effectively, and navigate the complexities of a highly competitive landscape. The convergence of traditional media and streaming services presents a significant growth area.

Video-on-Demand Market Segmentation

  • 1. Business Model
    • 1.1. Subscription Video-on-demand (SVoD)
    • 1.2. Transactional Video-on-demand (TVoD)
    • 1.3. Other Business Models
  • 2. End-User
    • 2.1. Consumers
    • 2.2. Enterprises
  • 3. Device Type
    • 3.1. Smartphones
    • 3.2. Tablets
    • 3.3. TVs
  • 4. Content Type
    • 4.1. Movies
    • 4.2. TV Shows
    • 4.3. Sports

Video-on-Demand Market Segmentation By Geography

  • 1. North America
  • 2. Europe
  • 3. Asia Pacific
  • 4. Middle East and Africa
  • 5. Rest of the World
Video-on-Demand Market Regional Share


Video-on-Demand Market REPORT HIGHLIGHTS

AspectsDetails
Study Period 2019-2033
Base Year 2024
Estimated Year 2025
Forecast Period2025-2033
Historical Period2019-2024
Growth RateCAGR of 10.66% from 2019-2033
Segmentation
    • By Business Model
      • Subscription Video-on-demand (SVoD)
      • Transactional Video-on-demand (TVoD)
      • Other Business Models
    • By End-User
      • Consumers
      • Enterprises
    • By Device Type
      • Smartphones
      • Tablets
      • TVs
    • By Content Type
      • Movies
      • TV Shows
      • Sports
  • By Geography
    • North America
    • Europe
    • Asia Pacific
    • Middle East and Africa
    • Rest of the World


Table of Contents

  1. 1. Introduction
    • 1.1. Research Scope
    • 1.2. Market Segmentation
    • 1.3. Research Methodology
    • 1.4. Definitions and Assumptions
  2. 2. Executive Summary
    • 2.1. Introduction
  3. 3. Market Dynamics
    • 3.1. Introduction
      • 3.2. Market Drivers
        • 3.2.1. Developments in Digital Video Landscape; Surge in Mobile Based Internet Users
      • 3.3. Market Restrains
        • 3.3.1. Growing Threat of Video Content Piracy
      • 3.4. Market Trends
        • 3.4.1. Surge in Mobile-based Internet Users to Drive the Market
  4. 4. Market Factor Analysis
    • 4.1. Porters Five Forces
    • 4.2. Supply/Value Chain
    • 4.3. PESTEL analysis
    • 4.4. Market Entropy
    • 4.5. Patent/Trademark Analysis
  5. 5. Global Video-on-Demand Market Analysis, Insights and Forecast, 2019-2031
    • 5.1. Market Analysis, Insights and Forecast - by Business Model
      • 5.1.1. Subscription Video-on-demand (SVoD)
      • 5.1.2. Transactional Video-on-demand (TVoD)
      • 5.1.3. Other Business Models
    • 5.2. Market Analysis, Insights and Forecast - by End-User
      • 5.2.1. Consumers
      • 5.2.2. Enterprises
    • 5.3. Market Analysis, Insights and Forecast - by Device Type
      • 5.3.1. Smartphones
      • 5.3.2. Tablets
      • 5.3.3. TVs
    • 5.4. Market Analysis, Insights and Forecast - by Content Type
      • 5.4.1. Movies
      • 5.4.2. TV Shows
      • 5.4.3. Sports
    • 5.5. Market Analysis, Insights and Forecast - by Region
      • 5.5.1. North America
      • 5.5.2. Europe
      • 5.5.3. Asia Pacific
      • 5.5.4. Middle East and Africa
      • 5.5.5. Rest of the World
  6. 6. North America Video-on-Demand Market Analysis, Insights and Forecast, 2019-2031
    • 6.1. Market Analysis, Insights and Forecast - by Business Model
      • 6.1.1. Subscription Video-on-demand (SVoD)
      • 6.1.2. Transactional Video-on-demand (TVoD)
      • 6.1.3. Other Business Models
    • 6.2. Market Analysis, Insights and Forecast - by End-User
      • 6.2.1. Consumers
      • 6.2.2. Enterprises
    • 6.3. Market Analysis, Insights and Forecast - by Device Type
      • 6.3.1. Smartphones
      • 6.3.2. Tablets
      • 6.3.3. TVs
    • 6.4. Market Analysis, Insights and Forecast - by Content Type
      • 6.4.1. Movies
      • 6.4.2. TV Shows
      • 6.4.3. Sports
  7. 7. Europe Video-on-Demand Market Analysis, Insights and Forecast, 2019-2031
    • 7.1. Market Analysis, Insights and Forecast - by Business Model
      • 7.1.1. Subscription Video-on-demand (SVoD)
      • 7.1.2. Transactional Video-on-demand (TVoD)
      • 7.1.3. Other Business Models
    • 7.2. Market Analysis, Insights and Forecast - by End-User
      • 7.2.1. Consumers
      • 7.2.2. Enterprises
    • 7.3. Market Analysis, Insights and Forecast - by Device Type
      • 7.3.1. Smartphones
      • 7.3.2. Tablets
      • 7.3.3. TVs
    • 7.4. Market Analysis, Insights and Forecast - by Content Type
      • 7.4.1. Movies
      • 7.4.2. TV Shows
      • 7.4.3. Sports
  8. 8. Asia Pacific Video-on-Demand Market Analysis, Insights and Forecast, 2019-2031
    • 8.1. Market Analysis, Insights and Forecast - by Business Model
      • 8.1.1. Subscription Video-on-demand (SVoD)
      • 8.1.2. Transactional Video-on-demand (TVoD)
      • 8.1.3. Other Business Models
    • 8.2. Market Analysis, Insights and Forecast - by End-User
      • 8.2.1. Consumers
      • 8.2.2. Enterprises
    • 8.3. Market Analysis, Insights and Forecast - by Device Type
      • 8.3.1. Smartphones
      • 8.3.2. Tablets
      • 8.3.3. TVs
    • 8.4. Market Analysis, Insights and Forecast - by Content Type
      • 8.4.1. Movies
      • 8.4.2. TV Shows
      • 8.4.3. Sports
  9. 9. Middle East and Africa Video-on-Demand Market Analysis, Insights and Forecast, 2019-2031
    • 9.1. Market Analysis, Insights and Forecast - by Business Model
      • 9.1.1. Subscription Video-on-demand (SVoD)
      • 9.1.2. Transactional Video-on-demand (TVoD)
      • 9.1.3. Other Business Models
    • 9.2. Market Analysis, Insights and Forecast - by End-User
      • 9.2.1. Consumers
      • 9.2.2. Enterprises
    • 9.3. Market Analysis, Insights and Forecast - by Device Type
      • 9.3.1. Smartphones
      • 9.3.2. Tablets
      • 9.3.3. TVs
    • 9.4. Market Analysis, Insights and Forecast - by Content Type
      • 9.4.1. Movies
      • 9.4.2. TV Shows
      • 9.4.3. Sports
  10. 10. Rest of the World Video-on-Demand Market Analysis, Insights and Forecast, 2019-2031
    • 10.1. Market Analysis, Insights and Forecast - by Business Model
      • 10.1.1. Subscription Video-on-demand (SVoD)
      • 10.1.2. Transactional Video-on-demand (TVoD)
      • 10.1.3. Other Business Models
    • 10.2. Market Analysis, Insights and Forecast - by End-User
      • 10.2.1. Consumers
      • 10.2.2. Enterprises
    • 10.3. Market Analysis, Insights and Forecast - by Device Type
      • 10.3.1. Smartphones
      • 10.3.2. Tablets
      • 10.3.3. TVs
    • 10.4. Market Analysis, Insights and Forecast - by Content Type
      • 10.4.1. Movies
      • 10.4.2. TV Shows
      • 10.4.3. Sports
  11. 11. North America Video-on-Demand Market Analysis, Insights and Forecast, 2019-2031
      • 11.1. Market Analysis, Insights and Forecast - By Country/Sub-region
        • 11.1.1 United States
        • 11.1.2 Canada
        • 11.1.3 Mexico
  12. 12. Europe Video-on-Demand Market Analysis, Insights and Forecast, 2019-2031
      • 12.1. Market Analysis, Insights and Forecast - By Country/Sub-region
        • 12.1.1 Germany
        • 12.1.2 United Kingdom
        • 12.1.3 France
        • 12.1.4 Spain
        • 12.1.5 Italy
        • 12.1.6 Spain
        • 12.1.7 Belgium
        • 12.1.8 Netherland
        • 12.1.9 Nordics
        • 12.1.10 Rest of Europe
  13. 13. Asia Pacific Video-on-Demand Market Analysis, Insights and Forecast, 2019-2031
      • 13.1. Market Analysis, Insights and Forecast - By Country/Sub-region
        • 13.1.1 China
        • 13.1.2 Japan
        • 13.1.3 India
        • 13.1.4 South Korea
        • 13.1.5 Southeast Asia
        • 13.1.6 Australia
        • 13.1.7 Indonesia
        • 13.1.8 Phillipes
        • 13.1.9 Singapore
        • 13.1.10 Thailandc
        • 13.1.11 Rest of Asia Pacific
  14. 14. South America Video-on-Demand Market Analysis, Insights and Forecast, 2019-2031
      • 14.1. Market Analysis, Insights and Forecast - By Country/Sub-region
        • 14.1.1 Brazil
        • 14.1.2 Argentina
        • 14.1.3 Peru
        • 14.1.4 Chile
        • 14.1.5 Colombia
        • 14.1.6 Ecuador
        • 14.1.7 Venezuela
        • 14.1.8 Rest of South America
  15. 15. North America Video-on-Demand Market Analysis, Insights and Forecast, 2019-2031
      • 15.1. Market Analysis, Insights and Forecast - By Country/Sub-region
        • 15.1.1 United States
        • 15.1.2 Canada
        • 15.1.3 Mexico
  16. 16. MEA Video-on-Demand Market Analysis, Insights and Forecast, 2019-2031
      • 16.1. Market Analysis, Insights and Forecast - By Country/Sub-region
        • 16.1.1 United Arab Emirates
        • 16.1.2 Saudi Arabia
        • 16.1.3 South Africa
        • 16.1.4 Rest of Middle East and Africa
  17. 17. Competitive Analysis
    • 17.1. Global Market Share Analysis 2024
      • 17.2. Company Profiles
        • 17.2.1 Edgio
          • 17.2.1.1. Overview
          • 17.2.1.2. Products
          • 17.2.1.3. SWOT Analysis
          • 17.2.1.4. Recent Developments
          • 17.2.1.5. Financials (Based on Availability)
        • 17.2.2 Comcast Xfinity
          • 17.2.2.1. Overview
          • 17.2.2.2. Products
          • 17.2.2.3. SWOT Analysis
          • 17.2.2.4. Recent Developments
          • 17.2.2.5. Financials (Based on Availability)
        • 17.2.3 Fandango Media LLC (Vudu)
          • 17.2.3.1. Overview
          • 17.2.3.2. Products
          • 17.2.3.3. SWOT Analysis
          • 17.2.3.4. Recent Developments
          • 17.2.3.5. Financials (Based on Availability)
        • 17.2.4 Midwest Tape LLC (Hoopla Digital)
          • 17.2.4.1. Overview
          • 17.2.4.2. Products
          • 17.2.4.3. SWOT Analysis
          • 17.2.4.4. Recent Developments
          • 17.2.4.5. Financials (Based on Availability)
        • 17.2.5 Netflix Inc
          • 17.2.5.1. Overview
          • 17.2.5.2. Products
          • 17.2.5.3. SWOT Analysis
          • 17.2.5.4. Recent Developments
          • 17.2.5.5. Financials (Based on Availability)
        • 17.2.6 DirecTV
          • 17.2.6.1. Overview
          • 17.2.6.2. Products
          • 17.2.6.3. SWOT Analysis
          • 17.2.6.4. Recent Developments
          • 17.2.6.5. Financials (Based on Availability)
        • 17.2.7 Vubiquity Inc
          • 17.2.7.1. Overview
          • 17.2.7.2. Products
          • 17.2.7.3. SWOT Analysis
          • 17.2.7.4. Recent Developments
          • 17.2.7.5. Financials (Based on Availability)
        • 17.2.8 The Walt Disney Company (Disney+)
          • 17.2.8.1. Overview
          • 17.2.8.2. Products
          • 17.2.8.3. SWOT Analysis
          • 17.2.8.4. Recent Developments
          • 17.2.8.5. Financials (Based on Availability)
        • 17.2.9 DISH Network LLC
          • 17.2.9.1. Overview
          • 17.2.9.2. Products
          • 17.2.9.3. SWOT Analysis
          • 17.2.9.4. Recent Developments
          • 17.2.9.5. Financials (Based on Availability)
        • 17.2.10 Dacast Inc
          • 17.2.10.1. Overview
          • 17.2.10.2. Products
          • 17.2.10.3. SWOT Analysis
          • 17.2.10.4. Recent Developments
          • 17.2.10.5. Financials (Based on Availability)
        • 17.2.11 Wistia Inc
          • 17.2.11.1. Overview
          • 17.2.11.2. Products
          • 17.2.11.3. SWOT Analysis
          • 17.2.11.4. Recent Developments
          • 17.2.11.5. Financials (Based on Availability)
        • 17.2.12 Warner Bros Discovery Inc
          • 17.2.12.1. Overview
          • 17.2.12.2. Products
          • 17.2.12.3. SWOT Analysis
          • 17.2.12.4. Recent Developments
          • 17.2.12.5. Financials (Based on Availability)
        • 17.2.13 Novi Digital Entertainment Private Limited (Hotstar)
          • 17.2.13.1. Overview
          • 17.2.13.2. Products
          • 17.2.13.3. SWOT Analysis
          • 17.2.13.4. Recent Developments
          • 17.2.13.5. Financials (Based on Availability)
        • 17.2.14 Hulu LLC
          • 17.2.14.1. Overview
          • 17.2.14.2. Products
          • 17.2.14.3. SWOT Analysis
          • 17.2.14.4. Recent Developments
          • 17.2.14.5. Financials (Based on Availability)
        • 17.2.15 Fujitsu
          • 17.2.15.1. Overview
          • 17.2.15.2. Products
          • 17.2.15.3. SWOT Analysis
          • 17.2.15.4. Recent Developments
          • 17.2.15.5. Financials (Based on Availability)
        • 17.2.16 Amazon com Inc (Amazon Prime Video)
          • 17.2.16.1. Overview
          • 17.2.16.2. Products
          • 17.2.16.3. SWOT Analysis
          • 17.2.16.4. Recent Developments
          • 17.2.16.5. Financials (Based on Availability)
        • 17.2.17 Kaltura
          • 17.2.17.1. Overview
          • 17.2.17.2. Products
          • 17.2.17.3. SWOT Analysis
          • 17.2.17.4. Recent Developments
          • 17.2.17.5. Financials (Based on Availability)
        • 17.2.18 Popcornflix LLC
          • 17.2.18.1. Overview
          • 17.2.18.2. Products
          • 17.2.18.3. SWOT Analysis
          • 17.2.18.4. Recent Developments
          • 17.2.18.5. Financials (Based on Availability)
        • 17.2.19 Apple Inc
          • 17.2.19.1. Overview
          • 17.2.19.2. Products
          • 17.2.19.3. SWOT Analysis
          • 17.2.19.4. Recent Developments
          • 17.2.19.5. Financials (Based on Availability)
        • 17.2.20 Zee Entertainment Enterprises Ltd (Zee5)
          • 17.2.20.1. Overview
          • 17.2.20.2. Products
          • 17.2.20.3. SWOT Analysis
          • 17.2.20.4. Recent Developments
          • 17.2.20.5. Financials (Based on Availability)

List of Figures

  1. Figure 1: Global Video-on-Demand Market Revenue Breakdown (Million, %) by Region 2024 & 2032
  2. Figure 2: Global Video-on-Demand Market Volume Breakdown (K Unit, %) by Region 2024 & 2032
  3. Figure 3: North America Video-on-Demand Market Revenue (Million), by Country 2024 & 2032
  4. Figure 4: North America Video-on-Demand Market Volume (K Unit), by Country 2024 & 2032
  5. Figure 5: North America Video-on-Demand Market Revenue Share (%), by Country 2024 & 2032
  6. Figure 6: North America Video-on-Demand Market Volume Share (%), by Country 2024 & 2032
  7. Figure 7: Europe Video-on-Demand Market Revenue (Million), by Country 2024 & 2032
  8. Figure 8: Europe Video-on-Demand Market Volume (K Unit), by Country 2024 & 2032
  9. Figure 9: Europe Video-on-Demand Market Revenue Share (%), by Country 2024 & 2032
  10. Figure 10: Europe Video-on-Demand Market Volume Share (%), by Country 2024 & 2032
  11. Figure 11: Asia Pacific Video-on-Demand Market Revenue (Million), by Country 2024 & 2032
  12. Figure 12: Asia Pacific Video-on-Demand Market Volume (K Unit), by Country 2024 & 2032
  13. Figure 13: Asia Pacific Video-on-Demand Market Revenue Share (%), by Country 2024 & 2032
  14. Figure 14: Asia Pacific Video-on-Demand Market Volume Share (%), by Country 2024 & 2032
  15. Figure 15: South America Video-on-Demand Market Revenue (Million), by Country 2024 & 2032
  16. Figure 16: South America Video-on-Demand Market Volume (K Unit), by Country 2024 & 2032
  17. Figure 17: South America Video-on-Demand Market Revenue Share (%), by Country 2024 & 2032
  18. Figure 18: South America Video-on-Demand Market Volume Share (%), by Country 2024 & 2032
  19. Figure 19: North America Video-on-Demand Market Revenue (Million), by Country 2024 & 2032
  20. Figure 20: North America Video-on-Demand Market Volume (K Unit), by Country 2024 & 2032
  21. Figure 21: North America Video-on-Demand Market Revenue Share (%), by Country 2024 & 2032
  22. Figure 22: North America Video-on-Demand Market Volume Share (%), by Country 2024 & 2032
  23. Figure 23: MEA Video-on-Demand Market Revenue (Million), by Country 2024 & 2032
  24. Figure 24: MEA Video-on-Demand Market Volume (K Unit), by Country 2024 & 2032
  25. Figure 25: MEA Video-on-Demand Market Revenue Share (%), by Country 2024 & 2032
  26. Figure 26: MEA Video-on-Demand Market Volume Share (%), by Country 2024 & 2032
  27. Figure 27: North America Video-on-Demand Market Revenue (Million), by Business Model 2024 & 2032
  28. Figure 28: North America Video-on-Demand Market Volume (K Unit), by Business Model 2024 & 2032
  29. Figure 29: North America Video-on-Demand Market Revenue Share (%), by Business Model 2024 & 2032
  30. Figure 30: North America Video-on-Demand Market Volume Share (%), by Business Model 2024 & 2032
  31. Figure 31: North America Video-on-Demand Market Revenue (Million), by End-User 2024 & 2032
  32. Figure 32: North America Video-on-Demand Market Volume (K Unit), by End-User 2024 & 2032
  33. Figure 33: North America Video-on-Demand Market Revenue Share (%), by End-User 2024 & 2032
  34. Figure 34: North America Video-on-Demand Market Volume Share (%), by End-User 2024 & 2032
  35. Figure 35: North America Video-on-Demand Market Revenue (Million), by Device Type 2024 & 2032
  36. Figure 36: North America Video-on-Demand Market Volume (K Unit), by Device Type 2024 & 2032
  37. Figure 37: North America Video-on-Demand Market Revenue Share (%), by Device Type 2024 & 2032
  38. Figure 38: North America Video-on-Demand Market Volume Share (%), by Device Type 2024 & 2032
  39. Figure 39: North America Video-on-Demand Market Revenue (Million), by Content Type 2024 & 2032
  40. Figure 40: North America Video-on-Demand Market Volume (K Unit), by Content Type 2024 & 2032
  41. Figure 41: North America Video-on-Demand Market Revenue Share (%), by Content Type 2024 & 2032
  42. Figure 42: North America Video-on-Demand Market Volume Share (%), by Content Type 2024 & 2032
  43. Figure 43: North America Video-on-Demand Market Revenue (Million), by Country 2024 & 2032
  44. Figure 44: North America Video-on-Demand Market Volume (K Unit), by Country 2024 & 2032
  45. Figure 45: North America Video-on-Demand Market Revenue Share (%), by Country 2024 & 2032
  46. Figure 46: North America Video-on-Demand Market Volume Share (%), by Country 2024 & 2032
  47. Figure 47: Europe Video-on-Demand Market Revenue (Million), by Business Model 2024 & 2032
  48. Figure 48: Europe Video-on-Demand Market Volume (K Unit), by Business Model 2024 & 2032
  49. Figure 49: Europe Video-on-Demand Market Revenue Share (%), by Business Model 2024 & 2032
  50. Figure 50: Europe Video-on-Demand Market Volume Share (%), by Business Model 2024 & 2032
  51. Figure 51: Europe Video-on-Demand Market Revenue (Million), by End-User 2024 & 2032
  52. Figure 52: Europe Video-on-Demand Market Volume (K Unit), by End-User 2024 & 2032
  53. Figure 53: Europe Video-on-Demand Market Revenue Share (%), by End-User 2024 & 2032
  54. Figure 54: Europe Video-on-Demand Market Volume Share (%), by End-User 2024 & 2032
  55. Figure 55: Europe Video-on-Demand Market Revenue (Million), by Device Type 2024 & 2032
  56. Figure 56: Europe Video-on-Demand Market Volume (K Unit), by Device Type 2024 & 2032
  57. Figure 57: Europe Video-on-Demand Market Revenue Share (%), by Device Type 2024 & 2032
  58. Figure 58: Europe Video-on-Demand Market Volume Share (%), by Device Type 2024 & 2032
  59. Figure 59: Europe Video-on-Demand Market Revenue (Million), by Content Type 2024 & 2032
  60. Figure 60: Europe Video-on-Demand Market Volume (K Unit), by Content Type 2024 & 2032
  61. Figure 61: Europe Video-on-Demand Market Revenue Share (%), by Content Type 2024 & 2032
  62. Figure 62: Europe Video-on-Demand Market Volume Share (%), by Content Type 2024 & 2032
  63. Figure 63: Europe Video-on-Demand Market Revenue (Million), by Country 2024 & 2032
  64. Figure 64: Europe Video-on-Demand Market Volume (K Unit), by Country 2024 & 2032
  65. Figure 65: Europe Video-on-Demand Market Revenue Share (%), by Country 2024 & 2032
  66. Figure 66: Europe Video-on-Demand Market Volume Share (%), by Country 2024 & 2032
  67. Figure 67: Asia Pacific Video-on-Demand Market Revenue (Million), by Business Model 2024 & 2032
  68. Figure 68: Asia Pacific Video-on-Demand Market Volume (K Unit), by Business Model 2024 & 2032
  69. Figure 69: Asia Pacific Video-on-Demand Market Revenue Share (%), by Business Model 2024 & 2032
  70. Figure 70: Asia Pacific Video-on-Demand Market Volume Share (%), by Business Model 2024 & 2032
  71. Figure 71: Asia Pacific Video-on-Demand Market Revenue (Million), by End-User 2024 & 2032
  72. Figure 72: Asia Pacific Video-on-Demand Market Volume (K Unit), by End-User 2024 & 2032
  73. Figure 73: Asia Pacific Video-on-Demand Market Revenue Share (%), by End-User 2024 & 2032
  74. Figure 74: Asia Pacific Video-on-Demand Market Volume Share (%), by End-User 2024 & 2032
  75. Figure 75: Asia Pacific Video-on-Demand Market Revenue (Million), by Device Type 2024 & 2032
  76. Figure 76: Asia Pacific Video-on-Demand Market Volume (K Unit), by Device Type 2024 & 2032
  77. Figure 77: Asia Pacific Video-on-Demand Market Revenue Share (%), by Device Type 2024 & 2032
  78. Figure 78: Asia Pacific Video-on-Demand Market Volume Share (%), by Device Type 2024 & 2032
  79. Figure 79: Asia Pacific Video-on-Demand Market Revenue (Million), by Content Type 2024 & 2032
  80. Figure 80: Asia Pacific Video-on-Demand Market Volume (K Unit), by Content Type 2024 & 2032
  81. Figure 81: Asia Pacific Video-on-Demand Market Revenue Share (%), by Content Type 2024 & 2032
  82. Figure 82: Asia Pacific Video-on-Demand Market Volume Share (%), by Content Type 2024 & 2032
  83. Figure 83: Asia Pacific Video-on-Demand Market Revenue (Million), by Country 2024 & 2032
  84. Figure 84: Asia Pacific Video-on-Demand Market Volume (K Unit), by Country 2024 & 2032
  85. Figure 85: Asia Pacific Video-on-Demand Market Revenue Share (%), by Country 2024 & 2032
  86. Figure 86: Asia Pacific Video-on-Demand Market Volume Share (%), by Country 2024 & 2032
  87. Figure 87: Middle East and Africa Video-on-Demand Market Revenue (Million), by Business Model 2024 & 2032
  88. Figure 88: Middle East and Africa Video-on-Demand Market Volume (K Unit), by Business Model 2024 & 2032
  89. Figure 89: Middle East and Africa Video-on-Demand Market Revenue Share (%), by Business Model 2024 & 2032
  90. Figure 90: Middle East and Africa Video-on-Demand Market Volume Share (%), by Business Model 2024 & 2032
  91. Figure 91: Middle East and Africa Video-on-Demand Market Revenue (Million), by End-User 2024 & 2032
  92. Figure 92: Middle East and Africa Video-on-Demand Market Volume (K Unit), by End-User 2024 & 2032
  93. Figure 93: Middle East and Africa Video-on-Demand Market Revenue Share (%), by End-User 2024 & 2032
  94. Figure 94: Middle East and Africa Video-on-Demand Market Volume Share (%), by End-User 2024 & 2032
  95. Figure 95: Middle East and Africa Video-on-Demand Market Revenue (Million), by Device Type 2024 & 2032
  96. Figure 96: Middle East and Africa Video-on-Demand Market Volume (K Unit), by Device Type 2024 & 2032
  97. Figure 97: Middle East and Africa Video-on-Demand Market Revenue Share (%), by Device Type 2024 & 2032
  98. Figure 98: Middle East and Africa Video-on-Demand Market Volume Share (%), by Device Type 2024 & 2032
  99. Figure 99: Middle East and Africa Video-on-Demand Market Revenue (Million), by Content Type 2024 & 2032
  100. Figure 100: Middle East and Africa Video-on-Demand Market Volume (K Unit), by Content Type 2024 & 2032
  101. Figure 101: Middle East and Africa Video-on-Demand Market Revenue Share (%), by Content Type 2024 & 2032
  102. Figure 102: Middle East and Africa Video-on-Demand Market Volume Share (%), by Content Type 2024 & 2032
  103. Figure 103: Middle East and Africa Video-on-Demand Market Revenue (Million), by Country 2024 & 2032
  104. Figure 104: Middle East and Africa Video-on-Demand Market Volume (K Unit), by Country 2024 & 2032
  105. Figure 105: Middle East and Africa Video-on-Demand Market Revenue Share (%), by Country 2024 & 2032
  106. Figure 106: Middle East and Africa Video-on-Demand Market Volume Share (%), by Country 2024 & 2032
  107. Figure 107: Rest of the World Video-on-Demand Market Revenue (Million), by Business Model 2024 & 2032
  108. Figure 108: Rest of the World Video-on-Demand Market Volume (K Unit), by Business Model 2024 & 2032
  109. Figure 109: Rest of the World Video-on-Demand Market Revenue Share (%), by Business Model 2024 & 2032
  110. Figure 110: Rest of the World Video-on-Demand Market Volume Share (%), by Business Model 2024 & 2032
  111. Figure 111: Rest of the World Video-on-Demand Market Revenue (Million), by End-User 2024 & 2032
  112. Figure 112: Rest of the World Video-on-Demand Market Volume (K Unit), by End-User 2024 & 2032
  113. Figure 113: Rest of the World Video-on-Demand Market Revenue Share (%), by End-User 2024 & 2032
  114. Figure 114: Rest of the World Video-on-Demand Market Volume Share (%), by End-User 2024 & 2032
  115. Figure 115: Rest of the World Video-on-Demand Market Revenue (Million), by Device Type 2024 & 2032
  116. Figure 116: Rest of the World Video-on-Demand Market Volume (K Unit), by Device Type 2024 & 2032
  117. Figure 117: Rest of the World Video-on-Demand Market Revenue Share (%), by Device Type 2024 & 2032
  118. Figure 118: Rest of the World Video-on-Demand Market Volume Share (%), by Device Type 2024 & 2032
  119. Figure 119: Rest of the World Video-on-Demand Market Revenue (Million), by Content Type 2024 & 2032
  120. Figure 120: Rest of the World Video-on-Demand Market Volume (K Unit), by Content Type 2024 & 2032
  121. Figure 121: Rest of the World Video-on-Demand Market Revenue Share (%), by Content Type 2024 & 2032
  122. Figure 122: Rest of the World Video-on-Demand Market Volume Share (%), by Content Type 2024 & 2032
  123. Figure 123: Rest of the World Video-on-Demand Market Revenue (Million), by Country 2024 & 2032
  124. Figure 124: Rest of the World Video-on-Demand Market Volume (K Unit), by Country 2024 & 2032
  125. Figure 125: Rest of the World Video-on-Demand Market Revenue Share (%), by Country 2024 & 2032
  126. Figure 126: Rest of the World Video-on-Demand Market Volume Share (%), by Country 2024 & 2032

List of Tables

  1. Table 1: Global Video-on-Demand Market Revenue Million Forecast, by Region 2019 & 2032
  2. Table 2: Global Video-on-Demand Market Volume K Unit Forecast, by Region 2019 & 2032
  3. Table 3: Global Video-on-Demand Market Revenue Million Forecast, by Business Model 2019 & 2032
  4. Table 4: Global Video-on-Demand Market Volume K Unit Forecast, by Business Model 2019 & 2032
  5. Table 5: Global Video-on-Demand Market Revenue Million Forecast, by End-User 2019 & 2032
  6. Table 6: Global Video-on-Demand Market Volume K Unit Forecast, by End-User 2019 & 2032
  7. Table 7: Global Video-on-Demand Market Revenue Million Forecast, by Device Type 2019 & 2032
  8. Table 8: Global Video-on-Demand Market Volume K Unit Forecast, by Device Type 2019 & 2032
  9. Table 9: Global Video-on-Demand Market Revenue Million Forecast, by Content Type 2019 & 2032
  10. Table 10: Global Video-on-Demand Market Volume K Unit Forecast, by Content Type 2019 & 2032
  11. Table 11: Global Video-on-Demand Market Revenue Million Forecast, by Region 2019 & 2032
  12. Table 12: Global Video-on-Demand Market Volume K Unit Forecast, by Region 2019 & 2032
  13. Table 13: Global Video-on-Demand Market Revenue Million Forecast, by Country 2019 & 2032
  14. Table 14: Global Video-on-Demand Market Volume K Unit Forecast, by Country 2019 & 2032
  15. Table 15: United States Video-on-Demand Market Revenue (Million) Forecast, by Application 2019 & 2032
  16. Table 16: United States Video-on-Demand Market Volume (K Unit) Forecast, by Application 2019 & 2032
  17. Table 17: Canada Video-on-Demand Market Revenue (Million) Forecast, by Application 2019 & 2032
  18. Table 18: Canada Video-on-Demand Market Volume (K Unit) Forecast, by Application 2019 & 2032
  19. Table 19: Mexico Video-on-Demand Market Revenue (Million) Forecast, by Application 2019 & 2032
  20. Table 20: Mexico Video-on-Demand Market Volume (K Unit) Forecast, by Application 2019 & 2032
  21. Table 21: Global Video-on-Demand Market Revenue Million Forecast, by Country 2019 & 2032
  22. Table 22: Global Video-on-Demand Market Volume K Unit Forecast, by Country 2019 & 2032
  23. Table 23: Germany Video-on-Demand Market Revenue (Million) Forecast, by Application 2019 & 2032
  24. Table 24: Germany Video-on-Demand Market Volume (K Unit) Forecast, by Application 2019 & 2032
  25. Table 25: United Kingdom Video-on-Demand Market Revenue (Million) Forecast, by Application 2019 & 2032
  26. Table 26: United Kingdom Video-on-Demand Market Volume (K Unit) Forecast, by Application 2019 & 2032
  27. Table 27: France Video-on-Demand Market Revenue (Million) Forecast, by Application 2019 & 2032
  28. Table 28: France Video-on-Demand Market Volume (K Unit) Forecast, by Application 2019 & 2032
  29. Table 29: Spain Video-on-Demand Market Revenue (Million) Forecast, by Application 2019 & 2032
  30. Table 30: Spain Video-on-Demand Market Volume (K Unit) Forecast, by Application 2019 & 2032
  31. Table 31: Italy Video-on-Demand Market Revenue (Million) Forecast, by Application 2019 & 2032
  32. Table 32: Italy Video-on-Demand Market Volume (K Unit) Forecast, by Application 2019 & 2032
  33. Table 33: Spain Video-on-Demand Market Revenue (Million) Forecast, by Application 2019 & 2032
  34. Table 34: Spain Video-on-Demand Market Volume (K Unit) Forecast, by Application 2019 & 2032
  35. Table 35: Belgium Video-on-Demand Market Revenue (Million) Forecast, by Application 2019 & 2032
  36. Table 36: Belgium Video-on-Demand Market Volume (K Unit) Forecast, by Application 2019 & 2032
  37. Table 37: Netherland Video-on-Demand Market Revenue (Million) Forecast, by Application 2019 & 2032
  38. Table 38: Netherland Video-on-Demand Market Volume (K Unit) Forecast, by Application 2019 & 2032
  39. Table 39: Nordics Video-on-Demand Market Revenue (Million) Forecast, by Application 2019 & 2032
  40. Table 40: Nordics Video-on-Demand Market Volume (K Unit) Forecast, by Application 2019 & 2032
  41. Table 41: Rest of Europe Video-on-Demand Market Revenue (Million) Forecast, by Application 2019 & 2032
  42. Table 42: Rest of Europe Video-on-Demand Market Volume (K Unit) Forecast, by Application 2019 & 2032
  43. Table 43: Global Video-on-Demand Market Revenue Million Forecast, by Country 2019 & 2032
  44. Table 44: Global Video-on-Demand Market Volume K Unit Forecast, by Country 2019 & 2032
  45. Table 45: China Video-on-Demand Market Revenue (Million) Forecast, by Application 2019 & 2032
  46. Table 46: China Video-on-Demand Market Volume (K Unit) Forecast, by Application 2019 & 2032
  47. Table 47: Japan Video-on-Demand Market Revenue (Million) Forecast, by Application 2019 & 2032
  48. Table 48: Japan Video-on-Demand Market Volume (K Unit) Forecast, by Application 2019 & 2032
  49. Table 49: India Video-on-Demand Market Revenue (Million) Forecast, by Application 2019 & 2032
  50. Table 50: India Video-on-Demand Market Volume (K Unit) Forecast, by Application 2019 & 2032
  51. Table 51: South Korea Video-on-Demand Market Revenue (Million) Forecast, by Application 2019 & 2032
  52. Table 52: South Korea Video-on-Demand Market Volume (K Unit) Forecast, by Application 2019 & 2032
  53. Table 53: Southeast Asia Video-on-Demand Market Revenue (Million) Forecast, by Application 2019 & 2032
  54. Table 54: Southeast Asia Video-on-Demand Market Volume (K Unit) Forecast, by Application 2019 & 2032
  55. Table 55: Australia Video-on-Demand Market Revenue (Million) Forecast, by Application 2019 & 2032
  56. Table 56: Australia Video-on-Demand Market Volume (K Unit) Forecast, by Application 2019 & 2032
  57. Table 57: Indonesia Video-on-Demand Market Revenue (Million) Forecast, by Application 2019 & 2032
  58. Table 58: Indonesia Video-on-Demand Market Volume (K Unit) Forecast, by Application 2019 & 2032
  59. Table 59: Phillipes Video-on-Demand Market Revenue (Million) Forecast, by Application 2019 & 2032
  60. Table 60: Phillipes Video-on-Demand Market Volume (K Unit) Forecast, by Application 2019 & 2032
  61. Table 61: Singapore Video-on-Demand Market Revenue (Million) Forecast, by Application 2019 & 2032
  62. Table 62: Singapore Video-on-Demand Market Volume (K Unit) Forecast, by Application 2019 & 2032
  63. Table 63: Thailandc Video-on-Demand Market Revenue (Million) Forecast, by Application 2019 & 2032
  64. Table 64: Thailandc Video-on-Demand Market Volume (K Unit) Forecast, by Application 2019 & 2032
  65. Table 65: Rest of Asia Pacific Video-on-Demand Market Revenue (Million) Forecast, by Application 2019 & 2032
  66. Table 66: Rest of Asia Pacific Video-on-Demand Market Volume (K Unit) Forecast, by Application 2019 & 2032
  67. Table 67: Global Video-on-Demand Market Revenue Million Forecast, by Country 2019 & 2032
  68. Table 68: Global Video-on-Demand Market Volume K Unit Forecast, by Country 2019 & 2032
  69. Table 69: Brazil Video-on-Demand Market Revenue (Million) Forecast, by Application 2019 & 2032
  70. Table 70: Brazil Video-on-Demand Market Volume (K Unit) Forecast, by Application 2019 & 2032
  71. Table 71: Argentina Video-on-Demand Market Revenue (Million) Forecast, by Application 2019 & 2032
  72. Table 72: Argentina Video-on-Demand Market Volume (K Unit) Forecast, by Application 2019 & 2032
  73. Table 73: Peru Video-on-Demand Market Revenue (Million) Forecast, by Application 2019 & 2032
  74. Table 74: Peru Video-on-Demand Market Volume (K Unit) Forecast, by Application 2019 & 2032
  75. Table 75: Chile Video-on-Demand Market Revenue (Million) Forecast, by Application 2019 & 2032
  76. Table 76: Chile Video-on-Demand Market Volume (K Unit) Forecast, by Application 2019 & 2032
  77. Table 77: Colombia Video-on-Demand Market Revenue (Million) Forecast, by Application 2019 & 2032
  78. Table 78: Colombia Video-on-Demand Market Volume (K Unit) Forecast, by Application 2019 & 2032
  79. Table 79: Ecuador Video-on-Demand Market Revenue (Million) Forecast, by Application 2019 & 2032
  80. Table 80: Ecuador Video-on-Demand Market Volume (K Unit) Forecast, by Application 2019 & 2032
  81. Table 81: Venezuela Video-on-Demand Market Revenue (Million) Forecast, by Application 2019 & 2032
  82. Table 82: Venezuela Video-on-Demand Market Volume (K Unit) Forecast, by Application 2019 & 2032
  83. Table 83: Rest of South America Video-on-Demand Market Revenue (Million) Forecast, by Application 2019 & 2032
  84. Table 84: Rest of South America Video-on-Demand Market Volume (K Unit) Forecast, by Application 2019 & 2032
  85. Table 85: Global Video-on-Demand Market Revenue Million Forecast, by Country 2019 & 2032
  86. Table 86: Global Video-on-Demand Market Volume K Unit Forecast, by Country 2019 & 2032
  87. Table 87: United States Video-on-Demand Market Revenue (Million) Forecast, by Application 2019 & 2032
  88. Table 88: United States Video-on-Demand Market Volume (K Unit) Forecast, by Application 2019 & 2032
  89. Table 89: Canada Video-on-Demand Market Revenue (Million) Forecast, by Application 2019 & 2032
  90. Table 90: Canada Video-on-Demand Market Volume (K Unit) Forecast, by Application 2019 & 2032
  91. Table 91: Mexico Video-on-Demand Market Revenue (Million) Forecast, by Application 2019 & 2032
  92. Table 92: Mexico Video-on-Demand Market Volume (K Unit) Forecast, by Application 2019 & 2032
  93. Table 93: Global Video-on-Demand Market Revenue Million Forecast, by Country 2019 & 2032
  94. Table 94: Global Video-on-Demand Market Volume K Unit Forecast, by Country 2019 & 2032
  95. Table 95: United Arab Emirates Video-on-Demand Market Revenue (Million) Forecast, by Application 2019 & 2032
  96. Table 96: United Arab Emirates Video-on-Demand Market Volume (K Unit) Forecast, by Application 2019 & 2032
  97. Table 97: Saudi Arabia Video-on-Demand Market Revenue (Million) Forecast, by Application 2019 & 2032
  98. Table 98: Saudi Arabia Video-on-Demand Market Volume (K Unit) Forecast, by Application 2019 & 2032
  99. Table 99: South Africa Video-on-Demand Market Revenue (Million) Forecast, by Application 2019 & 2032
  100. Table 100: South Africa Video-on-Demand Market Volume (K Unit) Forecast, by Application 2019 & 2032
  101. Table 101: Rest of Middle East and Africa Video-on-Demand Market Revenue (Million) Forecast, by Application 2019 & 2032
  102. Table 102: Rest of Middle East and Africa Video-on-Demand Market Volume (K Unit) Forecast, by Application 2019 & 2032
  103. Table 103: Global Video-on-Demand Market Revenue Million Forecast, by Business Model 2019 & 2032
  104. Table 104: Global Video-on-Demand Market Volume K Unit Forecast, by Business Model 2019 & 2032
  105. Table 105: Global Video-on-Demand Market Revenue Million Forecast, by End-User 2019 & 2032
  106. Table 106: Global Video-on-Demand Market Volume K Unit Forecast, by End-User 2019 & 2032
  107. Table 107: Global Video-on-Demand Market Revenue Million Forecast, by Device Type 2019 & 2032
  108. Table 108: Global Video-on-Demand Market Volume K Unit Forecast, by Device Type 2019 & 2032
  109. Table 109: Global Video-on-Demand Market Revenue Million Forecast, by Content Type 2019 & 2032
  110. Table 110: Global Video-on-Demand Market Volume K Unit Forecast, by Content Type 2019 & 2032
  111. Table 111: Global Video-on-Demand Market Revenue Million Forecast, by Country 2019 & 2032
  112. Table 112: Global Video-on-Demand Market Volume K Unit Forecast, by Country 2019 & 2032
  113. Table 113: Global Video-on-Demand Market Revenue Million Forecast, by Business Model 2019 & 2032
  114. Table 114: Global Video-on-Demand Market Volume K Unit Forecast, by Business Model 2019 & 2032
  115. Table 115: Global Video-on-Demand Market Revenue Million Forecast, by End-User 2019 & 2032
  116. Table 116: Global Video-on-Demand Market Volume K Unit Forecast, by End-User 2019 & 2032
  117. Table 117: Global Video-on-Demand Market Revenue Million Forecast, by Device Type 2019 & 2032
  118. Table 118: Global Video-on-Demand Market Volume K Unit Forecast, by Device Type 2019 & 2032
  119. Table 119: Global Video-on-Demand Market Revenue Million Forecast, by Content Type 2019 & 2032
  120. Table 120: Global Video-on-Demand Market Volume K Unit Forecast, by Content Type 2019 & 2032
  121. Table 121: Global Video-on-Demand Market Revenue Million Forecast, by Country 2019 & 2032
  122. Table 122: Global Video-on-Demand Market Volume K Unit Forecast, by Country 2019 & 2032
  123. Table 123: Global Video-on-Demand Market Revenue Million Forecast, by Business Model 2019 & 2032
  124. Table 124: Global Video-on-Demand Market Volume K Unit Forecast, by Business Model 2019 & 2032
  125. Table 125: Global Video-on-Demand Market Revenue Million Forecast, by End-User 2019 & 2032
  126. Table 126: Global Video-on-Demand Market Volume K Unit Forecast, by End-User 2019 & 2032
  127. Table 127: Global Video-on-Demand Market Revenue Million Forecast, by Device Type 2019 & 2032
  128. Table 128: Global Video-on-Demand Market Volume K Unit Forecast, by Device Type 2019 & 2032
  129. Table 129: Global Video-on-Demand Market Revenue Million Forecast, by Content Type 2019 & 2032
  130. Table 130: Global Video-on-Demand Market Volume K Unit Forecast, by Content Type 2019 & 2032
  131. Table 131: Global Video-on-Demand Market Revenue Million Forecast, by Country 2019 & 2032
  132. Table 132: Global Video-on-Demand Market Volume K Unit Forecast, by Country 2019 & 2032
  133. Table 133: Global Video-on-Demand Market Revenue Million Forecast, by Business Model 2019 & 2032
  134. Table 134: Global Video-on-Demand Market Volume K Unit Forecast, by Business Model 2019 & 2032
  135. Table 135: Global Video-on-Demand Market Revenue Million Forecast, by End-User 2019 & 2032
  136. Table 136: Global Video-on-Demand Market Volume K Unit Forecast, by End-User 2019 & 2032
  137. Table 137: Global Video-on-Demand Market Revenue Million Forecast, by Device Type 2019 & 2032
  138. Table 138: Global Video-on-Demand Market Volume K Unit Forecast, by Device Type 2019 & 2032
  139. Table 139: Global Video-on-Demand Market Revenue Million Forecast, by Content Type 2019 & 2032
  140. Table 140: Global Video-on-Demand Market Volume K Unit Forecast, by Content Type 2019 & 2032
  141. Table 141: Global Video-on-Demand Market Revenue Million Forecast, by Country 2019 & 2032
  142. Table 142: Global Video-on-Demand Market Volume K Unit Forecast, by Country 2019 & 2032
  143. Table 143: Global Video-on-Demand Market Revenue Million Forecast, by Business Model 2019 & 2032
  144. Table 144: Global Video-on-Demand Market Volume K Unit Forecast, by Business Model 2019 & 2032
  145. Table 145: Global Video-on-Demand Market Revenue Million Forecast, by End-User 2019 & 2032
  146. Table 146: Global Video-on-Demand Market Volume K Unit Forecast, by End-User 2019 & 2032
  147. Table 147: Global Video-on-Demand Market Revenue Million Forecast, by Device Type 2019 & 2032
  148. Table 148: Global Video-on-Demand Market Volume K Unit Forecast, by Device Type 2019 & 2032
  149. Table 149: Global Video-on-Demand Market Revenue Million Forecast, by Content Type 2019 & 2032
  150. Table 150: Global Video-on-Demand Market Volume K Unit Forecast, by Content Type 2019 & 2032
  151. Table 151: Global Video-on-Demand Market Revenue Million Forecast, by Country 2019 & 2032
  152. Table 152: Global Video-on-Demand Market Volume K Unit Forecast, by Country 2019 & 2032


Frequently Asked Questions

1. What is the projected Compound Annual Growth Rate (CAGR) of the Video-on-Demand Market?

The projected CAGR is approximately 10.66%.

2. Which companies are prominent players in the Video-on-Demand Market?

Key companies in the market include Edgio, Comcast Xfinity, Fandango Media LLC (Vudu), Midwest Tape LLC (Hoopla Digital), Netflix Inc, DirecTV, Vubiquity Inc, The Walt Disney Company (Disney+), DISH Network LLC, Dacast Inc, Wistia Inc , Warner Bros Discovery Inc, Novi Digital Entertainment Private Limited (Hotstar), Hulu LLC, Fujitsu, Amazon com Inc (Amazon Prime Video), Kaltura, Popcornflix LLC, Apple Inc, Zee Entertainment Enterprises Ltd (Zee5).

3. What are the main segments of the Video-on-Demand Market?

The market segments include Business Model, End-User, Device Type, Content Type.

4. Can you provide details about the market size?

The market size is estimated to be USD 115.55 Million as of 2022.

5. What are some drivers contributing to market growth?

Developments in Digital Video Landscape; Surge in Mobile Based Internet Users.

6. What are the notable trends driving market growth?

Surge in Mobile-based Internet Users to Drive the Market.

7. Are there any restraints impacting market growth?

Growing Threat of Video Content Piracy.

8. Can you provide examples of recent developments in the market?

January 2023: FOX Entertainment and Hulu have announced a multi-year content partnership that includes in-season streaming rights for FOX's extensive programming schedule and a multi-platform strategic marketing alliance. All FOX primetime entertainment programming, from Family Guy and The Cleaning Lady to The Masked Singer and Next Level Chef, are expected to continue to stream on Hulu the day after its linear telecast, according to the terms of the agreement. Furthermore, the agreement includes a significant alliance in which FOX and Hulu branding will coexist across all FOX-owned and external marketing touchpoints to align FOX content's live and on-demand viewing messaging.

9. What pricing options are available for accessing the report?

Pricing options include single-user, multi-user, and enterprise licenses priced at USD 4750, USD 5250, and USD 8750 respectively.

10. Is the market size provided in terms of value or volume?

The market size is provided in terms of value, measured in Million and volume, measured in K Unit.

11. Are there any specific market keywords associated with the report?

Yes, the market keyword associated with the report is "Video-on-Demand Market," which aids in identifying and referencing the specific market segment covered.

12. How do I determine which pricing option suits my needs best?

The pricing options vary based on user requirements and access needs. Individual users may opt for single-user licenses, while businesses requiring broader access may choose multi-user or enterprise licenses for cost-effective access to the report.

13. Are there any additional resources or data provided in the Video-on-Demand Market report?

While the report offers comprehensive insights, it's advisable to review the specific contents or supplementary materials provided to ascertain if additional resources or data are available.

14. How can I stay updated on further developments or reports in the Video-on-Demand Market?

To stay informed about further developments, trends, and reports in the Video-on-Demand Market, consider subscribing to industry newsletters, following relevant companies and organizations, or regularly checking reputable industry news sources and publications.


Methodology

Step 1 - Identification of Relevant Samples Size from Population Database

Step Chart
Bar Chart
Method Chart

Step 2 - Approaches for Defining Global Market Size (Value, Volume* & Price*)

Approach Chart
Top-down and bottom-up approaches are used to validate the global market size and estimate the market size for manufactures, regional segments, product, and application.

Note*: In applicable scenarios

Step 3 - Data Sources

Primary Research

  • Web Analytics
  • Survey Reports
  • Research Institute
  • Latest Research Reports
  • Opinion Leaders

Secondary Research

  • Annual Reports
  • White Paper
  • Latest Press Release
  • Industry Association
  • Paid Database
  • Investor Presentations
Analyst Chart

Step 4 - Data Triangulation

Involves using different sources of information in order to increase the validity of a study

These sources are likely to be stakeholders in a program - participants, other researchers, program staff, other community members, and so on.

Then we put all data in single framework & apply various statistical tools to find out the dynamic on the market.

During the analysis stage, feedback from the stakeholder groups would be compared to determine areas of agreement as well as areas of divergence

Additionally, after gathering mixed and scattered data from a wide range of sources, data is triangulated and correlated to come up with estimated figures which are further validated through primary mediums or industry experts, opinion leaders.

About Report Pinnacle

Report Pinnacle provides top-tier market research, industry intelligence, and actionable insights for finance, technology, healthcare, and consumer sectors. Our reports empower you to make informed decisions and achieve business success.

Our expert team combines primary research, data analytics, and industry knowledge to deliver insights you can trust. We offer syndicated reports, custom research, and consulting services tailored to your unique business needs.

At Report Pinnacle, we are committed to quality, transparency, and client satisfaction. Every report is rigorously validated to ensure accuracy and relevance. Our global perspective and local expertise help you understand both broad trends and detailed market shifts.

Stay ahead with Report Pinnacle. Subscribe to our newsletter for the latest insights and research highlights, and follow us on social media for real-time updates.

Report Pinnacle – Your Partner for Reaching the Top in Market Intelligence.

artwork spiralartwork spiralRelated Reports
artwork underline

LA LED Packaging Market CAGR Growth Drivers and Trends: Forecasts 2025-2033

Discover the booming LA LED Packaging market! This in-depth analysis reveals a CAGR of 5.30% through 2033, driven by energy-efficient lighting & smart technology. Explore market size, key players (Samsung, Osram, etc.), regional trends, and future growth projections.

September 2025
Base Year: 2024
No Of Pages: 210
Price: $4750

India Wire And Cable Market Market’s Growth Catalysts

Discover the booming India wire and cable market! This in-depth analysis reveals a ₹19.44 billion market (2025) projected to grow at a 9.14% CAGR until 2033, driven by construction, IT, and energy sectors. Explore key players, regional trends, and future opportunities in this comprehensive report.

September 2025
Base Year: 2024
No Of Pages: 197
Price: $3800

Exploring Growth Avenues in Global Discount-Marine Trenchers Market Market

Discover the booming global marine trenchers market! This in-depth analysis reveals a CAGR exceeding 3%, driven by offshore energy infrastructure expansion and technological advancements. Explore market segments, key players (SMD, Osbit, etc.), and regional trends in this comprehensive report. Learn how to capitalize on this lucrative opportunity.

September 2025
Base Year: 2024
No Of Pages: 234
Price: $4750

Exploring Growth Avenues in Graphic Design Market Market

The global graphic design market is booming, projected to reach \$[estimated 2033 value] by 2033, with a CAGR of 5.89%. Discover key trends, market segments (logo design, app design, etc.), top companies, and regional insights in this comprehensive market analysis.

September 2025
Base Year: 2024
No Of Pages: 234
Price: $4750

Freight Transport Management Market Insights: Growth at XX CAGR Through 2033

The Freight Transport Management market is booming, projected to reach $29.11 billion by 2025 with a 9.70% CAGR. Discover key trends, drivers, and regional insights in this comprehensive market analysis covering solutions, deployment models, and end-user industries. Learn about leading companies shaping this dynamic sector.

September 2025
Base Year: 2024
No Of Pages: 234
Price: $4750

Future Prospects for Africa Data Center Market Growth

Discover the booming African data center market! This comprehensive analysis reveals a 21.06% CAGR, driven by cloud adoption, FinTech growth, and government initiatives. Explore market size, key players (Equinix, Raxio, Teraco), regional trends (Nigeria, South Africa, Egypt), and future projections. Invest wisely in this rapidly expanding sector.

September 2025
Base Year: 2024
No Of Pages: 197
Price: $3800

Mobile Augmented Reality Market Market’s Evolution: Key Growth Drivers 2025-2033

The Mobile Augmented Reality (MAR) market is booming, projected to reach \$42.48 million in 2025 with a 42.36% CAGR. Discover key drivers, trends, and market segmentation across gaming, healthcare, retail, and more. Explore leading companies and regional insights in this comprehensive market analysis.

September 2025
Base Year: 2024
No Of Pages: 234
Price: $4750

Unlocking Growth in Europe Energy Management Systems Market Market 2025-2033

The European Energy Management Systems (EMS) market is booming, projected to reach €48.99 billion by 2033, with a CAGR of 14.57%. Driven by sustainability initiatives and rising energy costs, this report analyzes market trends, key players (Honeywell, Schneider Electric, etc.), and regional growth across the UK, Germany, France, and more. Discover the opportunities in BEMS, HEMS, and various distribution channels.

September 2025
Base Year: 2024
No Of Pages: 210
Price: $4750

Canada ICT Market in Emerging Markets: Analysis and Projections 2025-2033

Discover the booming Canadian ICT market! Explore its 7% CAGR, key drivers (cloud computing, AI, e-commerce), market segments (hardware, software, services), and leading companies. Get insights into market trends and future growth potential from 2025 to 2033.

September 2025
Base Year: 2024
No Of Pages: 197
Price: $3800

Regional Trends and Opportunities for Americas Optoelectronics Market Market

The Americas Optoelectronics Market is booming, projected to reach \$28.15 Billion by 2033, fueled by automotive, consumer electronics, and healthcare advancements. Explore market trends, key players (Vishay, OmniVision, Texas Instruments), and regional growth in North America and Latin America. Learn more about this high-growth sector!

September 2025
Base Year: 2024
No Of Pages: 234
Price: $4750

Outdoor LED Smart Lighting Solution Industry Strategic Insights: Analysis 2025 and Forecasts 2033

Discover the booming outdoor LED smart lighting market! Explore market size, CAGR, key drivers, trends, and regional analysis. Learn about top companies and future growth projections for this dynamic sector. Invest in the future of smart cities with our comprehensive market report.

September 2025
Base Year: 2024
No Of Pages: 197
Price: $3800

Reed Switch Sensor Market Future-proof Strategies: Trends, Competitor Dynamics, and Opportunities 2025-2033

The Reed Switch Sensor market is booming, projected to reach $XX million by 2033 with a 7.20% CAGR. Driven by automotive, consumer electronics, and industrial automation, this report analyzes market trends, key players (STG Germany, Littelfuse, etc.), and regional growth, offering valuable insights for investors and businesses.

September 2025
Base Year: 2024
No Of Pages: 234
Price: $4750

Exploring Regional Dynamics of Safety Programmable Controller Market Market 2025-2033

The Safety Programmable Controller (SPC) market is booming, projected to reach $XX million by 2033 with a CAGR of 6.5%. Discover key trends, drivers, restraints, and leading companies shaping this dynamic market across automotive, energy, and manufacturing sectors. Explore regional insights and future growth predictions in our comprehensive analysis.

September 2025
Base Year: 2024
No Of Pages: 234
Price: $4750

Norway Data Center Power Market Market’s Growth Blueprint

The Norway data center power market is booming, projected to reach $519.82 million by 2033 with an 8.90% CAGR. Driven by cloud computing and big data, this report analyzes market size, trends, restraints, segments (UPS systems, generators, power distribution), key players (ABB, Schneider Electric), and future forecasts. Discover insights for investment and strategic planning.

September 2025
Base Year: 2024
No Of Pages: 197
Price: $3800

E-commerce Market in Switzerland Unlocking Growth Potential: 2025-2033 Analysis and Forecasts

Discover the booming Swiss e-commerce market! Our analysis reveals a CHF 16.5 billion market in 2025, projected to grow at a 13.71% CAGR. Explore key trends, drivers, and top players shaping this dynamic sector. Learn more about market segmentation, regional breakdown, and future growth projections.

September 2025
Base Year: 2024
No Of Pages: 197
Price: $3800

Japan Data Center Power Market Analysis 2025-2033: Unlocking Competitive Opportunities

Discover the booming Japan Data Center Power market! This in-depth analysis reveals a $820 million market in 2025, projected to grow at a 5.27% CAGR through 2033. Explore key drivers, trends, and leading companies shaping this dynamic sector. Learn about the surging demand for UPS systems, generators, and power distribution solutions in IT, BFSI, and government sectors.

September 2025
Base Year: 2024
No Of Pages: 197
Price: $3800

Australia Switchgear Market Competitive Advantage: Trends and Opportunities to 2033

The Australian switchgear market is booming, projected to reach $2.296 billion by 2033, driven by renewable energy, smart grid development, and industrial growth. This in-depth analysis explores market size, CAGR, key players (ABB, Siemens, Schneider Electric), and future trends. Learn more about investment opportunities in this dynamic sector.

September 2025
Base Year: 2024
No Of Pages: 197
Price: $3800

Emerging Growth Patterns in Direct to Consumer Ecommerce Market in India Market

India's booming D2C e-commerce market is projected to reach \$272 Billion by 2033, fueled by a 34.5% CAGR. Discover key trends, leading brands (Nykaa, Boat, Licious), and regional insights in this comprehensive market analysis.

September 2025
Base Year: 2024
No Of Pages: 197
Price: $3800

South Korea MLCC Market Unlocking Growth Potential: Analysis and Forecasts 2025-2033

South Korea's booming MLCC market is projected to reach $XX million by 2025, growing at a CAGR of 5.91%. Discover key trends, market segmentation (dielectric type, case size, voltage, capacitance, mounting type, end-user), leading companies, and future growth forecasts for this dynamic sector.

September 2025
Base Year: 2024
No Of Pages: 197
Price: $3800

Navigating Latin America Consumer Electronic Industry Market Growth 2025-2033

Discover the booming Latin American consumer electronics market! Explore its 8.40% CAGR, key drivers (rising incomes, e-commerce), restraints, leading companies (Samsung, LG, Panasonic), and regional trends (Brazil, Mexico). Get insights into the 2025-2033 forecast for smartphones, TVs, appliances, and more.

September 2025
Base Year: 2024
No Of Pages: 210
Price: $4750

Future Prospects for Magnetic Sensor Market Growth

The magnetic sensor market is booming, projected to reach over $7 billion by 2033 with a CAGR of 7.91%. Driven by automotive, consumer electronics, and industrial applications, key players like Analog Devices and STMicroelectronics are leading the charge in this rapidly expanding sector. Explore market trends, segments (GMR, TMR, Hall Effect), and regional insights.

September 2025
Base Year: 2024
No Of Pages: 234
Price: $4750

Turkey Ecommerce Industry Market Overview: Trends and Strategic Forecasts 2025-2033

Discover the explosive growth of Turkey's e-commerce market, projected to reach [estimated 2033 market size in millions] by 2033 with a CAGR of 22.60%. This in-depth analysis reveals key drivers, trends, challenges, and top players shaping this dynamic sector, including Amazon, Trendyol, and Hepsiburada. Learn more about market segmentation and future growth potential.

September 2025
Base Year: 2024
No Of Pages: 197
Price: $3800

Nigeria Data Center Market Market Growth Fueled by CAGR to XXX Million by 2033

Nigeria's data center market is booming, with a 21.06% CAGR. This analysis explores market size, key drivers (digitalization, e-commerce), restraints, and leading companies like Africa Data Centers and MainOne. Discover the investment opportunities and growth trends in this dynamic sector.

September 2025
Base Year: 2024
No Of Pages: 197
Price: $3800

Saudi Arabia E-Commerce Market XX CAGR Growth to Drive Market Size to XXX Million by 2033

The Saudi Arabia e-commerce market is booming, projected to reach \$13.61 billion by 2025 with a 15.01% CAGR. Discover key drivers, trends, and challenges shaping this dynamic market, including leading companies and segment analysis. Explore the opportunities and future growth projections in this lucrative sector.

September 2025
Base Year: 2024
No Of Pages: 197
Price: $3800

Programmable Robotics Industry Insightful Market Analysis: Trends and Opportunities 2025-2033

Discover the booming programmable robotics market! This in-depth analysis reveals a CAGR of 9.66%, exploring key drivers, trends, and restraints from 2019-2033. Learn about market segmentation, leading companies, and regional growth projections in education, entertainment, and household applications. Get the data you need to understand this dynamic sector.

September 2025
Base Year: 2024
No Of Pages: 234
Price: $4750

Unveiling Cognitive Operations Market Growth Patterns: CAGR Analysis and Forecasts 2025-2033

The Cognitive Operations market is booming, projected to reach $17.59B in 2025 with a 16.38% CAGR. This report analyzes market drivers, trends, restraints, and key players like IBM & Splunk, covering segments like cloud deployment, application performance management, and key verticals. Discover growth opportunities in this rapidly expanding market.

September 2025
Base Year: 2024
No Of Pages: 234
Price: $4750

Enterprise Server Market Strategic Dynamics: Competitor Analysis 2025-2033

The enterprise server market is booming, projected to reach \$164.7 billion by 2033 with an 8.03% CAGR. This in-depth analysis explores key drivers, trends, restraints, and market segmentation across operating systems, server types, and end-user verticals. Learn about leading companies and regional market shares.

September 2025
Base Year: 2024
No Of Pages: 234
Price: $4750

France Fixed Wireless Access (FWA) Market Unlocking Growth Potential: Analysis and Forecasts 2025-2033

The France Fixed Wireless Access (FWA) market is booming, projected to reach €430 million in 2025 and grow at a CAGR of 29.48% until 2033. Driven by 5G advancements and government initiatives, this market offers significant opportunities for providers and investors. Learn more about market trends, key players, and future growth potential.

September 2025
Base Year: 2024
No Of Pages: 197
Price: $3800

Geospatial Data Analytics Market Market’s Consumer Landscape: Insights and Trends 2025-2033

The Geospatial Data Analytics market is booming, projected to reach $86.39 million in 2025, with a CAGR of 12.81% through 2033. Discover key drivers, trends, and regional insights in this comprehensive market analysis covering leading companies and applications in agriculture, defense, and more.

September 2025
Base Year: 2024
No Of Pages: 234
Price: $4750

Strategic Vision for Europe Alternating Current (AC) Motor Market Market Expansion

Discover the latest insights on the booming European AC Motor market. Our analysis reveals a CAGR of 4.20% through 2033, driven by automation, energy efficiency mandates, and renewable energy growth. Explore market size, segmentation, key players (ABB, Siemens, Nidec), and regional trends. Download the full report for a comprehensive overview.

September 2025
Base Year: 2024
No Of Pages: 210
Price: $4750

Hardware Wallet Market Market’s Drivers and Challenges: Strategic Overview 2025-2033

The hardware wallet market is booming, projected to reach $2.55 billion by 2033 with a CAGR of 28.79%. Driven by rising cryptocurrency adoption and security concerns, this in-depth analysis explores market trends, key players (Ledger, Trezor, etc.), and regional growth, offering valuable insights for investors and businesses.

September 2025
Base Year: 2024
No Of Pages: 234
Price: $4750

Strategic Growth Drivers for Mexico LED Lighting Market Market

Discover the booming Mexico LED lighting market! This comprehensive analysis reveals a $1.91B market (2025) with a 9.87% CAGR, driven by government initiatives and technological advancements. Explore market segments, key players, and future growth projections.

September 2025
Base Year: 2024
No Of Pages: 197
Price: $3800

NA Electric Drives Market to Grow at XX CAGR: Market Size Analysis and Forecasts 2025-2033

Discover the booming North American electric drives market! This comprehensive analysis reveals key trends, growth drivers, and market segmentation (AC, DC, Servo drives) from 2019-2033, highlighting leading companies like ABB, Rockwell, and Siemens. Explore the significant opportunities and challenges in oil & gas, chemical, and renewable energy sectors.

September 2025
Base Year: 2024
No Of Pages: 210
Price: $4750

Robotics in Construction Industry Comprehensive Market Study: Trends and Predictions 2025-2033

The Robotics in Construction market is booming, projected to reach \$383.11 million in 2025 and grow at a CAGR of 15.50% through 2033. Driven by labor shortages and technological advancements, this report analyzes market trends, key players (Dusty Robotics, Advanced Construction Robotics), and regional growth in demolition, bricklaying, 3D printing, and more. Discover the future of construction automation.

September 2025
Base Year: 2024
No Of Pages: 234
Price: $4750

Self-Serve Industry Report: Trends and Forecasts 2025-2033

The self-service industry is booming, projected to reach $38.22B in 2025 with a 7.79% CAGR. Explore market trends, key players (NCR, Diebold Nixdorf), and growth drivers in this comprehensive analysis of kiosks, ATMs, vending machines, and more across BFSI, retail, and other sectors.

September 2025
Base Year: 2024
No Of Pages: 234
Price: $4750

Exploring Key Dynamics of Non-Destructive Testing (NDT) Software Market Industry

The NDT Software Market is booming, projected to reach $0.63B in 2025 and grow at a CAGR of 11.10% through 2033. Driven by AI, automation, and increasing demand across industries like oil & gas and aerospace, this report analyzes market trends, key players (Baker Hughes, Zeiss, etc.), and regional growth. Discover the future of non-destructive testing software.

September 2025
Base Year: 2024
No Of Pages: 234
Price: $4750

Strategic Growth Drivers for France Outdoor LED Lighting Market Market

Discover the booming France Outdoor LED Lighting market! This in-depth analysis reveals a CAGR of 19.50% (2025-2033), driven by smart city initiatives and energy efficiency demands. Explore market size, key players (Signify, Thorn Lighting), and future trends.

September 2025
Base Year: 2024
No Of Pages: 197
Price: $3800

Aluminum Electrolytic Capacitor Market Trends and Forecast 2025-2033

The Aluminum Electrolytic Capacitor market is booming, projected to reach [estimated 2033 market size based on CAGR] by 2033. Driven by automotive and electronics growth, this report analyzes market size, CAGR, key players (TDK, Panasonic, Murata), and regional trends. Discover insights into high-voltage, low-voltage segments and future opportunities.

September 2025
Base Year: 2024
No Of Pages: 234
Price: $4750

Exploring LA Package Testing Market Market Disruption and Innovation

Discover the booming LA Package Testing market! This comprehensive analysis reveals a CAGR of 6.00%, driven by e-commerce, sustainability, and regulatory changes. Explore market size, segmentation (glass, paper, plastic, metal packaging; physical, chemical, environmental testing), key players (Intertek, SGS, etc.), and regional trends (North America, Europe, Asia-Pacific). Get insights to optimize your packaging strategy.

September 2025
Base Year: 2024
No Of Pages: 210
Price: $4750

Eye Tracking Solutions Market Growth Pathways: Strategic Analysis and Forecasts 2025-2033

The Eye Tracking Solutions market is booming, projected to reach $9.5 billion by 2033 with a 26% CAGR. This in-depth analysis explores market drivers, trends, restraints, and key players across sectors like automotive, retail, and healthcare. Discover growth opportunities and the latest technological advancements shaping this dynamic industry.

September 2025
Base Year: 2024
No Of Pages: 234
Price: $4750

Netherlands E-commerce Market 2025 Trends and Forecasts 2033: Analyzing Growth Opportunities

Discover the booming Netherlands e-commerce market! This in-depth analysis reveals a €33.43B market in 2025, growing at a 9.31% CAGR until 2033. Explore key drivers, trends, segments (beauty, electronics, fashion), and top players like Bol.com and Zalando.

September 2025
Base Year: 2024
No Of Pages: 197
Price: $3800

Wireless Infrastructure Monitoring Industry Industry’s Future Growth Prospects

The Wireless Infrastructure Monitoring market is booming, projected to reach \$4.18B by 2025 with a 12.90% CAGR. Discover key drivers, trends, and market segmentation insights, including data on geotechnical, structural, and environmental monitoring applications across major industries. Learn about leading companies and regional market shares.

September 2025
Base Year: 2024
No Of Pages: 234
Price: $4750

North America Security Services Market: Disruptive Technologies Driving Market Growth 2025-2033

The North American security services market is booming, projected to reach over $70 billion by 2033, driven by rising cyber threats and stringent regulations. Learn about market trends, key players (IBM, GardaWorld, etc.), and growth opportunities in this comprehensive analysis.

September 2025
Base Year: 2024
No Of Pages: 210
Price: $4750

SMS Firewall Market Industry’s Future Growth Prospects

The SMS Firewall market is booming, projected to reach $XX million by 2033 with a 10.2% CAGR. This report analyzes market drivers, trends, and key players like Twilio and Sinch, covering segments like A2P SMS, cloud platforms, and major industries. Learn about securing your SMS communications against fraud and boosting compliance.

September 2025
Base Year: 2024
No Of Pages: 234
Price: $4750

Overcoming Challenges in Asia Pacific IT Device Market Market: Strategic Insights 2025-2033

Discover the latest insights into the booming Asia-Pacific IT device market. This comprehensive analysis reveals key growth drivers, emerging trends, and regional market shares for PCs, smartphones, and other devices, forecasting market size through 2033. Learn about major players and competitive landscapes.

September 2025
Base Year: 2024
No Of Pages: 234
Price: $4750

UAE Cloud Accounting Software Market Market Expansion Strategies

UAE Cloud Accounting Software Market booming with a CAGR of 14.94%, driven by digital transformation and SME growth. Explore market size, trends, key players (Intuit, Zoho, SAP), and regional insights. Forecast to 2033.

September 2025
Base Year: 2024
No Of Pages: 197
Price: $3800

APAC Data Center Construction Market Market Report: Strategic Insights

Discover the booming APAC data center construction market! This in-depth analysis reveals a projected CAGR of 8.62% through 2033, driven by digitalization, cloud computing, and 5G adoption. Learn about key segments, regional trends, and leading companies shaping this dynamic industry.

September 2025
Base Year: 2024
No Of Pages: 210
Price: $4750

Unveiling Germany Access Control Market Growth Patterns: CAGR Analysis and Forecasts 2025-2033

Discover the booming German access control market! Our in-depth analysis reveals a €520 million market in 2025, projected to grow at a CAGR of 5.92% until 2033. Learn about key drivers, trends, restraints, and leading companies shaping this dynamic sector. Explore market segmentation by device type and end-user vertical.

September 2025
Base Year: 2024
No Of Pages: 197
Price: $3800

Smart Sound and Gateway Market Market Report: Trends and Growth

Discover the booming smart sound & gateway market! Explore its 29.24% CAGR, key drivers like Alexa & Google Assistant, leading companies like Amazon & Google, and regional trends shaping this multi-billion dollar industry. Get insights into smart speaker and hearable market growth forecasts to 2033.

September 2025
Base Year: 2024
No Of Pages: 234
Price: $4750

Hospitality Property Management Software (PMS) Industry Market’s Tech Revolution: Projections to 2033

Discover the booming Hospitality Property Management Software (PMS) market! This comprehensive analysis reveals key trends, growth drivers, and leading companies shaping the future of hotel management. Explore market size projections, regional breakdowns, and emerging technologies driving innovation in the industry. Learn how cloud-based PMS, personalized guest experiences, and revenue management solutions are transforming hospitality.

September 2025
Base Year: 2024
No Of Pages: 234
Price: $4750

Business Address

Head Office

Ansec House 3 rd floor Tank Road, Yerwada, Pune, Maharashtra 411014

Contact Information

Craig Francis

Business Development Head

+17162654855

[email protected]

Secure Payment Partners

payment image
RetailLogisticsPackagingAutomotiveHealthcareAgricultureEnergy & PowerFood & BeverageAerospace & DefenseChemicals & MaterialsHospitality and TourismAnimal Nutrition & WellnessConsumer Goods and ServicesReal Estate and ConstructionHome and Property ImprovementTechnology, Media and TelecomManufacturing Products and ServicesFinancial Services and Investment Intelligence

© 2025 PRDUA Research & Media Private Limited, All rights reserved

Privacy Policy
Terms and Conditions
FAQ
  • Home
  • About Us
  • Industries
    • Aerospace & Defense
    • Agriculture
    • Animal Nutrition & Wellness
    • Automotive
    • Chemicals & Materials
    • Consumer Goods and Services
    • Energy & Power
    • Financial Services and Investment Intelligence
    • Food & Beverage
    • Home and Property Improvement
    • Hospitality and Tourism
    • Logistics
    • Manufacturing Products and Services
    • Packaging
    • Professional and Commercial Services
    • Real Estate and Construction
    • Retail
    • Technology, Media and Telecom
    • Healthcare
  • Services
  • Contact
Main Logo
  • Home
  • About Us
  • Industries
    • Aerospace & Defense
    • Agriculture
    • Animal Nutrition & Wellness
    • Automotive
    • Chemicals & Materials
    • Consumer Goods and Services
    • Energy & Power
    • Financial Services and Investment Intelligence
    • Food & Beverage
    • Home and Property Improvement
    • Hospitality and Tourism
    • Logistics
    • Manufacturing Products and Services
    • Packaging
    • Professional and Commercial Services
    • Real Estate and Construction
    • Retail
    • Technology, Media and Telecom
    • Healthcare
  • Services
  • Contact
+17162654855
[email protected]

+17162654855

[email protected]