

Key Insights
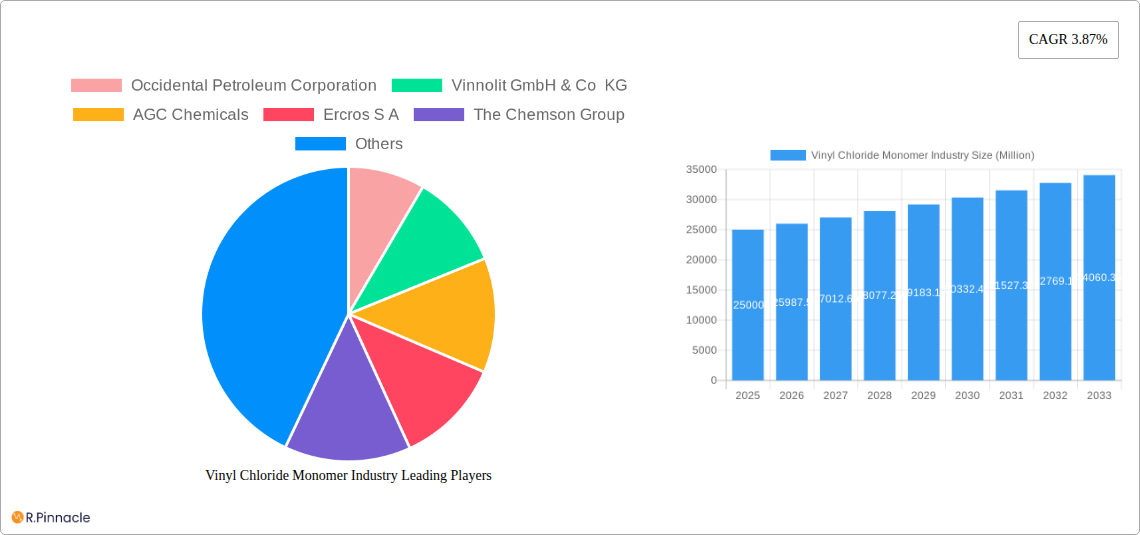
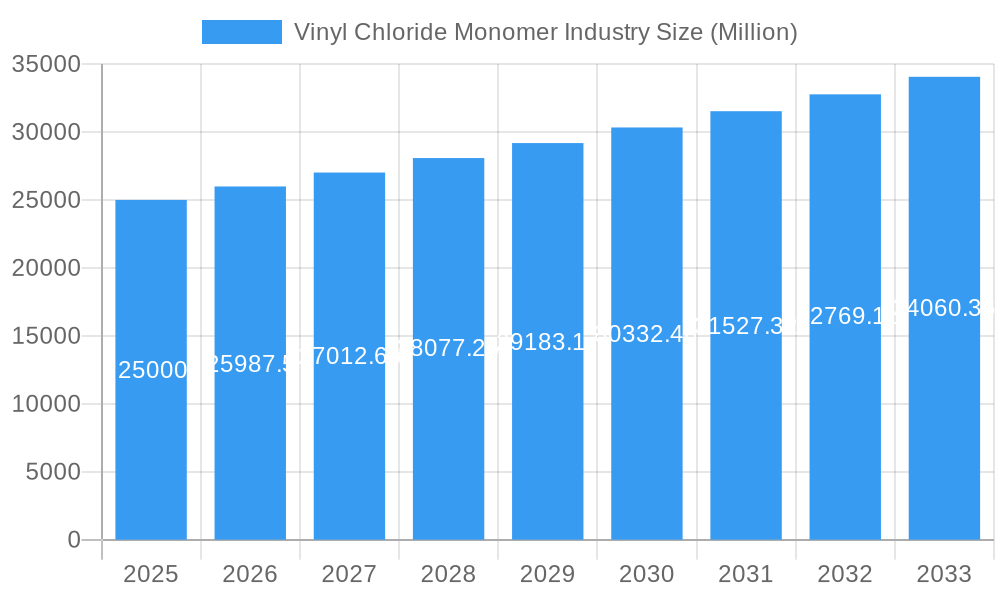
The Vinyl Chloride Monomer (VCM) market, projected to reach 47.15 million in 2025, is forecast for consistent expansion. Expected to grow at a Compound Annual Growth Rate (CAGR) of 3.87% from 2025 to 2033, this market's growth is primarily fueled by robust demand from the building and construction sector, particularly in developing economies undergoing rapid urbanization and infrastructure development. The increased utilization of PVC pipes, windows, and other construction materials is a key driver. The healthcare sector also contributes significantly, as VCM is a critical component in medical devices and equipment. Furthermore, advancements in PVC technology, enhancing durability, flexibility, and sustainability, positively influence market expansion. However, stringent environmental regulations concerning VCM emissions and rising raw material costs present significant challenges that may impede market growth in specific regions. The market is segmented by end-user industry (Building and Construction, Healthcare, Electrical, Other) and application (PVC, Other). Leading companies such as Occidental Petroleum Corporation and Vinnolit GmbH & Co KG are strategically investing in capacity expansion and technological advancements to secure their market positions. Intense competition exists between established players and emerging companies vying for market dominance across diverse geographical areas.
Vinyl Chloride Monomer Industry Market Size (In Million)
The Asia Pacific region, led by China and India, is anticipated to dominate the VCM market due to substantial investments in infrastructure projects and escalating demand for PVC-based products. North America and Europe also hold considerable market shares, though their growth rates are projected to be slower than Asia Pacific due to market maturity and stringent environmental regulations. South America and the Middle East and Africa are expected to experience moderate growth, driven by increasing construction activities and industrial development. Future market trends will likely be shaped by a growing emphasis on sustainable PVC production, technological innovations aimed at improving energy efficiency, and the development of alternative materials, which could impact the VCM market long-term. A sustained focus on safety protocols and rigorous environmental compliance measures will be essential for continued industry growth.
Vinyl Chloride Monomer Industry Company Market Share
Vinyl Chloride Monomer (VCM) Industry Market Report: 2019-2033
This comprehensive report provides an in-depth analysis of the global Vinyl Chloride Monomer (VCM) industry, offering invaluable insights for industry professionals, investors, and strategic decision-makers. Covering the period 2019-2033, with a focus on 2025, this report leverages rigorous data analysis and expert forecasting to illuminate key trends, challenges, and opportunities within this dynamic market. The report includes detailed segmentation, competitive landscape analysis, and future growth projections, making it an essential resource for navigating the complexities of the VCM market.
Vinyl Chloride Monomer Industry Market Structure & Innovation Trends
This section analyzes the competitive landscape, innovation drivers, and regulatory influences shaping the VCM industry. The market is moderately concentrated, with key players including Occidental Petroleum Corporation, Vinnolit GmbH & Co KG, AGC Chemicals, Ercros S A, The Chemson Group, Westlake Chemical Corporation, Olin Corporation, Reliance Industries Limited, Vynova Group, Tosoh Corporation, NOVA Chemicals, Dow, Mexichem, The Axiall Corporation, and Shin-Etsu PVC B V. Market share data for 2024 reveals a xx% share for the top three players, indicating a consolidated but not monopolistic structure.
- Market Concentration: The top five players hold an estimated xx% of the global market share in 2024.
- Innovation Drivers: Focus on sustainability (reducing carbon footprint), process efficiency improvements (digital twins as exemplified by AGC’s recent development), and the development of specialty VCM grades for niche applications drive innovation.
- Regulatory Frameworks: Stringent environmental regulations and safety standards significantly impact production and operations, pushing companies towards more sustainable processes.
- Product Substitutes: Limited direct substitutes exist for VCM, however, alternative materials in downstream applications such as PVC pose indirect competitive pressures.
- M&A Activities: The last five years have witnessed xx Million in M&A activity, primarily focused on consolidating production capacity and expanding geographical reach. Examples include [Insert specific examples if available, otherwise state "specific examples are unavailable"]. These deals showcase a strategic focus on vertical integration.
- End-User Demographics: The building and construction sector remains the largest end-use segment, followed by healthcare and electrical applications. Shifts in global construction activity directly influence VCM demand.
Vinyl Chloride Monomer Industry Market Dynamics & Trends
The global VCM market is projected to experience a CAGR of xx% during the forecast period (2025-2033), driven by robust growth in the construction industry in developing economies and increasing demand for PVC-based products. Market penetration of VCM in various applications is relatively high in developed nations but still has growth potential in emerging economies.
Technological advancements, particularly in process optimization and automation, are driving production efficiency and reducing costs. Consumer preferences are shifting towards more sustainable and eco-friendly products, putting pressure on manufacturers to adopt greener production methods. Competitive dynamics are marked by price competition, capacity expansion, and strategic alliances amongst major players. Key challenges include fluctuating raw material prices and environmental regulations, impacting overall market stability.
Dominant Regions & Segments in Vinyl Chloride Monomer Industry
The Asia-Pacific region is expected to dominate the VCM market, driven by substantial growth in construction activities and increasing industrialization. China, India, and Southeast Asia are key contributors to this regional dominance.
- End-User Industry:
- Building and Construction: This remains the largest segment, driven by infrastructure development and urbanization in developing economies. Government policies promoting infrastructure spending significantly influence market growth.
- Healthcare: Demand in the healthcare sector is relatively smaller but characterized by consistent growth, driven by the need for PVC-based medical devices and equipment.
- Electrical: This segment demonstrates steady growth, influenced by the rising demand for electricity and associated infrastructure.
- Other End-user Industries: This segment comprises diverse sectors such as packaging and automotive, characterized by moderate and stable growth.
- Application:
- PVC: PVC remains the primary application of VCM, accounting for over xx% of total consumption. Its versatility and cost-effectiveness fuel consistent demand.
- Other Applications: Other applications include specialty chemicals and niche products, which represent a relatively smaller market segment but showcase higher growth potential.
Vinyl Chloride Monomer Industry Product Innovations
Recent innovations focus on developing higher-performance VCM grades with enhanced properties to cater to specific applications. This includes improved heat stability, clarity, and durability in PVC formulations. Furthermore, efforts towards enhancing production efficiency via digital twins and process optimization remain significant focuses for key players. These innovations reflect a proactive approach to meeting evolving market needs and enhancing competitive advantages.
Report Scope & Segmentation Analysis
This report segments the VCM market by end-user industry (Building and Construction, Healthcare, Electrical, Other End-user Industries) and application (PVC, Other Applications). Growth projections for each segment vary, with the Building and Construction sector projected for the highest growth rate. Market sizes for each segment are detailed in the full report. Competitive dynamics also vary by segment, with some exhibiting higher concentration than others. For example, the PVC application segment is more concentrated than the "other applications" segment.
Key Drivers of Vinyl Chloride Monomer Industry Growth
The VCM market's growth is driven by several factors: increasing global construction activity, rising demand for PVC-based products in developing economies, and technological advancements in VCM production. Government infrastructure spending in emerging markets plays a crucial role. Furthermore, the versatility and cost-effectiveness of PVC across various sectors ensure consistent demand for VCM.
Challenges in the Vinyl Chloride Monomer Industry Sector
The VCM industry faces several challenges, including fluctuating raw material prices, stringent environmental regulations (leading to increased compliance costs), and intense competition among major players. Supply chain disruptions can also significantly impact production and profitability. The potential for increased regulatory scrutiny further impacts production costs and market stability.
Emerging Opportunities in Vinyl Chloride Monomer Industry
Emerging opportunities lie in the development of sustainable VCM production processes, expanding into new geographical markets (particularly in Africa and Latin America), and focusing on high-growth niche applications. The development of specialized VCM grades for high-performance applications offers significant growth potential.
Leading Players in the Vinyl Chloride Monomer Industry Market
- Occidental Petroleum Corporation
- Vinnolit GmbH & Co KG
- AGC Chemicals
- Ercros S A
- The Chemson Group
- Westlake Chemical Corporation
- Olin Corporation
- Reliance Industries Limited
- Vynova Group
- Tosoh Corporation
- NOVA Chemicals
- Dow
- Mexichem
- The Axiall Corporation
- Shin-Etsu PVC B V
Key Developments in Vinyl Chloride Monomer Industry Industry
- April 2023: AGC Chemicals successfully developed a Process Digital Twin for chemical plants and commenced operation at its VCM manufacturing plant in Indonesia. This development is expected to enhance efficiency and sustainability in VCM production.
Future Outlook for Vinyl Chloride Monomer Industry Market
The VCM market is poised for continued growth, driven by sustained demand from the construction sector and expansion into new applications. Strategic investments in sustainable production technologies and expansion into emerging markets will be crucial for future success. The market's overall outlook remains positive, with considerable growth potential over the forecast period.
Vinyl Chloride Monomer Industry Segmentation
-
1. Application
- 1.1. PVC
- 1.2. Other Applications
-
2. End-user Industry
- 2.1. Building and Construction
- 2.2. Healthcare
- 2.3. Electrical
- 2.4. Other End-user Industries
Vinyl Chloride Monomer Industry Segmentation By Geography
-
1. Asia Pacific
- 1.1. China
- 1.2. India
- 1.3. Japan
- 1.4. South Korea
- 1.5. Rest of Asia Pacific
-
2. North America
- 2.1. United States
- 2.2. Canada
- 2.3. Mexico
-
3. Europe
- 3.1. Germany
- 3.2. United Kingdom
- 3.3. France
- 3.4. Italy
- 3.5. Rest of Europe
-
4. South America
- 4.1. Brazil
- 4.2. Argentina
- 4.3. Rest of South America
-
5. Middle East and Africa
- 5.1. Saudi Arabia
- 5.2. South Africa
- 5.3. Rest of Middle East and Africa
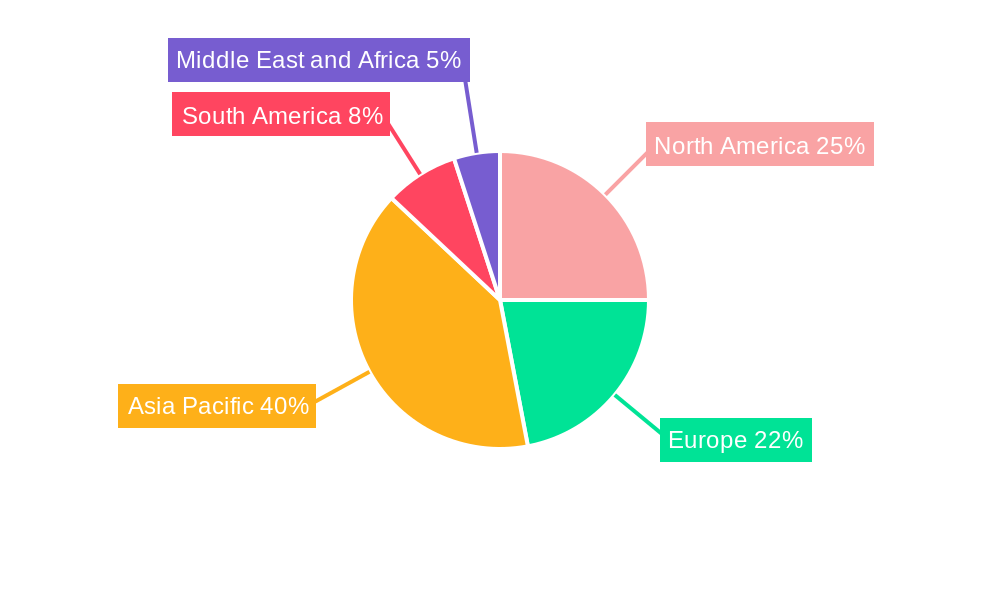
Vinyl Chloride Monomer Industry Regional Market Share
Geographic Coverage of Vinyl Chloride Monomer Industry
Vinyl Chloride Monomer Industry REPORT HIGHLIGHTS
| Aspects | Details |
|---|---|
| Study Period | 2020-2034 |
| Base Year | 2025 |
| Estimated Year | 2026 |
| Forecast Period | 2026-2034 |
| Historical Period | 2020-2025 |
| Growth Rate | CAGR of 3.87% from 2020-2034 |
| Segmentation |
|
Table of Contents
- 1. Introduction
- 1.1. Research Scope
- 1.2. Market Segmentation
- 1.3. Research Objective
- 1.4. Definitions and Assumptions
- 2. Executive Summary
- 2.1. Market Snapshot
- 3. Market Dynamics
- 3.1. Market Drivers
- 3.2. Market Restrains
- 3.3. Market Trends
- 3.4. Market Opportunities
- 4. Market Factor Analysis
- 4.1. Porters Five Forces
- 4.1.1. Bargaining Power of Suppliers
- 4.1.2. Bargaining Power of Buyers
- 4.1.3. Threat of New Entrants
- 4.1.4. Threat of Substitutes
- 4.1.5. Competitive Rivalry
- 4.2. PESTEL analysis
- 4.3. BCG Analysis
- 4.3.1. Stars (High Growth, High Market Share)
- 4.3.2. Cash Cows (Low Growth, High Market Share)
- 4.3.3. Question Mark (High Growth, Low Market Share)
- 4.3.4. Dogs (Low Growth, Low Market Share)
- 4.4. Ansoff Matrix Analysis
- 4.5. Supply Chain Analysis
- 4.6. Regulatory Landscape
- 4.7. Current Market Potential and Opportunity Assessment (TAM–SAM–SOM Framework)
- 4.8. PRI Analyst Note
- 4.1. Porters Five Forces
- 5. Market Analysis, Insights and Forecast 2021-2033
- 5.1. Market Analysis, Insights and Forecast - by Application
- 5.1.1. PVC
- 5.1.2. Other Applications
- 5.2. Market Analysis, Insights and Forecast - by End-user Industry
- 5.2.1. Building and Construction
- 5.2.2. Healthcare
- 5.2.3. Electrical
- 5.2.4. Other End-user Industries
- 5.3. Market Analysis, Insights and Forecast - by Region
- 5.3.1. Asia Pacific
- 5.3.2. North America
- 5.3.3. Europe
- 5.3.4. South America
- 5.3.5. Middle East and Africa
- 5.1. Market Analysis, Insights and Forecast - by Application
- 6. Global Vinyl Chloride Monomer Industry Analysis, Insights and Forecast, 2021-2033
- 6.1. Market Analysis, Insights and Forecast - by Application
- 6.1.1. PVC
- 6.1.2. Other Applications
- 6.2. Market Analysis, Insights and Forecast - by End-user Industry
- 6.2.1. Building and Construction
- 6.2.2. Healthcare
- 6.2.3. Electrical
- 6.2.4. Other End-user Industries
- 6.1. Market Analysis, Insights and Forecast - by Application
- 7. Asia Pacific Vinyl Chloride Monomer Industry Analysis, Insights and Forecast, 2020-2032
- 7.1. Market Analysis, Insights and Forecast - by Application
- 7.1.1. PVC
- 7.1.2. Other Applications
- 7.2. Market Analysis, Insights and Forecast - by End-user Industry
- 7.2.1. Building and Construction
- 7.2.2. Healthcare
- 7.2.3. Electrical
- 7.2.4. Other End-user Industries
- 7.1. Market Analysis, Insights and Forecast - by Application
- 8. North America Vinyl Chloride Monomer Industry Analysis, Insights and Forecast, 2020-2032
- 8.1. Market Analysis, Insights and Forecast - by Application
- 8.1.1. PVC
- 8.1.2. Other Applications
- 8.2. Market Analysis, Insights and Forecast - by End-user Industry
- 8.2.1. Building and Construction
- 8.2.2. Healthcare
- 8.2.3. Electrical
- 8.2.4. Other End-user Industries
- 8.1. Market Analysis, Insights and Forecast - by Application
- 9. Europe Vinyl Chloride Monomer Industry Analysis, Insights and Forecast, 2020-2032
- 9.1. Market Analysis, Insights and Forecast - by Application
- 9.1.1. PVC
- 9.1.2. Other Applications
- 9.2. Market Analysis, Insights and Forecast - by End-user Industry
- 9.2.1. Building and Construction
- 9.2.2. Healthcare
- 9.2.3. Electrical
- 9.2.4. Other End-user Industries
- 9.1. Market Analysis, Insights and Forecast - by Application
- 10. South America Vinyl Chloride Monomer Industry Analysis, Insights and Forecast, 2020-2032
- 10.1. Market Analysis, Insights and Forecast - by Application
- 10.1.1. PVC
- 10.1.2. Other Applications
- 10.2. Market Analysis, Insights and Forecast - by End-user Industry
- 10.2.1. Building and Construction
- 10.2.2. Healthcare
- 10.2.3. Electrical
- 10.2.4. Other End-user Industries
- 10.1. Market Analysis, Insights and Forecast - by Application
- 11. Middle East and Africa Vinyl Chloride Monomer Industry Analysis, Insights and Forecast, 2020-2032
- 11.1. Market Analysis, Insights and Forecast - by Application
- 11.1.1. PVC
- 11.1.2. Other Applications
- 11.2. Market Analysis, Insights and Forecast - by End-user Industry
- 11.2.1. Building and Construction
- 11.2.2. Healthcare
- 11.2.3. Electrical
- 11.2.4. Other End-user Industries
- 11.1. Market Analysis, Insights and Forecast - by Application
- 12. Competitive Analysis
- 12.1. Company Profiles
- 12.1.1 Occidental Petroleum Corporation
- 12.1.1.1. Company Overview
- 12.1.1.2. Products
- 12.1.1.3. Company Financials
- 12.1.1.4. SWOT Analysis
- 12.1.2 Vinnolit GmbH & Co KG
- 12.1.2.1. Company Overview
- 12.1.2.2. Products
- 12.1.2.3. Company Financials
- 12.1.2.4. SWOT Analysis
- 12.1.3 AGC Chemicals
- 12.1.3.1. Company Overview
- 12.1.3.2. Products
- 12.1.3.3. Company Financials
- 12.1.3.4. SWOT Analysis
- 12.1.4 Ercros S A
- 12.1.4.1. Company Overview
- 12.1.4.2. Products
- 12.1.4.3. Company Financials
- 12.1.4.4. SWOT Analysis
- 12.1.5 The Chemson Group
- 12.1.5.1. Company Overview
- 12.1.5.2. Products
- 12.1.5.3. Company Financials
- 12.1.5.4. SWOT Analysis
- 12.1.6 Westlake Chemical Corporation*List Not Exhaustive
- 12.1.6.1. Company Overview
- 12.1.6.2. Products
- 12.1.6.3. Company Financials
- 12.1.6.4. SWOT Analysis
- 12.1.7 Olin Corporation
- 12.1.7.1. Company Overview
- 12.1.7.2. Products
- 12.1.7.3. Company Financials
- 12.1.7.4. SWOT Analysis
- 12.1.8 Reliance Industries Limited
- 12.1.8.1. Company Overview
- 12.1.8.2. Products
- 12.1.8.3. Company Financials
- 12.1.8.4. SWOT Analysis
- 12.1.9 Vynova Group
- 12.1.9.1. Company Overview
- 12.1.9.2. Products
- 12.1.9.3. Company Financials
- 12.1.9.4. SWOT Analysis
- 12.1.10 Tosoh Corporation
- 12.1.10.1. Company Overview
- 12.1.10.2. Products
- 12.1.10.3. Company Financials
- 12.1.10.4. SWOT Analysis
- 12.1.11 NOVA Chemicals
- 12.1.11.1. Company Overview
- 12.1.11.2. Products
- 12.1.11.3. Company Financials
- 12.1.11.4. SWOT Analysis
- 12.1.12 Dow
- 12.1.12.1. Company Overview
- 12.1.12.2. Products
- 12.1.12.3. Company Financials
- 12.1.12.4. SWOT Analysis
- 12.1.13 Mexichem
- 12.1.13.1. Company Overview
- 12.1.13.2. Products
- 12.1.13.3. Company Financials
- 12.1.13.4. SWOT Analysis
- 12.1.14 The Axiall Corporation
- 12.1.14.1. Company Overview
- 12.1.14.2. Products
- 12.1.14.3. Company Financials
- 12.1.14.4. SWOT Analysis
- 12.1.15 Shin-Etsu PVC B V
- 12.1.15.1. Company Overview
- 12.1.15.2. Products
- 12.1.15.3. Company Financials
- 12.1.15.4. SWOT Analysis
- 12.1.1 Occidental Petroleum Corporation
- 12.2. Market Entropy
- 12.2.1 Company's Key Areas Served
- 12.2.2 Recent Developments
- 12.3. Company Market Share Analysis 2025
- 12.3.1 Top 5 Companies Market Share Analysis
- 12.3.2 Top 3 Companies Market Share Analysis
- 12.4. List of Potential Customers
- 13. Research Methodology
List of Figures
- Figure 1: Global Vinyl Chloride Monomer Industry Revenue Breakdown (million, %) by Region 2025 & 2033
- Figure 2: Global Vinyl Chloride Monomer Industry Volume Breakdown (Million, %) by Region 2025 & 2033
- Figure 3: Asia Pacific Vinyl Chloride Monomer Industry Revenue (million), by Application 2025 & 2033
- Figure 4: Asia Pacific Vinyl Chloride Monomer Industry Volume (Million), by Application 2025 & 2033
- Figure 5: Asia Pacific Vinyl Chloride Monomer Industry Revenue Share (%), by Application 2025 & 2033
- Figure 6: Asia Pacific Vinyl Chloride Monomer Industry Volume Share (%), by Application 2025 & 2033
- Figure 7: Asia Pacific Vinyl Chloride Monomer Industry Revenue (million), by End-user Industry 2025 & 2033
- Figure 8: Asia Pacific Vinyl Chloride Monomer Industry Volume (Million), by End-user Industry 2025 & 2033
- Figure 9: Asia Pacific Vinyl Chloride Monomer Industry Revenue Share (%), by End-user Industry 2025 & 2033
- Figure 10: Asia Pacific Vinyl Chloride Monomer Industry Volume Share (%), by End-user Industry 2025 & 2033
- Figure 11: Asia Pacific Vinyl Chloride Monomer Industry Revenue (million), by Country 2025 & 2033
- Figure 12: Asia Pacific Vinyl Chloride Monomer Industry Volume (Million), by Country 2025 & 2033
- Figure 13: Asia Pacific Vinyl Chloride Monomer Industry Revenue Share (%), by Country 2025 & 2033
- Figure 14: Asia Pacific Vinyl Chloride Monomer Industry Volume Share (%), by Country 2025 & 2033
- Figure 15: North America Vinyl Chloride Monomer Industry Revenue (million), by Application 2025 & 2033
- Figure 16: North America Vinyl Chloride Monomer Industry Volume (Million), by Application 2025 & 2033
- Figure 17: North America Vinyl Chloride Monomer Industry Revenue Share (%), by Application 2025 & 2033
- Figure 18: North America Vinyl Chloride Monomer Industry Volume Share (%), by Application 2025 & 2033
- Figure 19: North America Vinyl Chloride Monomer Industry Revenue (million), by End-user Industry 2025 & 2033
- Figure 20: North America Vinyl Chloride Monomer Industry Volume (Million), by End-user Industry 2025 & 2033
- Figure 21: North America Vinyl Chloride Monomer Industry Revenue Share (%), by End-user Industry 2025 & 2033
- Figure 22: North America Vinyl Chloride Monomer Industry Volume Share (%), by End-user Industry 2025 & 2033
- Figure 23: North America Vinyl Chloride Monomer Industry Revenue (million), by Country 2025 & 2033
- Figure 24: North America Vinyl Chloride Monomer Industry Volume (Million), by Country 2025 & 2033
- Figure 25: North America Vinyl Chloride Monomer Industry Revenue Share (%), by Country 2025 & 2033
- Figure 26: North America Vinyl Chloride Monomer Industry Volume Share (%), by Country 2025 & 2033
- Figure 27: Europe Vinyl Chloride Monomer Industry Revenue (million), by Application 2025 & 2033
- Figure 28: Europe Vinyl Chloride Monomer Industry Volume (Million), by Application 2025 & 2033
- Figure 29: Europe Vinyl Chloride Monomer Industry Revenue Share (%), by Application 2025 & 2033
- Figure 30: Europe Vinyl Chloride Monomer Industry Volume Share (%), by Application 2025 & 2033
- Figure 31: Europe Vinyl Chloride Monomer Industry Revenue (million), by End-user Industry 2025 & 2033
- Figure 32: Europe Vinyl Chloride Monomer Industry Volume (Million), by End-user Industry 2025 & 2033
- Figure 33: Europe Vinyl Chloride Monomer Industry Revenue Share (%), by End-user Industry 2025 & 2033
- Figure 34: Europe Vinyl Chloride Monomer Industry Volume Share (%), by End-user Industry 2025 & 2033
- Figure 35: Europe Vinyl Chloride Monomer Industry Revenue (million), by Country 2025 & 2033
- Figure 36: Europe Vinyl Chloride Monomer Industry Volume (Million), by Country 2025 & 2033
- Figure 37: Europe Vinyl Chloride Monomer Industry Revenue Share (%), by Country 2025 & 2033
- Figure 38: Europe Vinyl Chloride Monomer Industry Volume Share (%), by Country 2025 & 2033
- Figure 39: South America Vinyl Chloride Monomer Industry Revenue (million), by Application 2025 & 2033
- Figure 40: South America Vinyl Chloride Monomer Industry Volume (Million), by Application 2025 & 2033
- Figure 41: South America Vinyl Chloride Monomer Industry Revenue Share (%), by Application 2025 & 2033
- Figure 42: South America Vinyl Chloride Monomer Industry Volume Share (%), by Application 2025 & 2033
- Figure 43: South America Vinyl Chloride Monomer Industry Revenue (million), by End-user Industry 2025 & 2033
- Figure 44: South America Vinyl Chloride Monomer Industry Volume (Million), by End-user Industry 2025 & 2033
- Figure 45: South America Vinyl Chloride Monomer Industry Revenue Share (%), by End-user Industry 2025 & 2033
- Figure 46: South America Vinyl Chloride Monomer Industry Volume Share (%), by End-user Industry 2025 & 2033
- Figure 47: South America Vinyl Chloride Monomer Industry Revenue (million), by Country 2025 & 2033
- Figure 48: South America Vinyl Chloride Monomer Industry Volume (Million), by Country 2025 & 2033
- Figure 49: South America Vinyl Chloride Monomer Industry Revenue Share (%), by Country 2025 & 2033
- Figure 50: South America Vinyl Chloride Monomer Industry Volume Share (%), by Country 2025 & 2033
- Figure 51: Middle East and Africa Vinyl Chloride Monomer Industry Revenue (million), by Application 2025 & 2033
- Figure 52: Middle East and Africa Vinyl Chloride Monomer Industry Volume (Million), by Application 2025 & 2033
- Figure 53: Middle East and Africa Vinyl Chloride Monomer Industry Revenue Share (%), by Application 2025 & 2033
- Figure 54: Middle East and Africa Vinyl Chloride Monomer Industry Volume Share (%), by Application 2025 & 2033
- Figure 55: Middle East and Africa Vinyl Chloride Monomer Industry Revenue (million), by End-user Industry 2025 & 2033
- Figure 56: Middle East and Africa Vinyl Chloride Monomer Industry Volume (Million), by End-user Industry 2025 & 2033
- Figure 57: Middle East and Africa Vinyl Chloride Monomer Industry Revenue Share (%), by End-user Industry 2025 & 2033
- Figure 58: Middle East and Africa Vinyl Chloride Monomer Industry Volume Share (%), by End-user Industry 2025 & 2033
- Figure 59: Middle East and Africa Vinyl Chloride Monomer Industry Revenue (million), by Country 2025 & 2033
- Figure 60: Middle East and Africa Vinyl Chloride Monomer Industry Volume (Million), by Country 2025 & 2033
- Figure 61: Middle East and Africa Vinyl Chloride Monomer Industry Revenue Share (%), by Country 2025 & 2033
- Figure 62: Middle East and Africa Vinyl Chloride Monomer Industry Volume Share (%), by Country 2025 & 2033
List of Tables
- Table 1: Global Vinyl Chloride Monomer Industry Revenue million Forecast, by Application 2020 & 2033
- Table 2: Global Vinyl Chloride Monomer Industry Volume Million Forecast, by Application 2020 & 2033
- Table 3: Global Vinyl Chloride Monomer Industry Revenue million Forecast, by End-user Industry 2020 & 2033
- Table 4: Global Vinyl Chloride Monomer Industry Volume Million Forecast, by End-user Industry 2020 & 2033
- Table 5: Global Vinyl Chloride Monomer Industry Revenue million Forecast, by Region 2020 & 2033
- Table 6: Global Vinyl Chloride Monomer Industry Volume Million Forecast, by Region 2020 & 2033
- Table 7: Global Vinyl Chloride Monomer Industry Revenue million Forecast, by Application 2020 & 2033
- Table 8: Global Vinyl Chloride Monomer Industry Volume Million Forecast, by Application 2020 & 2033
- Table 9: Global Vinyl Chloride Monomer Industry Revenue million Forecast, by End-user Industry 2020 & 2033
- Table 10: Global Vinyl Chloride Monomer Industry Volume Million Forecast, by End-user Industry 2020 & 2033
- Table 11: Global Vinyl Chloride Monomer Industry Revenue million Forecast, by Country 2020 & 2033
- Table 12: Global Vinyl Chloride Monomer Industry Volume Million Forecast, by Country 2020 & 2033
- Table 13: China Vinyl Chloride Monomer Industry Revenue (million) Forecast, by Application 2020 & 2033
- Table 14: China Vinyl Chloride Monomer Industry Volume (Million) Forecast, by Application 2020 & 2033
- Table 15: India Vinyl Chloride Monomer Industry Revenue (million) Forecast, by Application 2020 & 2033
- Table 16: India Vinyl Chloride Monomer Industry Volume (Million) Forecast, by Application 2020 & 2033
- Table 17: Japan Vinyl Chloride Monomer Industry Revenue (million) Forecast, by Application 2020 & 2033
- Table 18: Japan Vinyl Chloride Monomer Industry Volume (Million) Forecast, by Application 2020 & 2033
- Table 19: South Korea Vinyl Chloride Monomer Industry Revenue (million) Forecast, by Application 2020 & 2033
- Table 20: South Korea Vinyl Chloride Monomer Industry Volume (Million) Forecast, by Application 2020 & 2033
- Table 21: Rest of Asia Pacific Vinyl Chloride Monomer Industry Revenue (million) Forecast, by Application 2020 & 2033
- Table 22: Rest of Asia Pacific Vinyl Chloride Monomer Industry Volume (Million) Forecast, by Application 2020 & 2033
- Table 23: Global Vinyl Chloride Monomer Industry Revenue million Forecast, by Application 2020 & 2033
- Table 24: Global Vinyl Chloride Monomer Industry Volume Million Forecast, by Application 2020 & 2033
- Table 25: Global Vinyl Chloride Monomer Industry Revenue million Forecast, by End-user Industry 2020 & 2033
- Table 26: Global Vinyl Chloride Monomer Industry Volume Million Forecast, by End-user Industry 2020 & 2033
- Table 27: Global Vinyl Chloride Monomer Industry Revenue million Forecast, by Country 2020 & 2033
- Table 28: Global Vinyl Chloride Monomer Industry Volume Million Forecast, by Country 2020 & 2033
- Table 29: United States Vinyl Chloride Monomer Industry Revenue (million) Forecast, by Application 2020 & 2033
- Table 30: United States Vinyl Chloride Monomer Industry Volume (Million) Forecast, by Application 2020 & 2033
- Table 31: Canada Vinyl Chloride Monomer Industry Revenue (million) Forecast, by Application 2020 & 2033
- Table 32: Canada Vinyl Chloride Monomer Industry Volume (Million) Forecast, by Application 2020 & 2033
- Table 33: Mexico Vinyl Chloride Monomer Industry Revenue (million) Forecast, by Application 2020 & 2033
- Table 34: Mexico Vinyl Chloride Monomer Industry Volume (Million) Forecast, by Application 2020 & 2033
- Table 35: Global Vinyl Chloride Monomer Industry Revenue million Forecast, by Application 2020 & 2033
- Table 36: Global Vinyl Chloride Monomer Industry Volume Million Forecast, by Application 2020 & 2033
- Table 37: Global Vinyl Chloride Monomer Industry Revenue million Forecast, by End-user Industry 2020 & 2033
- Table 38: Global Vinyl Chloride Monomer Industry Volume Million Forecast, by End-user Industry 2020 & 2033
- Table 39: Global Vinyl Chloride Monomer Industry Revenue million Forecast, by Country 2020 & 2033
- Table 40: Global Vinyl Chloride Monomer Industry Volume Million Forecast, by Country 2020 & 2033
- Table 41: Germany Vinyl Chloride Monomer Industry Revenue (million) Forecast, by Application 2020 & 2033
- Table 42: Germany Vinyl Chloride Monomer Industry Volume (Million) Forecast, by Application 2020 & 2033
- Table 43: United Kingdom Vinyl Chloride Monomer Industry Revenue (million) Forecast, by Application 2020 & 2033
- Table 44: United Kingdom Vinyl Chloride Monomer Industry Volume (Million) Forecast, by Application 2020 & 2033
- Table 45: France Vinyl Chloride Monomer Industry Revenue (million) Forecast, by Application 2020 & 2033
- Table 46: France Vinyl Chloride Monomer Industry Volume (Million) Forecast, by Application 2020 & 2033
- Table 47: Italy Vinyl Chloride Monomer Industry Revenue (million) Forecast, by Application 2020 & 2033
- Table 48: Italy Vinyl Chloride Monomer Industry Volume (Million) Forecast, by Application 2020 & 2033
- Table 49: Rest of Europe Vinyl Chloride Monomer Industry Revenue (million) Forecast, by Application 2020 & 2033
- Table 50: Rest of Europe Vinyl Chloride Monomer Industry Volume (Million) Forecast, by Application 2020 & 2033
- Table 51: Global Vinyl Chloride Monomer Industry Revenue million Forecast, by Application 2020 & 2033
- Table 52: Global Vinyl Chloride Monomer Industry Volume Million Forecast, by Application 2020 & 2033
- Table 53: Global Vinyl Chloride Monomer Industry Revenue million Forecast, by End-user Industry 2020 & 2033
- Table 54: Global Vinyl Chloride Monomer Industry Volume Million Forecast, by End-user Industry 2020 & 2033
- Table 55: Global Vinyl Chloride Monomer Industry Revenue million Forecast, by Country 2020 & 2033
- Table 56: Global Vinyl Chloride Monomer Industry Volume Million Forecast, by Country 2020 & 2033
- Table 57: Brazil Vinyl Chloride Monomer Industry Revenue (million) Forecast, by Application 2020 & 2033
- Table 58: Brazil Vinyl Chloride Monomer Industry Volume (Million) Forecast, by Application 2020 & 2033
- Table 59: Argentina Vinyl Chloride Monomer Industry Revenue (million) Forecast, by Application 2020 & 2033
- Table 60: Argentina Vinyl Chloride Monomer Industry Volume (Million) Forecast, by Application 2020 & 2033
- Table 61: Rest of South America Vinyl Chloride Monomer Industry Revenue (million) Forecast, by Application 2020 & 2033
- Table 62: Rest of South America Vinyl Chloride Monomer Industry Volume (Million) Forecast, by Application 2020 & 2033
- Table 63: Global Vinyl Chloride Monomer Industry Revenue million Forecast, by Application 2020 & 2033
- Table 64: Global Vinyl Chloride Monomer Industry Volume Million Forecast, by Application 2020 & 2033
- Table 65: Global Vinyl Chloride Monomer Industry Revenue million Forecast, by End-user Industry 2020 & 2033
- Table 66: Global Vinyl Chloride Monomer Industry Volume Million Forecast, by End-user Industry 2020 & 2033
- Table 67: Global Vinyl Chloride Monomer Industry Revenue million Forecast, by Country 2020 & 2033
- Table 68: Global Vinyl Chloride Monomer Industry Volume Million Forecast, by Country 2020 & 2033
- Table 69: Saudi Arabia Vinyl Chloride Monomer Industry Revenue (million) Forecast, by Application 2020 & 2033
- Table 70: Saudi Arabia Vinyl Chloride Monomer Industry Volume (Million) Forecast, by Application 2020 & 2033
- Table 71: South Africa Vinyl Chloride Monomer Industry Revenue (million) Forecast, by Application 2020 & 2033
- Table 72: South Africa Vinyl Chloride Monomer Industry Volume (Million) Forecast, by Application 2020 & 2033
- Table 73: Rest of Middle East and Africa Vinyl Chloride Monomer Industry Revenue (million) Forecast, by Application 2020 & 2033
- Table 74: Rest of Middle East and Africa Vinyl Chloride Monomer Industry Volume (Million) Forecast, by Application 2020 & 2033
Frequently Asked Questions
1. What is the projected Compound Annual Growth Rate (CAGR) of the Vinyl Chloride Monomer Industry?
The projected CAGR is approximately 3.87%.
2. Which companies are prominent players in the Vinyl Chloride Monomer Industry?
Key companies in the market include Occidental Petroleum Corporation, Vinnolit GmbH & Co KG, AGC Chemicals, Ercros S A, The Chemson Group, Westlake Chemical Corporation*List Not Exhaustive, Olin Corporation, Reliance Industries Limited, Vynova Group, Tosoh Corporation, NOVA Chemicals, Dow, Mexichem, The Axiall Corporation, Shin-Etsu PVC B V.
3. What are the main segments of the Vinyl Chloride Monomer Industry?
The market segments include Application, End-user Industry .
4. Can you provide details about the market size?
The market size is estimated to be USD 47.15 million as of 2022.
5. What are some drivers contributing to market growth?
Rising Demand in Healthcare Sector; High Consumption from Building and Construction Industry.
6. What are the notable trends driving market growth?
Building and Construction Sector to Boost Market.
7. Are there any restraints impacting market growth?
Increasing Environmental Concerns and Availability of Substitutes in Various Applications; Other Restraints.
8. Can you provide examples of recent developments in the market?
April 2023: AGC developed Process Digital Twin for chemical plants and to begin the operation at its Vinyl Chloride Monomer manufacturing plant in Indonesia.
9. What pricing options are available for accessing the report?
Pricing options include single-user, multi-user, and enterprise licenses priced at USD 4750, USD 5250, and USD 8750 respectively.
10. Is the market size provided in terms of value or volume?
The market size is provided in terms of value, measured in million and volume, measured in Million.
11. Are there any specific market keywords associated with the report?
Yes, the market keyword associated with the report is "Vinyl Chloride Monomer Industry," which aids in identifying and referencing the specific market segment covered.
12. How do I determine which pricing option suits my needs best?
The pricing options vary based on user requirements and access needs. Individual users may opt for single-user licenses, while businesses requiring broader access may choose multi-user or enterprise licenses for cost-effective access to the report.
13. Are there any additional resources or data provided in the Vinyl Chloride Monomer Industry report?
While the report offers comprehensive insights, it's advisable to review the specific contents or supplementary materials provided to ascertain if additional resources or data are available.
14. How can I stay updated on further developments or reports in the Vinyl Chloride Monomer Industry?
To stay informed about further developments, trends, and reports in the Vinyl Chloride Monomer Industry, consider subscribing to industry newsletters, following relevant companies and organizations, or regularly checking reputable industry news sources and publications.
Methodology
Step 1 - Identification of Relevant Samples Size from Population Database


Step 2 - Approaches for Defining Global Market Size (Value, Volume* & Price*)

Note*: In applicable scenarios
Step 3 - Data Sources
Primary Research
- Web Analytics
- Survey Reports
- Research Institute
- Latest Research Reports
- Opinion Leaders
Secondary Research
- Annual Reports
- White Paper
- Latest Press Release
- Industry Association
- Paid Database
- Investor Presentations

Step 4 - Data Triangulation
Involves using different sources of information in order to increase the validity of a study
These sources are likely to be stakeholders in a program - participants, other researchers, program staff, other community members, and so on.
Then we put all data in single framework & apply various statistical tools to find out the dynamic on the market.
During the analysis stage, feedback from the stakeholder groups would be compared to determine areas of agreement as well as areas of divergence