

Key Insights
The European Virtual Visa Card Market is poised for remarkable expansion, with an estimated market size of 51.84 Million in the base year 2025 and a projected Compound Annual Growth Rate (CAGR) of 20.00% throughout the forecast period of 2025-2033. This robust growth is primarily fueled by the increasing adoption of digital payment solutions across both consumer and business segments. Key drivers include the escalating demand for enhanced security features offered by virtual cards, the convenience of immediate issuance and usage, and the growing preference for contactless transactions in an increasingly mobile-first world. Businesses are leveraging virtual cards for streamlined expense management, improved corporate purchasing controls, and optimized vendor payments, while consumers benefit from safer online transactions and greater control over their spending. The market is witnessing significant traction in B2B virtual cards, driven by the need for efficient procurement and expense management solutions for enterprises.
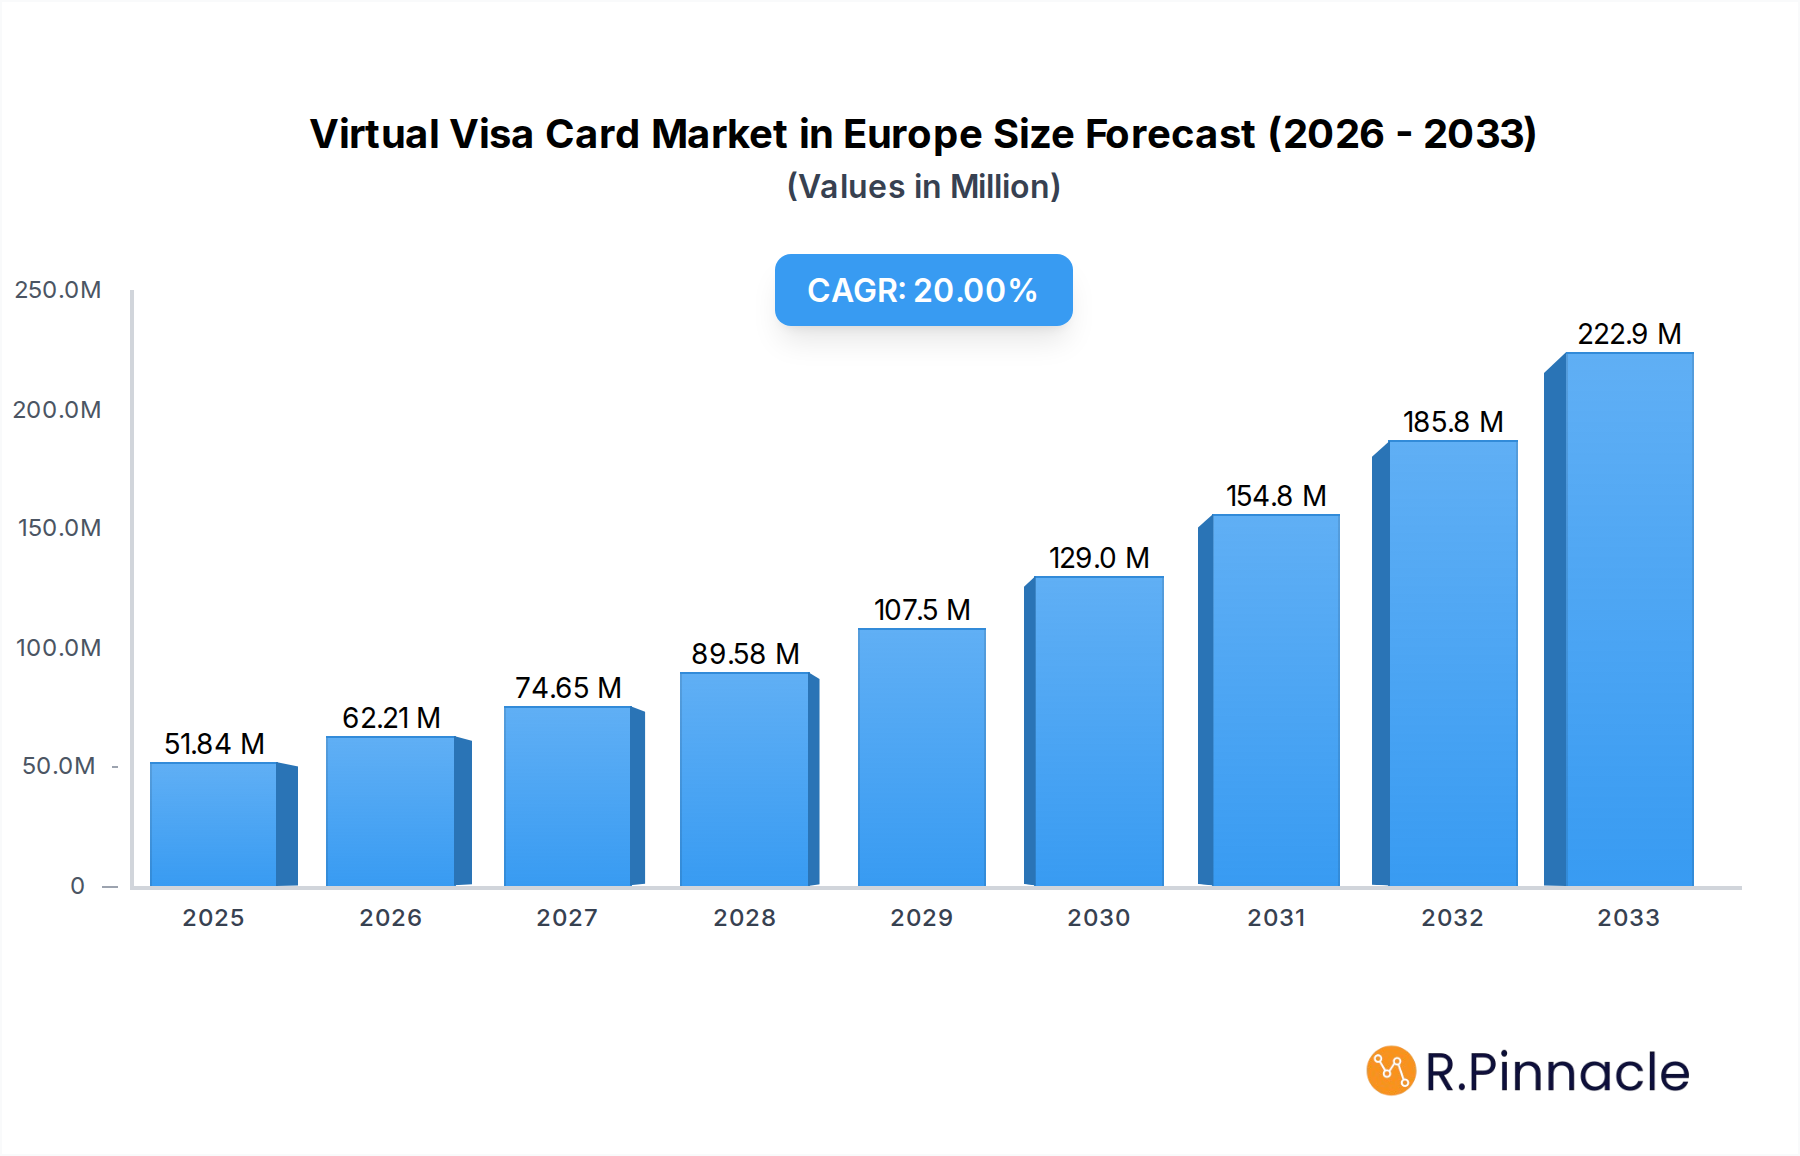
Virtual Visa Card Market in Europe Market Size (In Million)
Further propelling this growth are evolving market trends such as the integration of virtual cards with digital wallets and mobile banking applications, offering users seamless payment experiences. The rise of e-commerce and the burgeoning digital economy across Europe are creating fertile ground for virtual card solutions. While the market enjoys strong tailwinds, certain restraints may emerge, such as evolving regulatory landscapes in different European countries and the need for continuous technological innovation to stay ahead of emerging security threats. Nevertheless, the inherent benefits of virtual cards in terms of cost-effectiveness, transparency, and security are expected to outweigh these challenges, solidifying their position as a critical component of modern financial ecosystems in Europe. The market is characterized by intense competition among established players and innovative fintech startups, driving continuous product development and service enhancements.

Virtual Visa Card Market in Europe Company Market Share
Virtual Visa Card Market in Europe: Comprehensive Market Analysis & Future Projections (2019–2033)
Unlock the lucrative European virtual Visa card market with this in-depth, data-driven report. Explore key trends, growth drivers, competitive landscapes, and future opportunities shaping the industry from 2019 to 2033.
This comprehensive report provides actionable insights into the burgeoning European virtual Visa card market. Delve into market dynamics, understand dominant regional and segment performances, and gain a strategic advantage through detailed analysis of product innovations and industry developments. With projections extending to 2033, this report is an indispensable tool for payment processors, financial institutions, fintech innovators, and businesses seeking to capitalize on the rapid evolution of digital payments in Europe.
Virtual Visa Card Market in Europe Market Structure & Innovation Trends
The European virtual Visa card market exhibits a dynamic structure characterized by increasing market concentration driven by strategic partnerships and mergers, alongside continuous innovation. The market is fueled by the demand for enhanced security, streamlined payment processes, and greater control over expenditures for both consumers and businesses. Regulatory frameworks, particularly those surrounding data privacy and financial services (e.g., PSD2), play a crucial role in shaping product development and market entry strategies. Product substitutes, such as traditional physical cards and other digital payment methods, are present, but virtual Visa cards offer distinct advantages in terms of flexibility, cost-effectiveness, and security for specific use cases. End-user demographics are diverse, encompassing a broad spectrum of individuals seeking convenient payment solutions and businesses aiming to optimize corporate spending and supplier payments. Mergers and acquisitions (M&A) activities are on the rise as established players and emerging fintechs seek to expand their market reach, enhance technological capabilities, and consolidate market share. The value of M&A deals is projected to increase as the market matures and companies look for strategic growth avenues. Innovation drivers are primarily centered on developing user-friendly interfaces, advanced security features like tokenization, real-time transaction monitoring, and seamless integration with existing financial ecosystems.
- Market Concentration: Moderate to high, with key players actively pursuing strategic alliances and acquisitions to capture market share.
- Innovation Drivers: Enhanced security protocols, real-time analytics, API integrations, personalized user experiences, and cost efficiency.
- Regulatory Frameworks: PSD2, GDPR, and evolving AML/KYC regulations significantly influence product design and operational compliance.
- Product Substitutes: Physical Visa cards, alternative digital wallets, direct bank transfers, and other payment network solutions.
- End-User Demographics: Young, tech-savvy consumers, freelancers, SMEs, and large enterprises adopting digital transformation initiatives.
- M&A Activities: Increasing, with a focus on acquiring innovative technologies, expanding customer bases, and consolidating regional presence.
Virtual Visa Card Market in Europe Market Dynamics & Trends
The European virtual Visa card market is experiencing robust growth, driven by a confluence of technological advancements, evolving consumer preferences, and supportive industry trends. The CAGR for the virtual Visa card market in Europe is estimated at xx% for the forecast period 2025–2033, reflecting its significant expansion potential. Market penetration is steadily increasing, as more consumers and businesses recognize the inherent benefits of virtual cards over traditional payment methods. Technological disruptions, such as the widespread adoption of cloud computing, AI-powered fraud detection, and API-driven financial services, are fundamental to the development and deployment of innovative virtual card solutions. These technologies enable enhanced security features, personalized spending limits, real-time transaction reporting, and seamless integration into various digital platforms and workflows. Consumer preferences are shifting towards convenience, security, and granular control over their finances. Virtual Visa cards address these demands by offering instant issuance, the ability to create single-use or recurring virtual cards for specific transactions, and detailed spending analytics, all accessible via mobile devices. This has led to a surge in their adoption for e-commerce, subscription services, travel expenses, and corporate procurement. Competitive dynamics within the market are characterized by intense innovation, with new entrants challenging established financial institutions. Fintech companies are at the forefront of this disruption, offering agile and user-centric virtual card solutions that often integrate with broader financial management tools. The push towards digitalization across various industries, coupled with the increasing acceptance of contactless and online payments, further accelerates the adoption of virtual Visa cards. Furthermore, the growing focus on data security and the need to combat online fraud are compelling businesses and consumers alike to opt for the inherent security benefits of virtual cards, such as dynamic card numbers and spending controls. The expanding digital economy, with its increasing volume of online transactions, provides a fertile ground for the continued ascent of virtual Visa cards as a preferred payment instrument. The report will delve deeper into the specific catalysts behind this growth, including the role of open banking initiatives and the rise of the gig economy.
Dominant Regions & Segments in Virtual Visa Card Market in Europe
The European virtual Visa card market is characterized by distinct regional dominance and segment preferences. Western Europe, particularly countries like the United Kingdom, Germany, and France, currently represents the leading region in terms of market size and adoption. This dominance is attributed to several key drivers including:
- Economic Policies: Stable economic environments, strong purchasing power, and supportive government initiatives promoting digital transformation.
- Infrastructure: Advanced digital infrastructure, high internet penetration, and widespread availability of secure payment gateways.
- Consumer Demographics: A large, tech-savvy population with a high propensity for online shopping and adoption of innovative financial technologies.
- Business Landscape: A mature business ecosystem with a significant number of SMEs and large enterprises actively seeking efficient payment solutions.
Within this leading region, the B2B Virtual Cards segment is experiencing substantial growth, driven by the increasing need for businesses to manage employee expenses, streamline procurement processes, and enhance vendor payments. The ability to issue multiple virtual cards with specific spending limits and controls for different departments or employees makes B2B virtual cards highly attractive for cost management and fraud prevention. Companies are leveraging these solutions to gain better visibility and control over their corporate spending, leading to significant cost savings and operational efficiencies.
On the end-user front, Business use is a dominant factor in the current market landscape. Businesses are actively adopting virtual Visa cards for various purposes, including managing travel and entertainment expenses, facilitating online purchases for operational needs, and disbursing payments to freelancers and suppliers. The security features, such as the ability to set transaction limits and expiry dates, coupled with detailed reporting capabilities, provide businesses with unparalleled control and transparency over their financial outlays. This segment's dominance is further amplified by the ongoing digital transformation initiatives across European industries, pushing companies to adopt more efficient and secure payment methods.
While B2C segments are also growing, particularly B2C Remote Payments Virtual Cards for online shopping and recurring subscriptions, the scale and strategic implementation by businesses currently position them as the primary growth engine. The adoption of B2C POC Virtual Cards (presumably for specific, temporary online purchases or trials) is also on an upward trajectory, driven by the increasing prevalence of subscription-based services and the desire for secure, one-time payment solutions. However, the sheer volume of business transactions and the potential for significant cost savings make the business use case a more substantial contributor to the overall market value in the current phase.
Virtual Visa Card Market in Europe Product Innovations
Product innovations in the European virtual Visa card market are focused on enhancing user experience, security, and integration capabilities. Companies are introducing dynamic virtual card numbers that can be reissued instantly, offering unparalleled security for online transactions. Advanced features include granular spending controls, allowing users to set limits, restrict merchants, and define transaction types. Integration with budgeting apps and enterprise resource planning (ERP) systems provides seamless expense management and reconciliation. Tokenization technology further bolsters security by replacing sensitive card data with unique digital identifiers. These innovations aim to provide businesses and consumers with secure, flexible, and efficient payment solutions that cater to the evolving demands of the digital economy.
Report Scope & Segmentation Analysis
This report provides a comprehensive analysis of the European virtual Visa card market, segmented by product type and end-user. The product type segmentation includes: B2B Virtual cards, which are designed for corporate expense management, procurement, and supplier payments, offering features like spending controls, multi-user access, and detailed reporting; B2C Remote Payments Virtual Cards, catering to consumers for online shopping, subscription services, and other digital transactions requiring secure and flexible payment options; and B2C POC Virtual Cards, intended for specific, temporary online activities, often used for trials or limited-time offers, emphasizing ease of use and single-transaction security. The end-user segmentation covers: Consumer use, encompassing individual spending habits, e-commerce transactions, and personal finance management; and Business use, focusing on corporate expenditure, vendor payments, employee reimbursements, and supply chain finance. Market sizes and growth projections for each segment are detailed, along with an analysis of their respective competitive dynamics.
Key Drivers of Virtual Visa Card Market in Europe Growth
The growth of the virtual Visa card market in Europe is propelled by several key factors. The escalating demand for enhanced online payment security is paramount, as virtual cards offer superior protection against fraud compared to physical cards. The increasing adoption of e-commerce and digital subscription services, driven by changing consumer habits, directly fuels the need for convenient and secure digital payment solutions. Furthermore, businesses are increasingly recognizing the operational efficiencies and cost-saving benefits associated with virtual cards for expense management, procurement, and supplier payments. Favorable regulatory environments, particularly those promoting digital financial services and open banking, also contribute to market expansion.
Challenges in the Virtual Visa Card Market in Europe Sector
Despite its promising growth, the European virtual Visa card market faces several challenges. Regulatory compliance, particularly concerning data privacy (GDPR) and evolving financial regulations, can be complex and costly for service providers. Consumer education and awareness regarding the benefits and security of virtual cards remain a hurdle, as some individuals may be hesitant to adopt new payment technologies. Intense competition from established financial institutions and agile fintech startups can lead to pricing pressures and the need for continuous innovation. Moreover, the integration of virtual card solutions with legacy IT systems for businesses can present technical complexities and implementation delays.
Emerging Opportunities in Virtual Visa Card Market in Europe
Emerging opportunities in the European virtual Visa card market are abundant. The continued growth of the gig economy presents a significant opportunity for virtual cards designed for freelancer payments and expense management. The expansion of cross-border e-commerce will drive demand for virtual cards that offer simplified international transactions and currency conversion. The integration of virtual cards with emerging technologies like IoT devices for automated payments, and the development of specialized virtual card solutions for niche industries (e.g., healthcare, travel) represent further avenues for growth. The ongoing push for financial inclusion also opens doors for virtual card solutions tailored to underserved populations.
Leading Players in the Virtual Visa Card Market in Europe Market
- WEX Inc
- Skrill
- Qonto
- Marqeta Inc
- Stripe
- Mastercard Inc
- MineralTree
- Klarna
- Bunq
- Aion bank
- Monese Mastercard
- Revolut
- Wirecard
Key Developments in Virtual Visa Card Market in Europe Industry
- September 2023: Lloyds Bank launched a new virtual card for its businesses in partnership with Visa. The virtual card payment service will be available to Lloyds customers and is designed for users to control and track spending with the simplification of the payment process. Visa Commercial Pay exists as a virtual payment solution providing the technology to help businesses simplify and streamline their payments in a secure and controlled way.
- September 2023: Wallester, which operates in virtual card solutions, partnered with Transferra, which exists as a fintech provider in Europe. The partnership will be expanding Wallester's virtual card business in the European region and make its transactions more secure.
Future Outlook for Virtual Visa Card Market in Europe Market
The future outlook for the virtual Visa card market in Europe is exceptionally strong, driven by persistent digital transformation across all sectors. Continued innovation in security features, such as enhanced AI-powered fraud detection and biometric authentication, will further solidify consumer and business trust. The expansion of open banking initiatives will facilitate seamless integration of virtual card services with broader financial management ecosystems, offering a holistic view of finances. We anticipate a surge in the development of specialized virtual card solutions catering to specific industry needs and evolving consumer lifestyles, including subscription management tools and personalized spending analytics. Strategic partnerships between fintech companies and traditional financial institutions will continue to shape the market, driving wider adoption and accessibility. The increasing focus on sustainability and ethical consumption may also lead to virtual card features that promote responsible spending and carbon footprint tracking. Overall, the market is poised for sustained, significant growth, cementing virtual Visa cards as an indispensable component of the European digital payment landscape.
Virtual Visa Card Market in Europe Segmentation
-
1. Product type
- 1.1. B2B Virtual cards
- 1.2. B2C Remote Payments Virtual Cards
- 1.3. B2C POC Virtual Cards
-
2. End-user
- 2.1. Consumer use
- 2.2. Business use
Virtual Visa Card Market in Europe Segmentation By Geography
-
1. North America
- 1.1. United States
- 1.2. Canada
- 1.3. Mexico
-
2. South America
- 2.1. Brazil
- 2.2. Argentina
- 2.3. Rest of South America
-
3. Europe
- 3.1. United Kingdom
- 3.2. Germany
- 3.3. France
- 3.4. Italy
- 3.5. Spain
- 3.6. Russia
- 3.7. Benelux
- 3.8. Nordics
- 3.9. Rest of Europe
-
4. Middle East & Africa
- 4.1. Turkey
- 4.2. Israel
- 4.3. GCC
- 4.4. North Africa
- 4.5. South Africa
- 4.6. Rest of Middle East & Africa
-
5. Asia Pacific
- 5.1. China
- 5.2. India
- 5.3. Japan
- 5.4. South Korea
- 5.5. ASEAN
- 5.6. Oceania
- 5.7. Rest of Asia Pacific
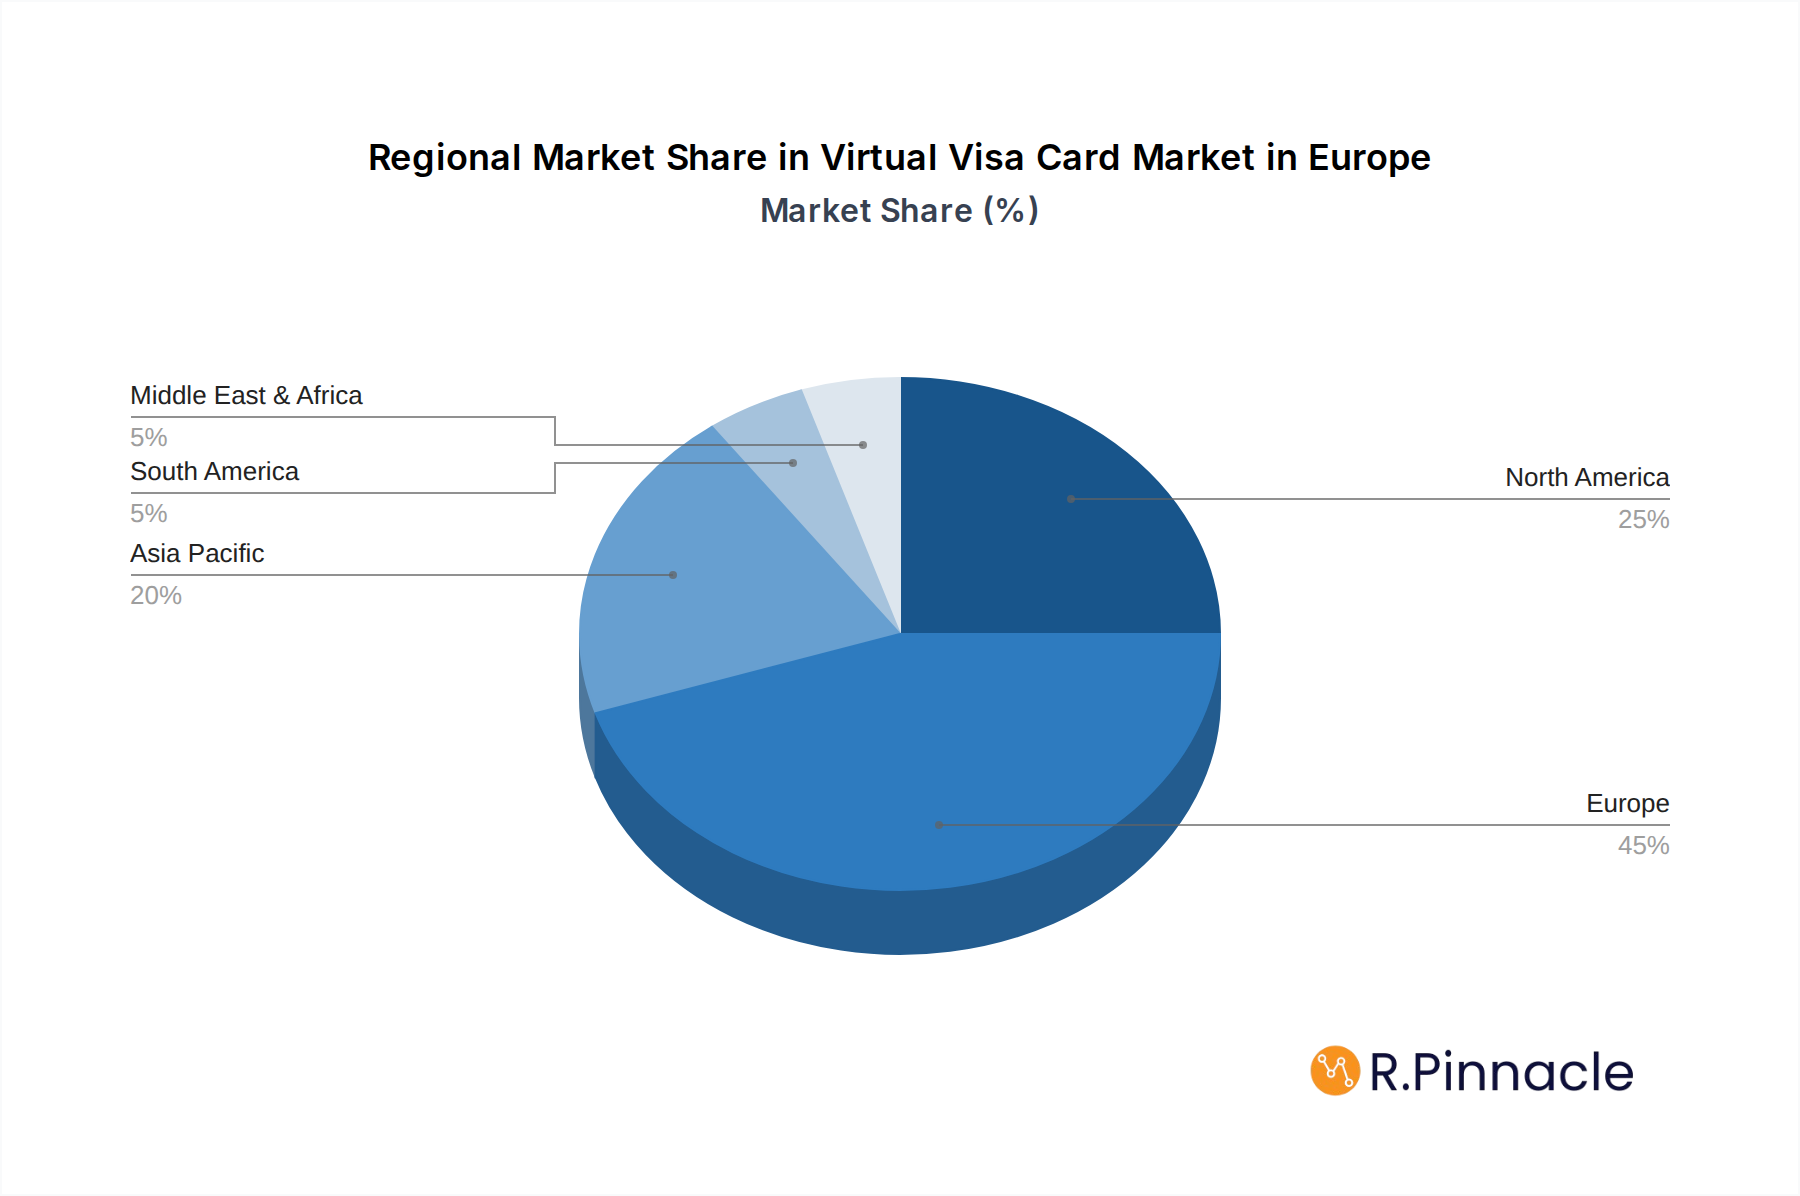
Virtual Visa Card Market in Europe Regional Market Share
Geographic Coverage of Virtual Visa Card Market in Europe
Virtual Visa Card Market in Europe REPORT HIGHLIGHTS
| Aspects | Details |
|---|---|
| Study Period | 2020-2034 |
| Base Year | 2025 |
| Estimated Year | 2026 |
| Forecast Period | 2026-2034 |
| Historical Period | 2020-2025 |
| Growth Rate | CAGR of 20.00% from 2020-2034 |
| Segmentation |
|
Table of Contents
- 1. Introduction
- 1.1. Research Scope
- 1.2. Market Segmentation
- 1.3. Research Objective
- 1.4. Definitions and Assumptions
- 2. Executive Summary
- 2.1. Market Snapshot
- 3. Market Dynamics
- 3.1. Market Drivers
- 3.2. Market Restrains
- 3.3. Market Trends
- 3.4. Market Opportunities
- 4. Market Factor Analysis
- 4.1. Porters Five Forces
- 4.1.1. Bargaining Power of Suppliers
- 4.1.2. Bargaining Power of Buyers
- 4.1.3. Threat of New Entrants
- 4.1.4. Threat of Substitutes
- 4.1.5. Competitive Rivalry
- 4.2. PESTEL analysis
- 4.3. BCG Analysis
- 4.3.1. Stars (High Growth, High Market Share)
- 4.3.2. Cash Cows (Low Growth, High Market Share)
- 4.3.3. Question Mark (High Growth, Low Market Share)
- 4.3.4. Dogs (Low Growth, Low Market Share)
- 4.4. Ansoff Matrix Analysis
- 4.5. Supply Chain Analysis
- 4.6. Regulatory Landscape
- 4.7. Current Market Potential and Opportunity Assessment (TAM–SAM–SOM Framework)
- 4.8. PRI Analyst Note
- 4.1. Porters Five Forces
- 5. Market Analysis, Insights and Forecast 2021-2033
- 5.1. Market Analysis, Insights and Forecast - by Product type
- 5.1.1. B2B Virtual cards
- 5.1.2. B2C Remote Payments Virtual Cards
- 5.1.3. B2C POC Virtual Cards
- 5.2. Market Analysis, Insights and Forecast - by End-user
- 5.2.1. Consumer use
- 5.2.2. Business use
- 5.3. Market Analysis, Insights and Forecast - by Region
- 5.3.1. North America
- 5.3.2. South America
- 5.3.3. Europe
- 5.3.4. Middle East & Africa
- 5.3.5. Asia Pacific
- 5.1. Market Analysis, Insights and Forecast - by Product type
- 6. Global Virtual Visa Card Market in Europe Analysis, Insights and Forecast, 2021-2033
- 6.1. Market Analysis, Insights and Forecast - by Product type
- 6.1.1. B2B Virtual cards
- 6.1.2. B2C Remote Payments Virtual Cards
- 6.1.3. B2C POC Virtual Cards
- 6.2. Market Analysis, Insights and Forecast - by End-user
- 6.2.1. Consumer use
- 6.2.2. Business use
- 6.1. Market Analysis, Insights and Forecast - by Product type
- 7. North America Virtual Visa Card Market in Europe Analysis, Insights and Forecast, 2020-2032
- 7.1. Market Analysis, Insights and Forecast - by Product type
- 7.1.1. B2B Virtual cards
- 7.1.2. B2C Remote Payments Virtual Cards
- 7.1.3. B2C POC Virtual Cards
- 7.2. Market Analysis, Insights and Forecast - by End-user
- 7.2.1. Consumer use
- 7.2.2. Business use
- 7.1. Market Analysis, Insights and Forecast - by Product type
- 8. South America Virtual Visa Card Market in Europe Analysis, Insights and Forecast, 2020-2032
- 8.1. Market Analysis, Insights and Forecast - by Product type
- 8.1.1. B2B Virtual cards
- 8.1.2. B2C Remote Payments Virtual Cards
- 8.1.3. B2C POC Virtual Cards
- 8.2. Market Analysis, Insights and Forecast - by End-user
- 8.2.1. Consumer use
- 8.2.2. Business use
- 8.1. Market Analysis, Insights and Forecast - by Product type
- 9. Europe Virtual Visa Card Market in Europe Analysis, Insights and Forecast, 2020-2032
- 9.1. Market Analysis, Insights and Forecast - by Product type
- 9.1.1. B2B Virtual cards
- 9.1.2. B2C Remote Payments Virtual Cards
- 9.1.3. B2C POC Virtual Cards
- 9.2. Market Analysis, Insights and Forecast - by End-user
- 9.2.1. Consumer use
- 9.2.2. Business use
- 9.1. Market Analysis, Insights and Forecast - by Product type
- 10. Middle East & Africa Virtual Visa Card Market in Europe Analysis, Insights and Forecast, 2020-2032
- 10.1. Market Analysis, Insights and Forecast - by Product type
- 10.1.1. B2B Virtual cards
- 10.1.2. B2C Remote Payments Virtual Cards
- 10.1.3. B2C POC Virtual Cards
- 10.2. Market Analysis, Insights and Forecast - by End-user
- 10.2.1. Consumer use
- 10.2.2. Business use
- 10.1. Market Analysis, Insights and Forecast - by Product type
- 11. Asia Pacific Virtual Visa Card Market in Europe Analysis, Insights and Forecast, 2020-2032
- 11.1. Market Analysis, Insights and Forecast - by Product type
- 11.1.1. B2B Virtual cards
- 11.1.2. B2C Remote Payments Virtual Cards
- 11.1.3. B2C POC Virtual Cards
- 11.2. Market Analysis, Insights and Forecast - by End-user
- 11.2.1. Consumer use
- 11.2.2. Business use
- 11.1. Market Analysis, Insights and Forecast - by Product type
- 12. Competitive Analysis
- 12.1. Company Profiles
- 12.1.1 WEX Inc
- 12.1.1.1. Company Overview
- 12.1.1.2. Products
- 12.1.1.3. Company Financials
- 12.1.1.4. SWOT Analysis
- 12.1.2 Skrill
- 12.1.2.1. Company Overview
- 12.1.2.2. Products
- 12.1.2.3. Company Financials
- 12.1.2.4. SWOT Analysis
- 12.1.3 Qonto
- 12.1.3.1. Company Overview
- 12.1.3.2. Products
- 12.1.3.3. Company Financials
- 12.1.3.4. SWOT Analysis
- 12.1.4 Marqeta Inc
- 12.1.4.1. Company Overview
- 12.1.4.2. Products
- 12.1.4.3. Company Financials
- 12.1.4.4. SWOT Analysis
- 12.1.5 Stripe
- 12.1.5.1. Company Overview
- 12.1.5.2. Products
- 12.1.5.3. Company Financials
- 12.1.5.4. SWOT Analysis
- 12.1.6 Master card Inc
- 12.1.6.1. Company Overview
- 12.1.6.2. Products
- 12.1.6.3. Company Financials
- 12.1.6.4. SWOT Analysis
- 12.1.7 MineralTree
- 12.1.7.1. Company Overview
- 12.1.7.2. Products
- 12.1.7.3. Company Financials
- 12.1.7.4. SWOT Analysis
- 12.1.8 Klarna
- 12.1.8.1. Company Overview
- 12.1.8.2. Products
- 12.1.8.3. Company Financials
- 12.1.8.4. SWOT Analysis
- 12.1.9 Bunq
- 12.1.9.1. Company Overview
- 12.1.9.2. Products
- 12.1.9.3. Company Financials
- 12.1.9.4. SWOT Analysis
- 12.1.10 Aion bank
- 12.1.10.1. Company Overview
- 12.1.10.2. Products
- 12.1.10.3. Company Financials
- 12.1.10.4. SWOT Analysis
- 12.1.11 Monese Mastercard
- 12.1.11.1. Company Overview
- 12.1.11.2. Products
- 12.1.11.3. Company Financials
- 12.1.11.4. SWOT Analysis
- 12.1.12 Revolut
- 12.1.12.1. Company Overview
- 12.1.12.2. Products
- 12.1.12.3. Company Financials
- 12.1.12.4. SWOT Analysis
- 12.1.13 Wirecard**List Not Exhaustive
- 12.1.13.1. Company Overview
- 12.1.13.2. Products
- 12.1.13.3. Company Financials
- 12.1.13.4. SWOT Analysis
- 12.1.1 WEX Inc
- 12.2. Market Entropy
- 12.2.1 Company's Key Areas Served
- 12.2.2 Recent Developments
- 12.3. Company Market Share Analysis 2025
- 12.3.1 Top 5 Companies Market Share Analysis
- 12.3.2 Top 3 Companies Market Share Analysis
- 12.4. List of Potential Customers
- 13. Research Methodology
List of Figures
- Figure 1: Global Virtual Visa Card Market in Europe Revenue Breakdown (Million, %) by Region 2025 & 2033
- Figure 2: Global Virtual Visa Card Market in Europe Volume Breakdown (Billion, %) by Region 2025 & 2033
- Figure 3: North America Virtual Visa Card Market in Europe Revenue (Million), by Product type 2025 & 2033
- Figure 4: North America Virtual Visa Card Market in Europe Volume (Billion), by Product type 2025 & 2033
- Figure 5: North America Virtual Visa Card Market in Europe Revenue Share (%), by Product type 2025 & 2033
- Figure 6: North America Virtual Visa Card Market in Europe Volume Share (%), by Product type 2025 & 2033
- Figure 7: North America Virtual Visa Card Market in Europe Revenue (Million), by End-user 2025 & 2033
- Figure 8: North America Virtual Visa Card Market in Europe Volume (Billion), by End-user 2025 & 2033
- Figure 9: North America Virtual Visa Card Market in Europe Revenue Share (%), by End-user 2025 & 2033
- Figure 10: North America Virtual Visa Card Market in Europe Volume Share (%), by End-user 2025 & 2033
- Figure 11: North America Virtual Visa Card Market in Europe Revenue (Million), by Country 2025 & 2033
- Figure 12: North America Virtual Visa Card Market in Europe Volume (Billion), by Country 2025 & 2033
- Figure 13: North America Virtual Visa Card Market in Europe Revenue Share (%), by Country 2025 & 2033
- Figure 14: North America Virtual Visa Card Market in Europe Volume Share (%), by Country 2025 & 2033
- Figure 15: South America Virtual Visa Card Market in Europe Revenue (Million), by Product type 2025 & 2033
- Figure 16: South America Virtual Visa Card Market in Europe Volume (Billion), by Product type 2025 & 2033
- Figure 17: South America Virtual Visa Card Market in Europe Revenue Share (%), by Product type 2025 & 2033
- Figure 18: South America Virtual Visa Card Market in Europe Volume Share (%), by Product type 2025 & 2033
- Figure 19: South America Virtual Visa Card Market in Europe Revenue (Million), by End-user 2025 & 2033
- Figure 20: South America Virtual Visa Card Market in Europe Volume (Billion), by End-user 2025 & 2033
- Figure 21: South America Virtual Visa Card Market in Europe Revenue Share (%), by End-user 2025 & 2033
- Figure 22: South America Virtual Visa Card Market in Europe Volume Share (%), by End-user 2025 & 2033
- Figure 23: South America Virtual Visa Card Market in Europe Revenue (Million), by Country 2025 & 2033
- Figure 24: South America Virtual Visa Card Market in Europe Volume (Billion), by Country 2025 & 2033
- Figure 25: South America Virtual Visa Card Market in Europe Revenue Share (%), by Country 2025 & 2033
- Figure 26: South America Virtual Visa Card Market in Europe Volume Share (%), by Country 2025 & 2033
- Figure 27: Europe Virtual Visa Card Market in Europe Revenue (Million), by Product type 2025 & 2033
- Figure 28: Europe Virtual Visa Card Market in Europe Volume (Billion), by Product type 2025 & 2033
- Figure 29: Europe Virtual Visa Card Market in Europe Revenue Share (%), by Product type 2025 & 2033
- Figure 30: Europe Virtual Visa Card Market in Europe Volume Share (%), by Product type 2025 & 2033
- Figure 31: Europe Virtual Visa Card Market in Europe Revenue (Million), by End-user 2025 & 2033
- Figure 32: Europe Virtual Visa Card Market in Europe Volume (Billion), by End-user 2025 & 2033
- Figure 33: Europe Virtual Visa Card Market in Europe Revenue Share (%), by End-user 2025 & 2033
- Figure 34: Europe Virtual Visa Card Market in Europe Volume Share (%), by End-user 2025 & 2033
- Figure 35: Europe Virtual Visa Card Market in Europe Revenue (Million), by Country 2025 & 2033
- Figure 36: Europe Virtual Visa Card Market in Europe Volume (Billion), by Country 2025 & 2033
- Figure 37: Europe Virtual Visa Card Market in Europe Revenue Share (%), by Country 2025 & 2033
- Figure 38: Europe Virtual Visa Card Market in Europe Volume Share (%), by Country 2025 & 2033
- Figure 39: Middle East & Africa Virtual Visa Card Market in Europe Revenue (Million), by Product type 2025 & 2033
- Figure 40: Middle East & Africa Virtual Visa Card Market in Europe Volume (Billion), by Product type 2025 & 2033
- Figure 41: Middle East & Africa Virtual Visa Card Market in Europe Revenue Share (%), by Product type 2025 & 2033
- Figure 42: Middle East & Africa Virtual Visa Card Market in Europe Volume Share (%), by Product type 2025 & 2033
- Figure 43: Middle East & Africa Virtual Visa Card Market in Europe Revenue (Million), by End-user 2025 & 2033
- Figure 44: Middle East & Africa Virtual Visa Card Market in Europe Volume (Billion), by End-user 2025 & 2033
- Figure 45: Middle East & Africa Virtual Visa Card Market in Europe Revenue Share (%), by End-user 2025 & 2033
- Figure 46: Middle East & Africa Virtual Visa Card Market in Europe Volume Share (%), by End-user 2025 & 2033
- Figure 47: Middle East & Africa Virtual Visa Card Market in Europe Revenue (Million), by Country 2025 & 2033
- Figure 48: Middle East & Africa Virtual Visa Card Market in Europe Volume (Billion), by Country 2025 & 2033
- Figure 49: Middle East & Africa Virtual Visa Card Market in Europe Revenue Share (%), by Country 2025 & 2033
- Figure 50: Middle East & Africa Virtual Visa Card Market in Europe Volume Share (%), by Country 2025 & 2033
- Figure 51: Asia Pacific Virtual Visa Card Market in Europe Revenue (Million), by Product type 2025 & 2033
- Figure 52: Asia Pacific Virtual Visa Card Market in Europe Volume (Billion), by Product type 2025 & 2033
- Figure 53: Asia Pacific Virtual Visa Card Market in Europe Revenue Share (%), by Product type 2025 & 2033
- Figure 54: Asia Pacific Virtual Visa Card Market in Europe Volume Share (%), by Product type 2025 & 2033
- Figure 55: Asia Pacific Virtual Visa Card Market in Europe Revenue (Million), by End-user 2025 & 2033
- Figure 56: Asia Pacific Virtual Visa Card Market in Europe Volume (Billion), by End-user 2025 & 2033
- Figure 57: Asia Pacific Virtual Visa Card Market in Europe Revenue Share (%), by End-user 2025 & 2033
- Figure 58: Asia Pacific Virtual Visa Card Market in Europe Volume Share (%), by End-user 2025 & 2033
- Figure 59: Asia Pacific Virtual Visa Card Market in Europe Revenue (Million), by Country 2025 & 2033
- Figure 60: Asia Pacific Virtual Visa Card Market in Europe Volume (Billion), by Country 2025 & 2033
- Figure 61: Asia Pacific Virtual Visa Card Market in Europe Revenue Share (%), by Country 2025 & 2033
- Figure 62: Asia Pacific Virtual Visa Card Market in Europe Volume Share (%), by Country 2025 & 2033
List of Tables
- Table 1: Global Virtual Visa Card Market in Europe Revenue Million Forecast, by Product type 2020 & 2033
- Table 2: Global Virtual Visa Card Market in Europe Volume Billion Forecast, by Product type 2020 & 2033
- Table 3: Global Virtual Visa Card Market in Europe Revenue Million Forecast, by End-user 2020 & 2033
- Table 4: Global Virtual Visa Card Market in Europe Volume Billion Forecast, by End-user 2020 & 2033
- Table 5: Global Virtual Visa Card Market in Europe Revenue Million Forecast, by Region 2020 & 2033
- Table 6: Global Virtual Visa Card Market in Europe Volume Billion Forecast, by Region 2020 & 2033
- Table 7: Global Virtual Visa Card Market in Europe Revenue Million Forecast, by Product type 2020 & 2033
- Table 8: Global Virtual Visa Card Market in Europe Volume Billion Forecast, by Product type 2020 & 2033
- Table 9: Global Virtual Visa Card Market in Europe Revenue Million Forecast, by End-user 2020 & 2033
- Table 10: Global Virtual Visa Card Market in Europe Volume Billion Forecast, by End-user 2020 & 2033
- Table 11: Global Virtual Visa Card Market in Europe Revenue Million Forecast, by Country 2020 & 2033
- Table 12: Global Virtual Visa Card Market in Europe Volume Billion Forecast, by Country 2020 & 2033
- Table 13: United States Virtual Visa Card Market in Europe Revenue (Million) Forecast, by Application 2020 & 2033
- Table 14: United States Virtual Visa Card Market in Europe Volume (Billion) Forecast, by Application 2020 & 2033
- Table 15: Canada Virtual Visa Card Market in Europe Revenue (Million) Forecast, by Application 2020 & 2033
- Table 16: Canada Virtual Visa Card Market in Europe Volume (Billion) Forecast, by Application 2020 & 2033
- Table 17: Mexico Virtual Visa Card Market in Europe Revenue (Million) Forecast, by Application 2020 & 2033
- Table 18: Mexico Virtual Visa Card Market in Europe Volume (Billion) Forecast, by Application 2020 & 2033
- Table 19: Global Virtual Visa Card Market in Europe Revenue Million Forecast, by Product type 2020 & 2033
- Table 20: Global Virtual Visa Card Market in Europe Volume Billion Forecast, by Product type 2020 & 2033
- Table 21: Global Virtual Visa Card Market in Europe Revenue Million Forecast, by End-user 2020 & 2033
- Table 22: Global Virtual Visa Card Market in Europe Volume Billion Forecast, by End-user 2020 & 2033
- Table 23: Global Virtual Visa Card Market in Europe Revenue Million Forecast, by Country 2020 & 2033
- Table 24: Global Virtual Visa Card Market in Europe Volume Billion Forecast, by Country 2020 & 2033
- Table 25: Brazil Virtual Visa Card Market in Europe Revenue (Million) Forecast, by Application 2020 & 2033
- Table 26: Brazil Virtual Visa Card Market in Europe Volume (Billion) Forecast, by Application 2020 & 2033
- Table 27: Argentina Virtual Visa Card Market in Europe Revenue (Million) Forecast, by Application 2020 & 2033
- Table 28: Argentina Virtual Visa Card Market in Europe Volume (Billion) Forecast, by Application 2020 & 2033
- Table 29: Rest of South America Virtual Visa Card Market in Europe Revenue (Million) Forecast, by Application 2020 & 2033
- Table 30: Rest of South America Virtual Visa Card Market in Europe Volume (Billion) Forecast, by Application 2020 & 2033
- Table 31: Global Virtual Visa Card Market in Europe Revenue Million Forecast, by Product type 2020 & 2033
- Table 32: Global Virtual Visa Card Market in Europe Volume Billion Forecast, by Product type 2020 & 2033
- Table 33: Global Virtual Visa Card Market in Europe Revenue Million Forecast, by End-user 2020 & 2033
- Table 34: Global Virtual Visa Card Market in Europe Volume Billion Forecast, by End-user 2020 & 2033
- Table 35: Global Virtual Visa Card Market in Europe Revenue Million Forecast, by Country 2020 & 2033
- Table 36: Global Virtual Visa Card Market in Europe Volume Billion Forecast, by Country 2020 & 2033
- Table 37: United Kingdom Virtual Visa Card Market in Europe Revenue (Million) Forecast, by Application 2020 & 2033
- Table 38: United Kingdom Virtual Visa Card Market in Europe Volume (Billion) Forecast, by Application 2020 & 2033
- Table 39: Germany Virtual Visa Card Market in Europe Revenue (Million) Forecast, by Application 2020 & 2033
- Table 40: Germany Virtual Visa Card Market in Europe Volume (Billion) Forecast, by Application 2020 & 2033
- Table 41: France Virtual Visa Card Market in Europe Revenue (Million) Forecast, by Application 2020 & 2033
- Table 42: France Virtual Visa Card Market in Europe Volume (Billion) Forecast, by Application 2020 & 2033
- Table 43: Italy Virtual Visa Card Market in Europe Revenue (Million) Forecast, by Application 2020 & 2033
- Table 44: Italy Virtual Visa Card Market in Europe Volume (Billion) Forecast, by Application 2020 & 2033
- Table 45: Spain Virtual Visa Card Market in Europe Revenue (Million) Forecast, by Application 2020 & 2033
- Table 46: Spain Virtual Visa Card Market in Europe Volume (Billion) Forecast, by Application 2020 & 2033
- Table 47: Russia Virtual Visa Card Market in Europe Revenue (Million) Forecast, by Application 2020 & 2033
- Table 48: Russia Virtual Visa Card Market in Europe Volume (Billion) Forecast, by Application 2020 & 2033
- Table 49: Benelux Virtual Visa Card Market in Europe Revenue (Million) Forecast, by Application 2020 & 2033
- Table 50: Benelux Virtual Visa Card Market in Europe Volume (Billion) Forecast, by Application 2020 & 2033
- Table 51: Nordics Virtual Visa Card Market in Europe Revenue (Million) Forecast, by Application 2020 & 2033
- Table 52: Nordics Virtual Visa Card Market in Europe Volume (Billion) Forecast, by Application 2020 & 2033
- Table 53: Rest of Europe Virtual Visa Card Market in Europe Revenue (Million) Forecast, by Application 2020 & 2033
- Table 54: Rest of Europe Virtual Visa Card Market in Europe Volume (Billion) Forecast, by Application 2020 & 2033
- Table 55: Global Virtual Visa Card Market in Europe Revenue Million Forecast, by Product type 2020 & 2033
- Table 56: Global Virtual Visa Card Market in Europe Volume Billion Forecast, by Product type 2020 & 2033
- Table 57: Global Virtual Visa Card Market in Europe Revenue Million Forecast, by End-user 2020 & 2033
- Table 58: Global Virtual Visa Card Market in Europe Volume Billion Forecast, by End-user 2020 & 2033
- Table 59: Global Virtual Visa Card Market in Europe Revenue Million Forecast, by Country 2020 & 2033
- Table 60: Global Virtual Visa Card Market in Europe Volume Billion Forecast, by Country 2020 & 2033
- Table 61: Turkey Virtual Visa Card Market in Europe Revenue (Million) Forecast, by Application 2020 & 2033
- Table 62: Turkey Virtual Visa Card Market in Europe Volume (Billion) Forecast, by Application 2020 & 2033
- Table 63: Israel Virtual Visa Card Market in Europe Revenue (Million) Forecast, by Application 2020 & 2033
- Table 64: Israel Virtual Visa Card Market in Europe Volume (Billion) Forecast, by Application 2020 & 2033
- Table 65: GCC Virtual Visa Card Market in Europe Revenue (Million) Forecast, by Application 2020 & 2033
- Table 66: GCC Virtual Visa Card Market in Europe Volume (Billion) Forecast, by Application 2020 & 2033
- Table 67: North Africa Virtual Visa Card Market in Europe Revenue (Million) Forecast, by Application 2020 & 2033
- Table 68: North Africa Virtual Visa Card Market in Europe Volume (Billion) Forecast, by Application 2020 & 2033
- Table 69: South Africa Virtual Visa Card Market in Europe Revenue (Million) Forecast, by Application 2020 & 2033
- Table 70: South Africa Virtual Visa Card Market in Europe Volume (Billion) Forecast, by Application 2020 & 2033
- Table 71: Rest of Middle East & Africa Virtual Visa Card Market in Europe Revenue (Million) Forecast, by Application 2020 & 2033
- Table 72: Rest of Middle East & Africa Virtual Visa Card Market in Europe Volume (Billion) Forecast, by Application 2020 & 2033
- Table 73: Global Virtual Visa Card Market in Europe Revenue Million Forecast, by Product type 2020 & 2033
- Table 74: Global Virtual Visa Card Market in Europe Volume Billion Forecast, by Product type 2020 & 2033
- Table 75: Global Virtual Visa Card Market in Europe Revenue Million Forecast, by End-user 2020 & 2033
- Table 76: Global Virtual Visa Card Market in Europe Volume Billion Forecast, by End-user 2020 & 2033
- Table 77: Global Virtual Visa Card Market in Europe Revenue Million Forecast, by Country 2020 & 2033
- Table 78: Global Virtual Visa Card Market in Europe Volume Billion Forecast, by Country 2020 & 2033
- Table 79: China Virtual Visa Card Market in Europe Revenue (Million) Forecast, by Application 2020 & 2033
- Table 80: China Virtual Visa Card Market in Europe Volume (Billion) Forecast, by Application 2020 & 2033
- Table 81: India Virtual Visa Card Market in Europe Revenue (Million) Forecast, by Application 2020 & 2033
- Table 82: India Virtual Visa Card Market in Europe Volume (Billion) Forecast, by Application 2020 & 2033
- Table 83: Japan Virtual Visa Card Market in Europe Revenue (Million) Forecast, by Application 2020 & 2033
- Table 84: Japan Virtual Visa Card Market in Europe Volume (Billion) Forecast, by Application 2020 & 2033
- Table 85: South Korea Virtual Visa Card Market in Europe Revenue (Million) Forecast, by Application 2020 & 2033
- Table 86: South Korea Virtual Visa Card Market in Europe Volume (Billion) Forecast, by Application 2020 & 2033
- Table 87: ASEAN Virtual Visa Card Market in Europe Revenue (Million) Forecast, by Application 2020 & 2033
- Table 88: ASEAN Virtual Visa Card Market in Europe Volume (Billion) Forecast, by Application 2020 & 2033
- Table 89: Oceania Virtual Visa Card Market in Europe Revenue (Million) Forecast, by Application 2020 & 2033
- Table 90: Oceania Virtual Visa Card Market in Europe Volume (Billion) Forecast, by Application 2020 & 2033
- Table 91: Rest of Asia Pacific Virtual Visa Card Market in Europe Revenue (Million) Forecast, by Application 2020 & 2033
- Table 92: Rest of Asia Pacific Virtual Visa Card Market in Europe Volume (Billion) Forecast, by Application 2020 & 2033
Frequently Asked Questions
1. What is the projected Compound Annual Growth Rate (CAGR) of the Virtual Visa Card Market in Europe?
The projected CAGR is approximately 20.00%.
2. Which companies are prominent players in the Virtual Visa Card Market in Europe?
Key companies in the market include WEX Inc, Skrill, Qonto, Marqeta Inc, Stripe, Master card Inc, MineralTree, Klarna, Bunq, Aion bank, Monese Mastercard, Revolut, Wirecard**List Not Exhaustive.
3. What are the main segments of the Virtual Visa Card Market in Europe?
The market segments include Product type, End-user.
4. Can you provide details about the market size?
The market size is estimated to be USD 51.84 Million as of 2022.
5. What are some drivers contributing to market growth?
Rising in Adoption of Digital Payment Method; Increase in Adoption of Virtual Card Payments by E-Commerce Business.
6. What are the notable trends driving market growth?
Rising Digital Payment.
7. Are there any restraints impacting market growth?
Rising in Adoption of Digital Payment Method; Increase in Adoption of Virtual Card Payments by E-Commerce Business.
8. Can you provide examples of recent developments in the market?
In September 2023, Lloyds Bank launched a new virtual card for its businesses in partnership with Visa. The virtual card payment service will be available to Lloyds customers and is designed for users to control and track spending with the simplification of the payment process. Visa Commercial Pay exists as a virtual payment solution providing the technology to help businesses simplify and streamline their payments in a secure and controlled way.
9. What pricing options are available for accessing the report?
Pricing options include single-user, multi-user, and enterprise licenses priced at USD 4750, USD 4950, and USD 6800 respectively.
10. Is the market size provided in terms of value or volume?
The market size is provided in terms of value, measured in Million and volume, measured in Billion.
11. Are there any specific market keywords associated with the report?
Yes, the market keyword associated with the report is "Virtual Visa Card Market in Europe," which aids in identifying and referencing the specific market segment covered.
12. How do I determine which pricing option suits my needs best?
The pricing options vary based on user requirements and access needs. Individual users may opt for single-user licenses, while businesses requiring broader access may choose multi-user or enterprise licenses for cost-effective access to the report.
13. Are there any additional resources or data provided in the Virtual Visa Card Market in Europe report?
While the report offers comprehensive insights, it's advisable to review the specific contents or supplementary materials provided to ascertain if additional resources or data are available.
14. How can I stay updated on further developments or reports in the Virtual Visa Card Market in Europe?
To stay informed about further developments, trends, and reports in the Virtual Visa Card Market in Europe, consider subscribing to industry newsletters, following relevant companies and organizations, or regularly checking reputable industry news sources and publications.
Methodology
Step 1 - Identification of Relevant Samples Size from Population Database


Step 2 - Approaches for Defining Global Market Size (Value, Volume* & Price*)

Note*: In applicable scenarios
Step 3 - Data Sources
Primary Research
- Web Analytics
- Survey Reports
- Research Institute
- Latest Research Reports
- Opinion Leaders
Secondary Research
- Annual Reports
- White Paper
- Latest Press Release
- Industry Association
- Paid Database
- Investor Presentations

Step 4 - Data Triangulation
Involves using different sources of information in order to increase the validity of a study
These sources are likely to be stakeholders in a program - participants, other researchers, program staff, other community members, and so on.
Then we put all data in single framework & apply various statistical tools to find out the dynamic on the market.
During the analysis stage, feedback from the stakeholder groups would be compared to determine areas of agreement as well as areas of divergence