

Key Insights
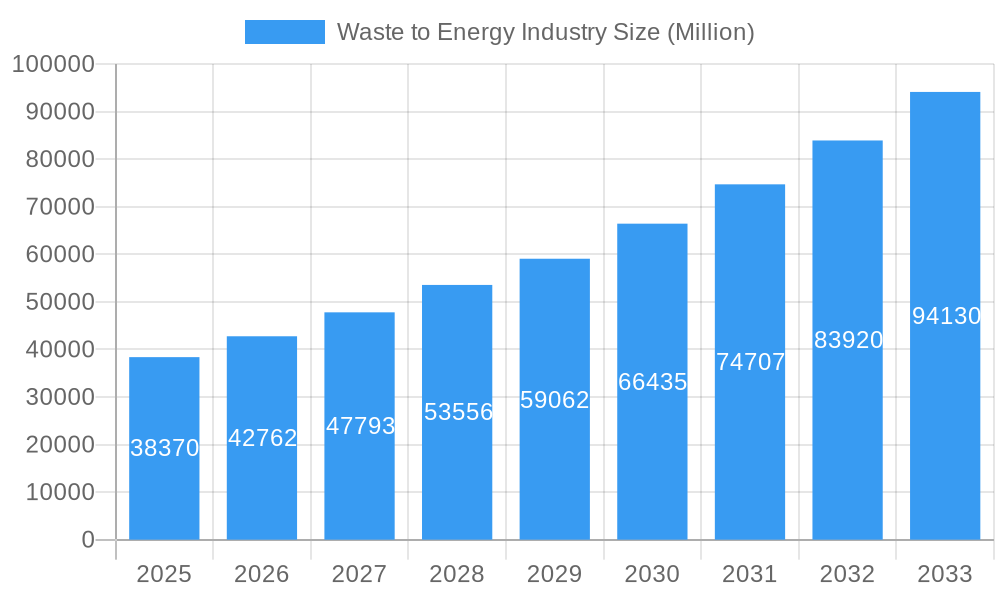
The global waste-to-energy (WtE) market, valued at $38.37 billion in 2025, is projected to experience robust growth, driven by escalating landfill costs, stringent environmental regulations, and the urgent need for sustainable waste management solutions. The compound annual growth rate (CAGR) of 11.22% from 2025 to 2033 indicates a significant expansion, with the market expected to surpass $100 billion by 2033. Key drivers include increasing urbanization leading to higher waste generation, government initiatives promoting renewable energy sources, and technological advancements in WtE technologies, particularly in advanced thermal and biological conversion methods. The market is segmented by technology (physical, thermal, biological), with thermal conversion currently dominating due to its established infrastructure and relatively higher energy output. However, the biological segment, encompassing anaerobic digestion and composting, is witnessing rapid growth fueled by its environmental benefits and potential for producing biogas and biofertilizers. Geographic growth is expected to be diverse, with North America and Europe maintaining significant market shares due to well-established infrastructure and supportive policies. However, the Asia-Pacific region is anticipated to demonstrate the fastest growth rate due to rapid industrialization and increasing awareness of sustainable waste management practices. Competitive dynamics involve both established players and new entrants, creating a dynamic landscape. Challenges include fluctuating feedstock prices, high capital costs associated with WtE plant construction, and potential public resistance related to potential environmental concerns, particularly with respect to air emissions.
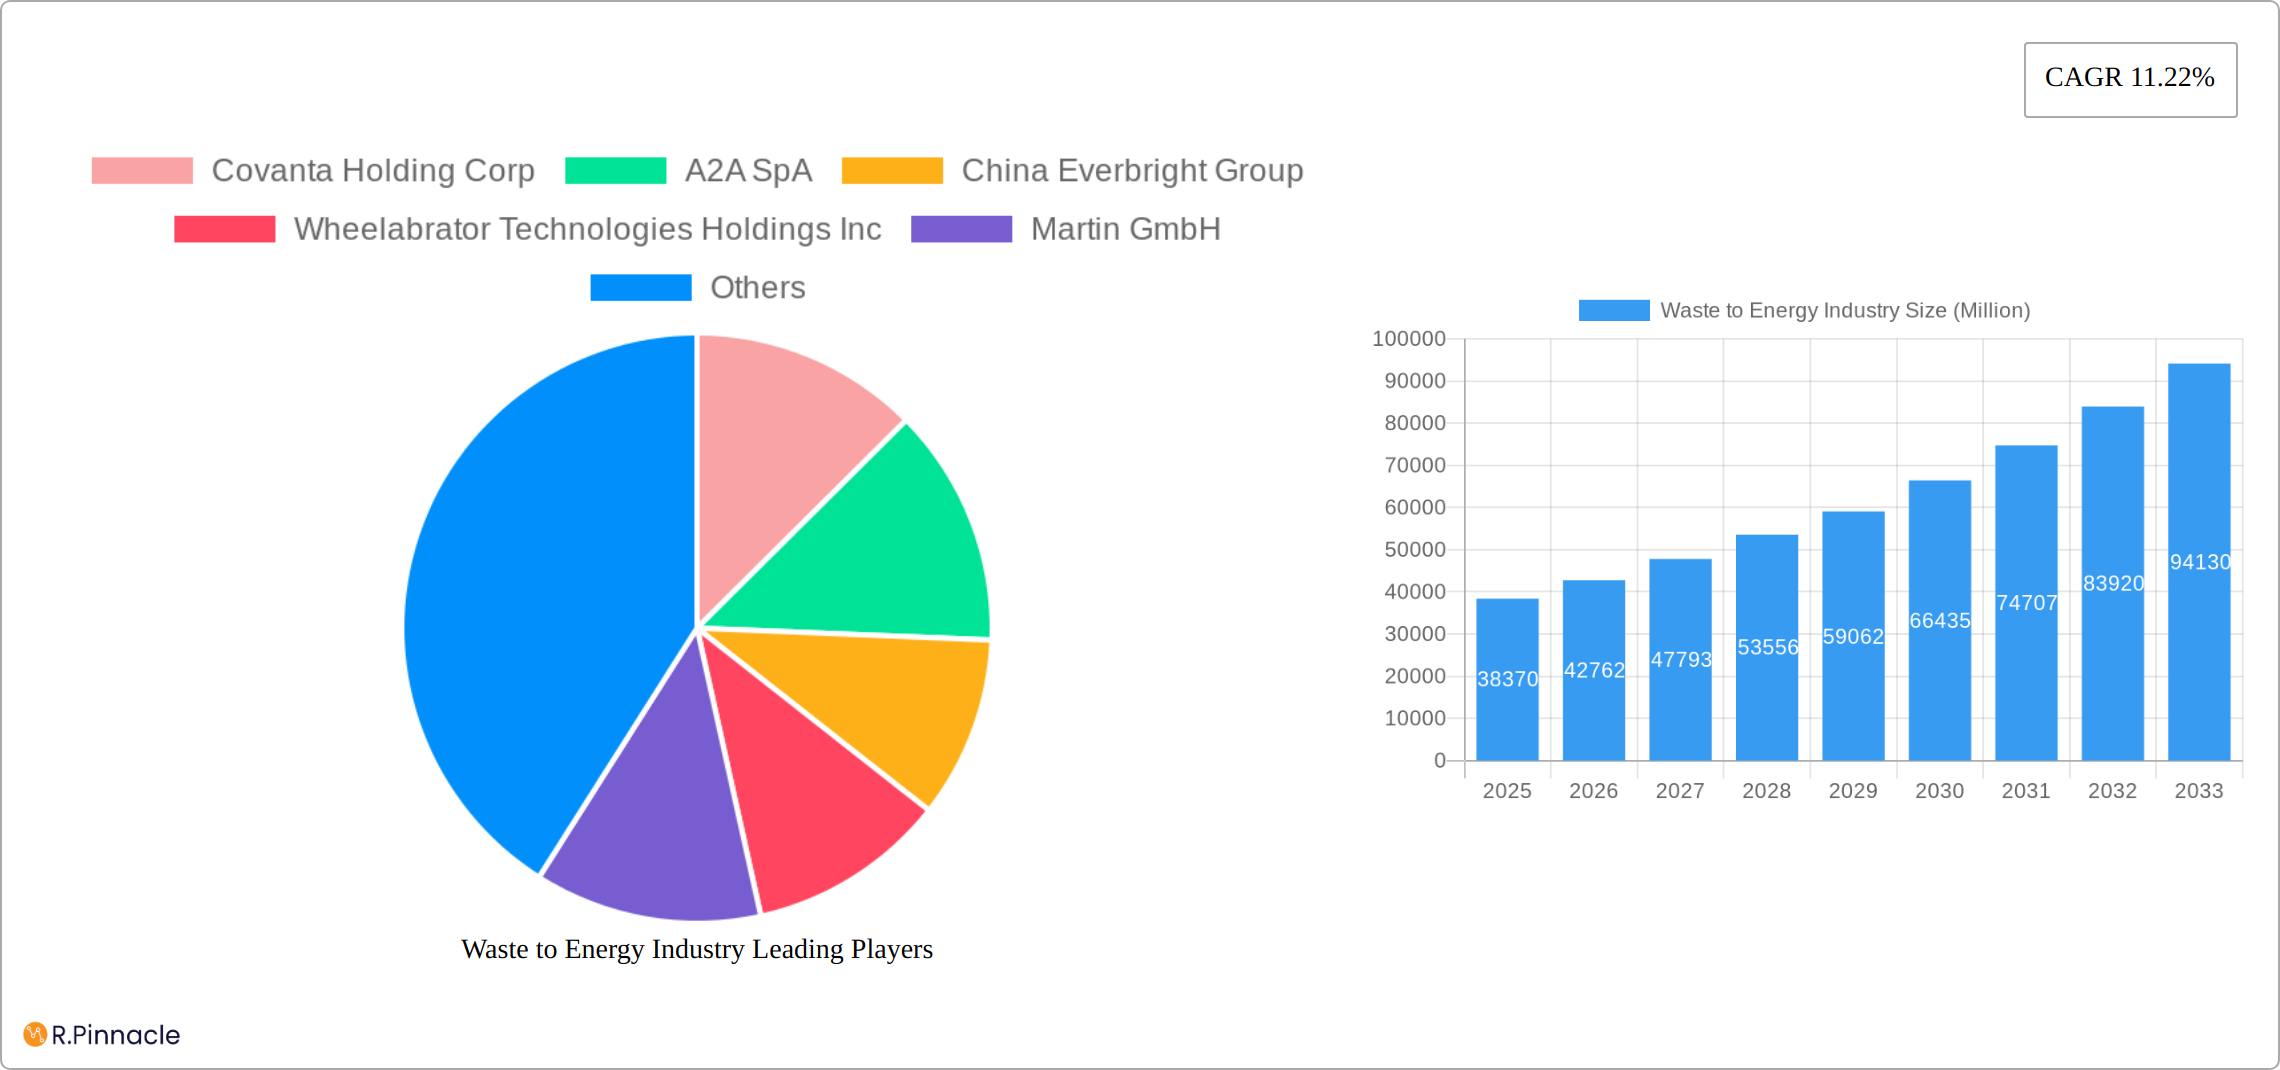
Waste to Energy Industry Market Size (In Billion)
The success of the WtE market hinges on addressing these challenges through technological innovation, regulatory support, and public education campaigns that highlight the environmental and economic benefits of WtE. Future growth will be shaped by the integration of smart technologies for waste management, optimizing energy production efficiency, and exploring new avenues for utilizing waste-derived byproducts. The development of decentralized WtE systems, particularly in smaller communities, is also likely to gain traction. The continued focus on enhancing the environmental performance of WtE plants, mitigating risks such as greenhouse gas emissions, and ensuring responsible disposal of by-products, will be crucial for long-term market sustainability and widespread adoption.
Waste to Energy Industry Company Market Share
Waste-to-Energy Industry Report: 2019-2033 Forecast
This comprehensive report provides an in-depth analysis of the Waste-to-Energy (WtE) industry, offering valuable insights for industry professionals, investors, and policymakers. Covering the period from 2019 to 2033, with a focus on 2025, this report analyzes market dynamics, technological advancements, leading players, and future growth potential. The global Waste-to-Energy market is projected to reach xx Million by 2033, exhibiting a robust CAGR of xx% during the forecast period (2025-2033).
Waste to Energy Industry Market Structure & Innovation Trends
The Waste-to-Energy market is characterized by a moderately consolidated structure with several multinational corporations holding significant market share. Key players such as Covanta Holding Corp, Suez Group, and Veolia Environnement SA, amongst others, are driving innovation and expanding their global footprint through strategic mergers and acquisitions (M&A). The total value of M&A deals in the sector between 2019 and 2024 was estimated at xx Million. Innovation is primarily driven by the need for more efficient and environmentally friendly waste processing technologies. Stringent environmental regulations are increasingly shaping the industry landscape, pushing companies to adopt cleaner technologies and improve waste management practices.
- Market Concentration: High, with a few dominant players controlling a significant share.
- Innovation Drivers: Environmental regulations, technological advancements, and rising energy demand.
- Regulatory Frameworks: Vary across regions, impacting technology adoption and investment.
- Product Substitutes: Landfilling and other waste disposal methods, but WtE offers energy recovery.
- End-User Demographics: Municipalities, industries, and energy companies.
- M&A Activities: Significant activity, driven by expansion and technological acquisition.
Waste to Energy Industry Market Dynamics & Trends
The WtE market is experiencing strong growth driven by increasing urbanization, rising waste generation, and the urgent need for sustainable waste management solutions. Technological disruptions, such as the development of advanced thermal and biological technologies, are enhancing the efficiency and environmental performance of WtE plants. Consumer preferences are shifting towards environmentally friendly waste management, creating a greater demand for WtE solutions. Competitive dynamics are characterized by innovation, strategic partnerships, and M&A activity. The market penetration of WtE technologies varies significantly across regions, with developed countries showing higher adoption rates.
Dominant Regions & Segments in Waste to Energy Industry
The Waste-to-Energy (WtE) market exhibits robust global growth, with substantial contributions from both developed and developing nations. Europe and Asia spearhead this expansion, driven by supportive government policies, advanced infrastructure, and high waste generation rates. While thermal conversion currently dominates the technological landscape due to its established infrastructure and technological maturity, biological processes are rapidly gaining traction, offering significant potential for enhanced resource recovery and reduced environmental impact. This shift reflects a growing focus on sustainable waste management practices and the circular economy.
- Key Drivers in Dominant Regions:
- Europe: Stringent environmental regulations, coupled with advanced infrastructure and high energy costs, incentivize WtE adoption and innovation.
- Asia: Rapid urbanization and the consequent surge in waste generation, alongside government initiatives promoting renewable energy, fuel substantial market growth. Specific examples in countries like China and Japan would further enrich this analysis.
- Technology Segment Dominance Analysis:
- Thermal: This mature technology offers high energy recovery rates but entails higher capital investment costs. Further breakdown into specific thermal technologies (e.g., incineration, gasification) would provide a more nuanced understanding.
- Biological: This growing sector emphasizes resource recovery, resulting in lower greenhouse gas emissions. However, it faces challenges related to technological maturity and scalability compared to thermal methods. Examples of anaerobic digestion and composting would strengthen this description.
- Physical: This smaller segment focuses on crucial pre-treatment and waste sorting, significantly enhancing the efficiency and effectiveness of other WtE technologies. The growing emphasis on improving the quality of feedstock for thermal and biological processes highlights the increasing importance of this segment.
Waste to Energy Industry Product Innovations
Recent advancements in WtE technologies include sophisticated gasification and pyrolysis systems, leading to improved energy efficiency and reduced emissions. Furthermore, the industry is witnessing a shift toward modular and scalable plant designs, enabling greater adaptability to diverse waste streams and site-specific constraints. These innovations are pivotal in enhancing the market viability of WtE by boosting profitability, minimizing environmental footprint, and fostering operational flexibility. Specific examples of innovative technologies and companies at the forefront of these advancements would make this section more impactful.
Report Scope & Segmentation Analysis
This report segments the WtE market based on technology (Physical, Thermal, Biological). The thermal segment currently holds the largest market share, projected to reach xx Million by 2033. The biological segment follows, with a projected value of xx Million, reflecting its increasing adoption. The physical segment, primarily involved in waste pre-treatment, maintains a smaller market share but plays a vital role in optimizing the performance of other WtE technologies. Competitive landscapes vary across segments, with intense competition characterizing the thermal segment and emerging opportunities shaping the biological sector. Including data on market size and growth projections for each segment would add quantitative depth to this section.
Key Drivers of Waste to Energy Industry Growth
Several key factors are driving the growth of the WtE industry: stringent environmental regulations aimed at reducing landfill reliance; increasing energy demand and the need for renewable energy sources; advancements in WtE technologies leading to higher efficiency and reduced emissions; and growing government support and incentives for sustainable waste management. The rising cost of landfilling is further incentivizing the adoption of WtE.
Challenges in the Waste to Energy Industry Sector
The WtE industry faces challenges including high capital costs for plant construction, complex permitting processes and regulatory hurdles, potential public opposition due to perceived environmental concerns, and fluctuations in energy prices which impact profitability. Supply chain disruptions and skilled labor shortages also pose significant operational challenges.
Emerging Opportunities in Waste to Energy Industry
Emerging opportunities include the integration of WtE with other waste management technologies, such as anaerobic digestion for enhanced resource recovery; the development of advanced technologies to handle diverse waste streams; and the expansion into new markets, particularly in developing countries with rapidly growing waste generation. The circular economy concept is creating opportunities to utilize by-products and maximize resource recovery.
Leading Players in the Waste to Energy Industry Market
- Covanta Holding Corp
- A2A SpA
- China Everbright Group
- Wheelabrator Technologies Holdings Inc
- Martin GmbH
- Hitachi Zosen Corp
- Suez Group
- China Jinjiang Environment Holding Co Ltd
- Veolia Environnement SA
- Waste Management Inc
- Babcock & Wilcox Enterprises Inc
- Xcel Energy Inc
- MVV Energie AG
- Mitsubishi Heavy Industries Ltd
Key Developments in Waste to Energy Industry Industry
- January 2023: Lostock Sustainable Energy Plant awarded Babcock & Wilcox a USD 65 Million contract for a waste-to-energy plant near Manchester, UK, showcasing continued investment in the sector and increasing demand for energy from waste.
- April 2023: Egypt signed a USD 120 Million contract for its first solid waste-to-electricity facility, highlighting the growing interest in WtE in developing economies and the potential for large-scale projects.
Future Outlook for Waste to Energy Industry Market
The future of the WtE industry is promising, driven by several key factors: the escalating global waste generation, increasingly stringent environmental regulations worldwide, and the urgent need for sustainable and renewable energy sources. Strategic growth opportunities abound in technological innovation, expansion into new and underserved markets, and the development of integrated waste management solutions. The ongoing global shift towards a circular economy further strengthens the industry's growth trajectory. Adding a discussion of potential challenges, such as public perception and regulatory hurdles, would provide a balanced perspective.
Waste to Energy Industry Segmentation
-
1. Technology
- 1.1. Physical
- 1.2. Thermal
- 1.3. Biological
Waste to Energy Industry Segmentation By Geography
-
1. North America
- 1.1. United States
- 1.2. Canada
- 1.3. Rest of North America
-
2. Asia Pacific
- 2.1. China
- 2.2. India
- 2.3. Japan
- 2.4. Malaysia
- 2.5. Thailand
- 2.6. Indonesia
- 2.7. Vietnam
- 2.8. Rest of Asia Pacific
-
3. Europe
- 3.1. Spain
- 3.2. Nordic
- 3.3. United Kingdom
- 3.4. Russia
- 3.5. Turkey
- 3.6. Germany
- 3.7. Italy
- 3.8. Rest of Europe
-
4. Middle East and Africa
- 4.1. United Arab Emirates
- 4.2. Saudi Arabia
- 4.3. South Africa
- 4.4. Nigeria
- 4.5. Qatar
- 4.6. Egypt
- 4.7. Rest of Middle East and Africa
-
5. South America
- 5.1. Brazil
- 5.2. Argentina
- 5.3. Colombia
- 5.4. Rest of South America
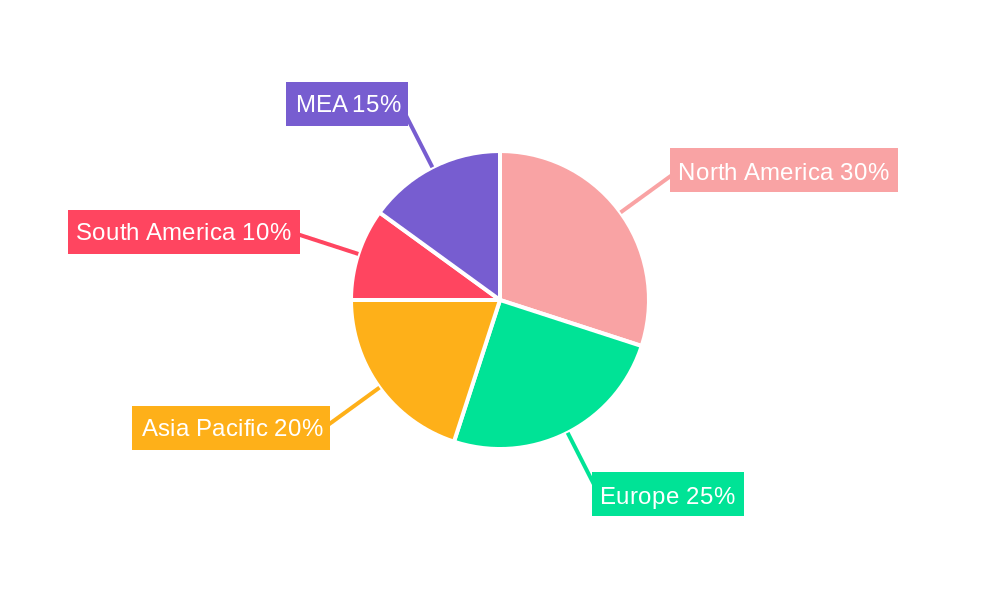
Waste to Energy Industry Regional Market Share
Geographic Coverage of Waste to Energy Industry
Waste to Energy Industry REPORT HIGHLIGHTS
| Aspects | Details |
|---|---|
| Study Period | 2020-2034 |
| Base Year | 2025 |
| Estimated Year | 2026 |
| Forecast Period | 2026-2034 |
| Historical Period | 2020-2025 |
| Growth Rate | CAGR of 11.22% from 2020-2034 |
| Segmentation |
|
Table of Contents
- 1. Introduction
- 1.1. Research Scope
- 1.2. Market Segmentation
- 1.3. Research Objective
- 1.4. Definitions and Assumptions
- 2. Executive Summary
- 2.1. Market Snapshot
- 3. Market Dynamics
- 3.1. Market Drivers
- 3.2. Market Restrains
- 3.3. Market Trends
- 3.4. Market Opportunities
- 4. Market Factor Analysis
- 4.1. Porters Five Forces
- 4.1.1. Bargaining Power of Suppliers
- 4.1.2. Bargaining Power of Buyers
- 4.1.3. Threat of New Entrants
- 4.1.4. Threat of Substitutes
- 4.1.5. Competitive Rivalry
- 4.2. PESTEL analysis
- 4.3. BCG Analysis
- 4.3.1. Stars (High Growth, High Market Share)
- 4.3.2. Cash Cows (Low Growth, High Market Share)
- 4.3.3. Question Mark (High Growth, Low Market Share)
- 4.3.4. Dogs (Low Growth, Low Market Share)
- 4.4. Ansoff Matrix Analysis
- 4.5. Supply Chain Analysis
- 4.6. Regulatory Landscape
- 4.7. Current Market Potential and Opportunity Assessment (TAM–SAM–SOM Framework)
- 4.8. PRI Analyst Note
- 4.1. Porters Five Forces
- 5. Market Analysis, Insights and Forecast 2021-2033
- 5.1. Market Analysis, Insights and Forecast - by Technology
- 5.1.1. Physical
- 5.1.2. Thermal
- 5.1.3. Biological
- 5.2. Market Analysis, Insights and Forecast - by Region
- 5.2.1. North America
- 5.2.2. Asia Pacific
- 5.2.3. Europe
- 5.2.4. Middle East and Africa
- 5.2.5. South America
- 5.1. Market Analysis, Insights and Forecast - by Technology
- 6. Global Waste to Energy Industry Analysis, Insights and Forecast, 2021-2033
- 6.1. Market Analysis, Insights and Forecast - by Technology
- 6.1.1. Physical
- 6.1.2. Thermal
- 6.1.3. Biological
- 6.1. Market Analysis, Insights and Forecast - by Technology
- 7. North America Waste to Energy Industry Analysis, Insights and Forecast, 2020-2032
- 7.1. Market Analysis, Insights and Forecast - by Technology
- 7.1.1. Physical
- 7.1.2. Thermal
- 7.1.3. Biological
- 7.1. Market Analysis, Insights and Forecast - by Technology
- 8. Asia Pacific Waste to Energy Industry Analysis, Insights and Forecast, 2020-2032
- 8.1. Market Analysis, Insights and Forecast - by Technology
- 8.1.1. Physical
- 8.1.2. Thermal
- 8.1.3. Biological
- 8.1. Market Analysis, Insights and Forecast - by Technology
- 9. Europe Waste to Energy Industry Analysis, Insights and Forecast, 2020-2032
- 9.1. Market Analysis, Insights and Forecast - by Technology
- 9.1.1. Physical
- 9.1.2. Thermal
- 9.1.3. Biological
- 9.1. Market Analysis, Insights and Forecast - by Technology
- 10. Middle East and Africa Waste to Energy Industry Analysis, Insights and Forecast, 2020-2032
- 10.1. Market Analysis, Insights and Forecast - by Technology
- 10.1.1. Physical
- 10.1.2. Thermal
- 10.1.3. Biological
- 10.1. Market Analysis, Insights and Forecast - by Technology
- 11. South America Waste to Energy Industry Analysis, Insights and Forecast, 2020-2032
- 11.1. Market Analysis, Insights and Forecast - by Technology
- 11.1.1. Physical
- 11.1.2. Thermal
- 11.1.3. Biological
- 11.1. Market Analysis, Insights and Forecast - by Technology
- 12. Competitive Analysis
- 12.1. Company Profiles
- 12.1.1 Covanta Holding Corp
- 12.1.1.1. Company Overview
- 12.1.1.2. Products
- 12.1.1.3. Company Financials
- 12.1.1.4. SWOT Analysis
- 12.1.2 A2A SpA
- 12.1.2.1. Company Overview
- 12.1.2.2. Products
- 12.1.2.3. Company Financials
- 12.1.2.4. SWOT Analysis
- 12.1.3 China Everbright Group
- 12.1.3.1. Company Overview
- 12.1.3.2. Products
- 12.1.3.3. Company Financials
- 12.1.3.4. SWOT Analysis
- 12.1.4 Wheelabrator Technologies Holdings Inc
- 12.1.4.1. Company Overview
- 12.1.4.2. Products
- 12.1.4.3. Company Financials
- 12.1.4.4. SWOT Analysis
- 12.1.5 Martin GmbH
- 12.1.5.1. Company Overview
- 12.1.5.2. Products
- 12.1.5.3. Company Financials
- 12.1.5.4. SWOT Analysis
- 12.1.6 Hitachi Zosen Corp
- 12.1.6.1. Company Overview
- 12.1.6.2. Products
- 12.1.6.3. Company Financials
- 12.1.6.4. SWOT Analysis
- 12.1.7 Suez Group
- 12.1.7.1. Company Overview
- 12.1.7.2. Products
- 12.1.7.3. Company Financials
- 12.1.7.4. SWOT Analysis
- 12.1.8 China Jinjiang Environment Holding Co Ltd
- 12.1.8.1. Company Overview
- 12.1.8.2. Products
- 12.1.8.3. Company Financials
- 12.1.8.4. SWOT Analysis
- 12.1.9 Veolia Environnement SA
- 12.1.9.1. Company Overview
- 12.1.9.2. Products
- 12.1.9.3. Company Financials
- 12.1.9.4. SWOT Analysis
- 12.1.10 Waste Management Inc
- 12.1.10.1. Company Overview
- 12.1.10.2. Products
- 12.1.10.3. Company Financials
- 12.1.10.4. SWOT Analysis
- 12.1.11 Babcock & Wilcox Enterprises Inc
- 12.1.11.1. Company Overview
- 12.1.11.2. Products
- 12.1.11.3. Company Financials
- 12.1.11.4. SWOT Analysis
- 12.1.12 Xcel Energy Inc
- 12.1.12.1. Company Overview
- 12.1.12.2. Products
- 12.1.12.3. Company Financials
- 12.1.12.4. SWOT Analysis
- 12.1.13 MVV Energie AG
- 12.1.13.1. Company Overview
- 12.1.13.2. Products
- 12.1.13.3. Company Financials
- 12.1.13.4. SWOT Analysis
- 12.1.14 Mitsubishi Heavy Industries Ltd
- 12.1.14.1. Company Overview
- 12.1.14.2. Products
- 12.1.14.3. Company Financials
- 12.1.14.4. SWOT Analysis
- 12.1.1 Covanta Holding Corp
- 12.2. Market Entropy
- 12.2.1 Company's Key Areas Served
- 12.2.2 Recent Developments
- 12.3. Company Market Share Analysis 2025
- 12.3.1 Top 5 Companies Market Share Analysis
- 12.3.2 Top 3 Companies Market Share Analysis
- 12.4. List of Potential Customers
- 13. Research Methodology
List of Figures
- Figure 1: Global Waste to Energy Industry Revenue Breakdown (Million, %) by Region 2025 & 2033
- Figure 2: Global Waste to Energy Industry Volume Breakdown (Gigawatt, %) by Region 2025 & 2033
- Figure 3: North America Waste to Energy Industry Revenue (Million), by Technology 2025 & 2033
- Figure 4: North America Waste to Energy Industry Volume (Gigawatt), by Technology 2025 & 2033
- Figure 5: North America Waste to Energy Industry Revenue Share (%), by Technology 2025 & 2033
- Figure 6: North America Waste to Energy Industry Volume Share (%), by Technology 2025 & 2033
- Figure 7: North America Waste to Energy Industry Revenue (Million), by Country 2025 & 2033
- Figure 8: North America Waste to Energy Industry Volume (Gigawatt), by Country 2025 & 2033
- Figure 9: North America Waste to Energy Industry Revenue Share (%), by Country 2025 & 2033
- Figure 10: North America Waste to Energy Industry Volume Share (%), by Country 2025 & 2033
- Figure 11: Asia Pacific Waste to Energy Industry Revenue (Million), by Technology 2025 & 2033
- Figure 12: Asia Pacific Waste to Energy Industry Volume (Gigawatt), by Technology 2025 & 2033
- Figure 13: Asia Pacific Waste to Energy Industry Revenue Share (%), by Technology 2025 & 2033
- Figure 14: Asia Pacific Waste to Energy Industry Volume Share (%), by Technology 2025 & 2033
- Figure 15: Asia Pacific Waste to Energy Industry Revenue (Million), by Country 2025 & 2033
- Figure 16: Asia Pacific Waste to Energy Industry Volume (Gigawatt), by Country 2025 & 2033
- Figure 17: Asia Pacific Waste to Energy Industry Revenue Share (%), by Country 2025 & 2033
- Figure 18: Asia Pacific Waste to Energy Industry Volume Share (%), by Country 2025 & 2033
- Figure 19: Europe Waste to Energy Industry Revenue (Million), by Technology 2025 & 2033
- Figure 20: Europe Waste to Energy Industry Volume (Gigawatt), by Technology 2025 & 2033
- Figure 21: Europe Waste to Energy Industry Revenue Share (%), by Technology 2025 & 2033
- Figure 22: Europe Waste to Energy Industry Volume Share (%), by Technology 2025 & 2033
- Figure 23: Europe Waste to Energy Industry Revenue (Million), by Country 2025 & 2033
- Figure 24: Europe Waste to Energy Industry Volume (Gigawatt), by Country 2025 & 2033
- Figure 25: Europe Waste to Energy Industry Revenue Share (%), by Country 2025 & 2033
- Figure 26: Europe Waste to Energy Industry Volume Share (%), by Country 2025 & 2033
- Figure 27: Middle East and Africa Waste to Energy Industry Revenue (Million), by Technology 2025 & 2033
- Figure 28: Middle East and Africa Waste to Energy Industry Volume (Gigawatt), by Technology 2025 & 2033
- Figure 29: Middle East and Africa Waste to Energy Industry Revenue Share (%), by Technology 2025 & 2033
- Figure 30: Middle East and Africa Waste to Energy Industry Volume Share (%), by Technology 2025 & 2033
- Figure 31: Middle East and Africa Waste to Energy Industry Revenue (Million), by Country 2025 & 2033
- Figure 32: Middle East and Africa Waste to Energy Industry Volume (Gigawatt), by Country 2025 & 2033
- Figure 33: Middle East and Africa Waste to Energy Industry Revenue Share (%), by Country 2025 & 2033
- Figure 34: Middle East and Africa Waste to Energy Industry Volume Share (%), by Country 2025 & 2033
- Figure 35: South America Waste to Energy Industry Revenue (Million), by Technology 2025 & 2033
- Figure 36: South America Waste to Energy Industry Volume (Gigawatt), by Technology 2025 & 2033
- Figure 37: South America Waste to Energy Industry Revenue Share (%), by Technology 2025 & 2033
- Figure 38: South America Waste to Energy Industry Volume Share (%), by Technology 2025 & 2033
- Figure 39: South America Waste to Energy Industry Revenue (Million), by Country 2025 & 2033
- Figure 40: South America Waste to Energy Industry Volume (Gigawatt), by Country 2025 & 2033
- Figure 41: South America Waste to Energy Industry Revenue Share (%), by Country 2025 & 2033
- Figure 42: South America Waste to Energy Industry Volume Share (%), by Country 2025 & 2033
List of Tables
- Table 1: Global Waste to Energy Industry Revenue Million Forecast, by Technology 2020 & 2033
- Table 2: Global Waste to Energy Industry Volume Gigawatt Forecast, by Technology 2020 & 2033
- Table 3: Global Waste to Energy Industry Revenue Million Forecast, by Region 2020 & 2033
- Table 4: Global Waste to Energy Industry Volume Gigawatt Forecast, by Region 2020 & 2033
- Table 5: Global Waste to Energy Industry Revenue Million Forecast, by Technology 2020 & 2033
- Table 6: Global Waste to Energy Industry Volume Gigawatt Forecast, by Technology 2020 & 2033
- Table 7: Global Waste to Energy Industry Revenue Million Forecast, by Country 2020 & 2033
- Table 8: Global Waste to Energy Industry Volume Gigawatt Forecast, by Country 2020 & 2033
- Table 9: United States Waste to Energy Industry Revenue (Million) Forecast, by Application 2020 & 2033
- Table 10: United States Waste to Energy Industry Volume (Gigawatt) Forecast, by Application 2020 & 2033
- Table 11: Canada Waste to Energy Industry Revenue (Million) Forecast, by Application 2020 & 2033
- Table 12: Canada Waste to Energy Industry Volume (Gigawatt) Forecast, by Application 2020 & 2033
- Table 13: Rest of North America Waste to Energy Industry Revenue (Million) Forecast, by Application 2020 & 2033
- Table 14: Rest of North America Waste to Energy Industry Volume (Gigawatt) Forecast, by Application 2020 & 2033
- Table 15: Global Waste to Energy Industry Revenue Million Forecast, by Technology 2020 & 2033
- Table 16: Global Waste to Energy Industry Volume Gigawatt Forecast, by Technology 2020 & 2033
- Table 17: Global Waste to Energy Industry Revenue Million Forecast, by Country 2020 & 2033
- Table 18: Global Waste to Energy Industry Volume Gigawatt Forecast, by Country 2020 & 2033
- Table 19: China Waste to Energy Industry Revenue (Million) Forecast, by Application 2020 & 2033
- Table 20: China Waste to Energy Industry Volume (Gigawatt) Forecast, by Application 2020 & 2033
- Table 21: India Waste to Energy Industry Revenue (Million) Forecast, by Application 2020 & 2033
- Table 22: India Waste to Energy Industry Volume (Gigawatt) Forecast, by Application 2020 & 2033
- Table 23: Japan Waste to Energy Industry Revenue (Million) Forecast, by Application 2020 & 2033
- Table 24: Japan Waste to Energy Industry Volume (Gigawatt) Forecast, by Application 2020 & 2033
- Table 25: Malaysia Waste to Energy Industry Revenue (Million) Forecast, by Application 2020 & 2033
- Table 26: Malaysia Waste to Energy Industry Volume (Gigawatt) Forecast, by Application 2020 & 2033
- Table 27: Thailand Waste to Energy Industry Revenue (Million) Forecast, by Application 2020 & 2033
- Table 28: Thailand Waste to Energy Industry Volume (Gigawatt) Forecast, by Application 2020 & 2033
- Table 29: Indonesia Waste to Energy Industry Revenue (Million) Forecast, by Application 2020 & 2033
- Table 30: Indonesia Waste to Energy Industry Volume (Gigawatt) Forecast, by Application 2020 & 2033
- Table 31: Vietnam Waste to Energy Industry Revenue (Million) Forecast, by Application 2020 & 2033
- Table 32: Vietnam Waste to Energy Industry Volume (Gigawatt) Forecast, by Application 2020 & 2033
- Table 33: Rest of Asia Pacific Waste to Energy Industry Revenue (Million) Forecast, by Application 2020 & 2033
- Table 34: Rest of Asia Pacific Waste to Energy Industry Volume (Gigawatt) Forecast, by Application 2020 & 2033
- Table 35: Global Waste to Energy Industry Revenue Million Forecast, by Technology 2020 & 2033
- Table 36: Global Waste to Energy Industry Volume Gigawatt Forecast, by Technology 2020 & 2033
- Table 37: Global Waste to Energy Industry Revenue Million Forecast, by Country 2020 & 2033
- Table 38: Global Waste to Energy Industry Volume Gigawatt Forecast, by Country 2020 & 2033
- Table 39: Spain Waste to Energy Industry Revenue (Million) Forecast, by Application 2020 & 2033
- Table 40: Spain Waste to Energy Industry Volume (Gigawatt) Forecast, by Application 2020 & 2033
- Table 41: Nordic Waste to Energy Industry Revenue (Million) Forecast, by Application 2020 & 2033
- Table 42: Nordic Waste to Energy Industry Volume (Gigawatt) Forecast, by Application 2020 & 2033
- Table 43: United Kingdom Waste to Energy Industry Revenue (Million) Forecast, by Application 2020 & 2033
- Table 44: United Kingdom Waste to Energy Industry Volume (Gigawatt) Forecast, by Application 2020 & 2033
- Table 45: Russia Waste to Energy Industry Revenue (Million) Forecast, by Application 2020 & 2033
- Table 46: Russia Waste to Energy Industry Volume (Gigawatt) Forecast, by Application 2020 & 2033
- Table 47: Turkey Waste to Energy Industry Revenue (Million) Forecast, by Application 2020 & 2033
- Table 48: Turkey Waste to Energy Industry Volume (Gigawatt) Forecast, by Application 2020 & 2033
- Table 49: Germany Waste to Energy Industry Revenue (Million) Forecast, by Application 2020 & 2033
- Table 50: Germany Waste to Energy Industry Volume (Gigawatt) Forecast, by Application 2020 & 2033
- Table 51: Italy Waste to Energy Industry Revenue (Million) Forecast, by Application 2020 & 2033
- Table 52: Italy Waste to Energy Industry Volume (Gigawatt) Forecast, by Application 2020 & 2033
- Table 53: Rest of Europe Waste to Energy Industry Revenue (Million) Forecast, by Application 2020 & 2033
- Table 54: Rest of Europe Waste to Energy Industry Volume (Gigawatt) Forecast, by Application 2020 & 2033
- Table 55: Global Waste to Energy Industry Revenue Million Forecast, by Technology 2020 & 2033
- Table 56: Global Waste to Energy Industry Volume Gigawatt Forecast, by Technology 2020 & 2033
- Table 57: Global Waste to Energy Industry Revenue Million Forecast, by Country 2020 & 2033
- Table 58: Global Waste to Energy Industry Volume Gigawatt Forecast, by Country 2020 & 2033
- Table 59: United Arab Emirates Waste to Energy Industry Revenue (Million) Forecast, by Application 2020 & 2033
- Table 60: United Arab Emirates Waste to Energy Industry Volume (Gigawatt) Forecast, by Application 2020 & 2033
- Table 61: Saudi Arabia Waste to Energy Industry Revenue (Million) Forecast, by Application 2020 & 2033
- Table 62: Saudi Arabia Waste to Energy Industry Volume (Gigawatt) Forecast, by Application 2020 & 2033
- Table 63: South Africa Waste to Energy Industry Revenue (Million) Forecast, by Application 2020 & 2033
- Table 64: South Africa Waste to Energy Industry Volume (Gigawatt) Forecast, by Application 2020 & 2033
- Table 65: Nigeria Waste to Energy Industry Revenue (Million) Forecast, by Application 2020 & 2033
- Table 66: Nigeria Waste to Energy Industry Volume (Gigawatt) Forecast, by Application 2020 & 2033
- Table 67: Qatar Waste to Energy Industry Revenue (Million) Forecast, by Application 2020 & 2033
- Table 68: Qatar Waste to Energy Industry Volume (Gigawatt) Forecast, by Application 2020 & 2033
- Table 69: Egypt Waste to Energy Industry Revenue (Million) Forecast, by Application 2020 & 2033
- Table 70: Egypt Waste to Energy Industry Volume (Gigawatt) Forecast, by Application 2020 & 2033
- Table 71: Rest of Middle East and Africa Waste to Energy Industry Revenue (Million) Forecast, by Application 2020 & 2033
- Table 72: Rest of Middle East and Africa Waste to Energy Industry Volume (Gigawatt) Forecast, by Application 2020 & 2033
- Table 73: Global Waste to Energy Industry Revenue Million Forecast, by Technology 2020 & 2033
- Table 74: Global Waste to Energy Industry Volume Gigawatt Forecast, by Technology 2020 & 2033
- Table 75: Global Waste to Energy Industry Revenue Million Forecast, by Country 2020 & 2033
- Table 76: Global Waste to Energy Industry Volume Gigawatt Forecast, by Country 2020 & 2033
- Table 77: Brazil Waste to Energy Industry Revenue (Million) Forecast, by Application 2020 & 2033
- Table 78: Brazil Waste to Energy Industry Volume (Gigawatt) Forecast, by Application 2020 & 2033
- Table 79: Argentina Waste to Energy Industry Revenue (Million) Forecast, by Application 2020 & 2033
- Table 80: Argentina Waste to Energy Industry Volume (Gigawatt) Forecast, by Application 2020 & 2033
- Table 81: Colombia Waste to Energy Industry Revenue (Million) Forecast, by Application 2020 & 2033
- Table 82: Colombia Waste to Energy Industry Volume (Gigawatt) Forecast, by Application 2020 & 2033
- Table 83: Rest of South America Waste to Energy Industry Revenue (Million) Forecast, by Application 2020 & 2033
- Table 84: Rest of South America Waste to Energy Industry Volume (Gigawatt) Forecast, by Application 2020 & 2033
Frequently Asked Questions
1. What is the projected Compound Annual Growth Rate (CAGR) of the Waste to Energy Industry?
The projected CAGR is approximately 11.22%.
2. Which companies are prominent players in the Waste to Energy Industry?
Key companies in the market include Covanta Holding Corp, A2A SpA, China Everbright Group, Wheelabrator Technologies Holdings Inc, Martin GmbH, Hitachi Zosen Corp, Suez Group, China Jinjiang Environment Holding Co Ltd, Veolia Environnement SA, Waste Management Inc, Babcock & Wilcox Enterprises Inc, Xcel Energy Inc, MVV Energie AG, Mitsubishi Heavy Industries Ltd.
3. What are the main segments of the Waste to Energy Industry?
The market segments include Technology.
4. Can you provide details about the market size?
The market size is estimated to be USD 38.37 Million as of 2022.
5. What are some drivers contributing to market growth?
4.; Increasing Amount of Waste Generation. Growing Concern for Waste Management to Meet the Needs for Sustainable Urban Living4.; Increasing Focus on Non-fossil Fuel Sources of Energy.
6. What are the notable trends driving market growth?
Thermal-based Waste-to-Energy Segment to Dominate the Market.
7. Are there any restraints impacting market growth?
4.; Expensive Nature of Incinerators.
8. Can you provide examples of recent developments in the market?
April 2023: Egypt signed a USD 120 million contract to design, develop, own, and manage the country's first solid waste-to-electricity facility. The contract was signed by the Giza governorate and a partnership consisting of Renergy Egypt and the National Authority for Military Production. As part of Egypt Vision 2030, the Abou Rawash, Giza plant would convert 1,200 metric tons of household solid waste per day to power.
9. What pricing options are available for accessing the report?
Pricing options include single-user, multi-user, and enterprise licenses priced at USD 4750, USD 5250, and USD 8750 respectively.
10. Is the market size provided in terms of value or volume?
The market size is provided in terms of value, measured in Million and volume, measured in Gigawatt.
11. Are there any specific market keywords associated with the report?
Yes, the market keyword associated with the report is "Waste to Energy Industry," which aids in identifying and referencing the specific market segment covered.
12. How do I determine which pricing option suits my needs best?
The pricing options vary based on user requirements and access needs. Individual users may opt for single-user licenses, while businesses requiring broader access may choose multi-user or enterprise licenses for cost-effective access to the report.
13. Are there any additional resources or data provided in the Waste to Energy Industry report?
While the report offers comprehensive insights, it's advisable to review the specific contents or supplementary materials provided to ascertain if additional resources or data are available.
14. How can I stay updated on further developments or reports in the Waste to Energy Industry?
To stay informed about further developments, trends, and reports in the Waste to Energy Industry, consider subscribing to industry newsletters, following relevant companies and organizations, or regularly checking reputable industry news sources and publications.
Methodology
Step 1 - Identification of Relevant Samples Size from Population Database


Step 2 - Approaches for Defining Global Market Size (Value, Volume* & Price*)

Note*: In applicable scenarios
Step 3 - Data Sources
Primary Research
- Web Analytics
- Survey Reports
- Research Institute
- Latest Research Reports
- Opinion Leaders
Secondary Research
- Annual Reports
- White Paper
- Latest Press Release
- Industry Association
- Paid Database
- Investor Presentations

Step 4 - Data Triangulation
Involves using different sources of information in order to increase the validity of a study
These sources are likely to be stakeholders in a program - participants, other researchers, program staff, other community members, and so on.
Then we put all data in single framework & apply various statistical tools to find out the dynamic on the market.
During the analysis stage, feedback from the stakeholder groups would be compared to determine areas of agreement as well as areas of divergence