

Key Insights
The global Water Rescue Manikins market is poised for significant expansion, projected to reach $151.82 million in 2025. This robust growth is driven by an increasing emphasis on water safety education and training across various sectors, including professional rescue services, educational institutions, and private organizations. The market is expected to experience a CAGR of 9.6%, indicating a sustained upward trajectory in demand. Key applications driving this growth include hospitals for medical training, schools for drowning prevention programs, and other specialized sectors requiring realistic simulation tools. The variety of manikin types, from infant to adult models, caters to diverse training needs, ensuring comprehensive skill development for lifeguards, emergency responders, and medical professionals. Companies like 3B Scientific, Ruth Lee, and Simulaids are at the forefront, innovating with advanced features and materials to enhance realism and durability, thereby stimulating market penetration.
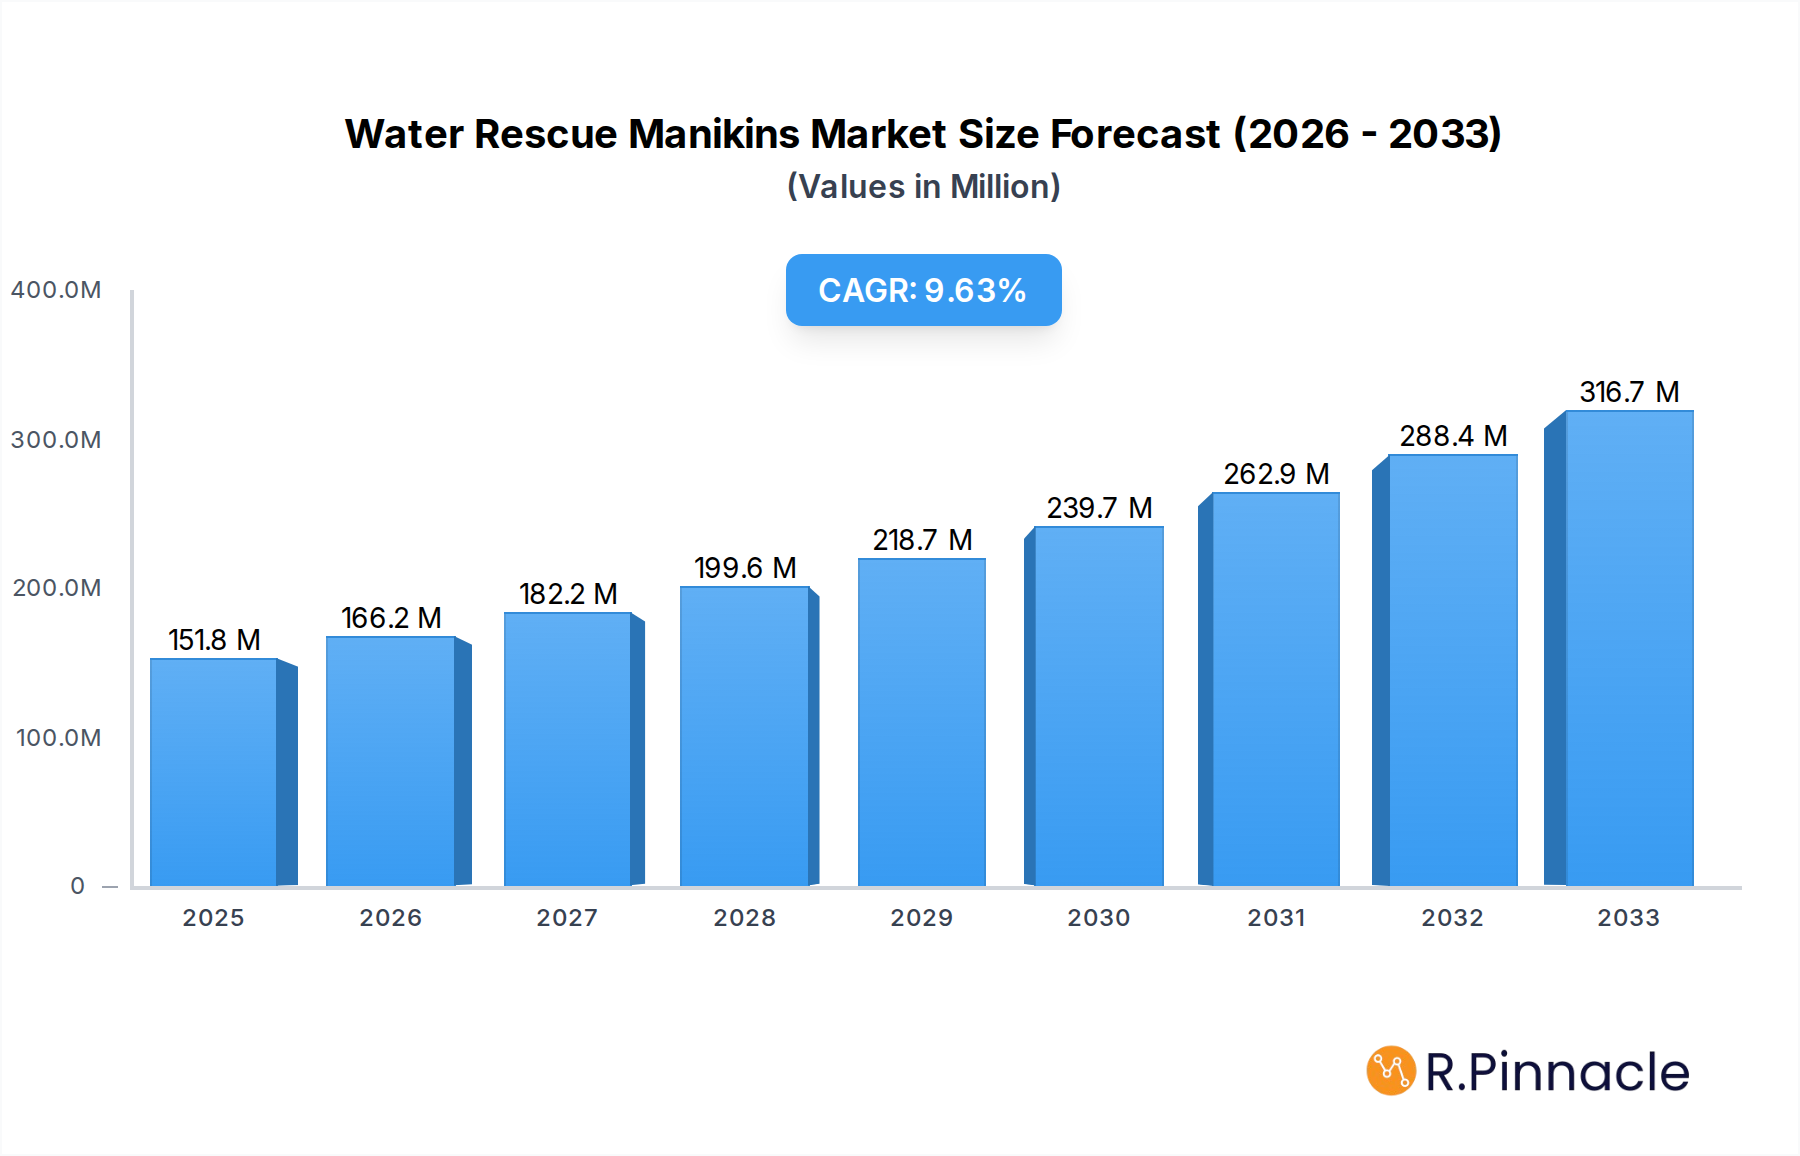
Water Rescue Manikins Market Size (In Million)
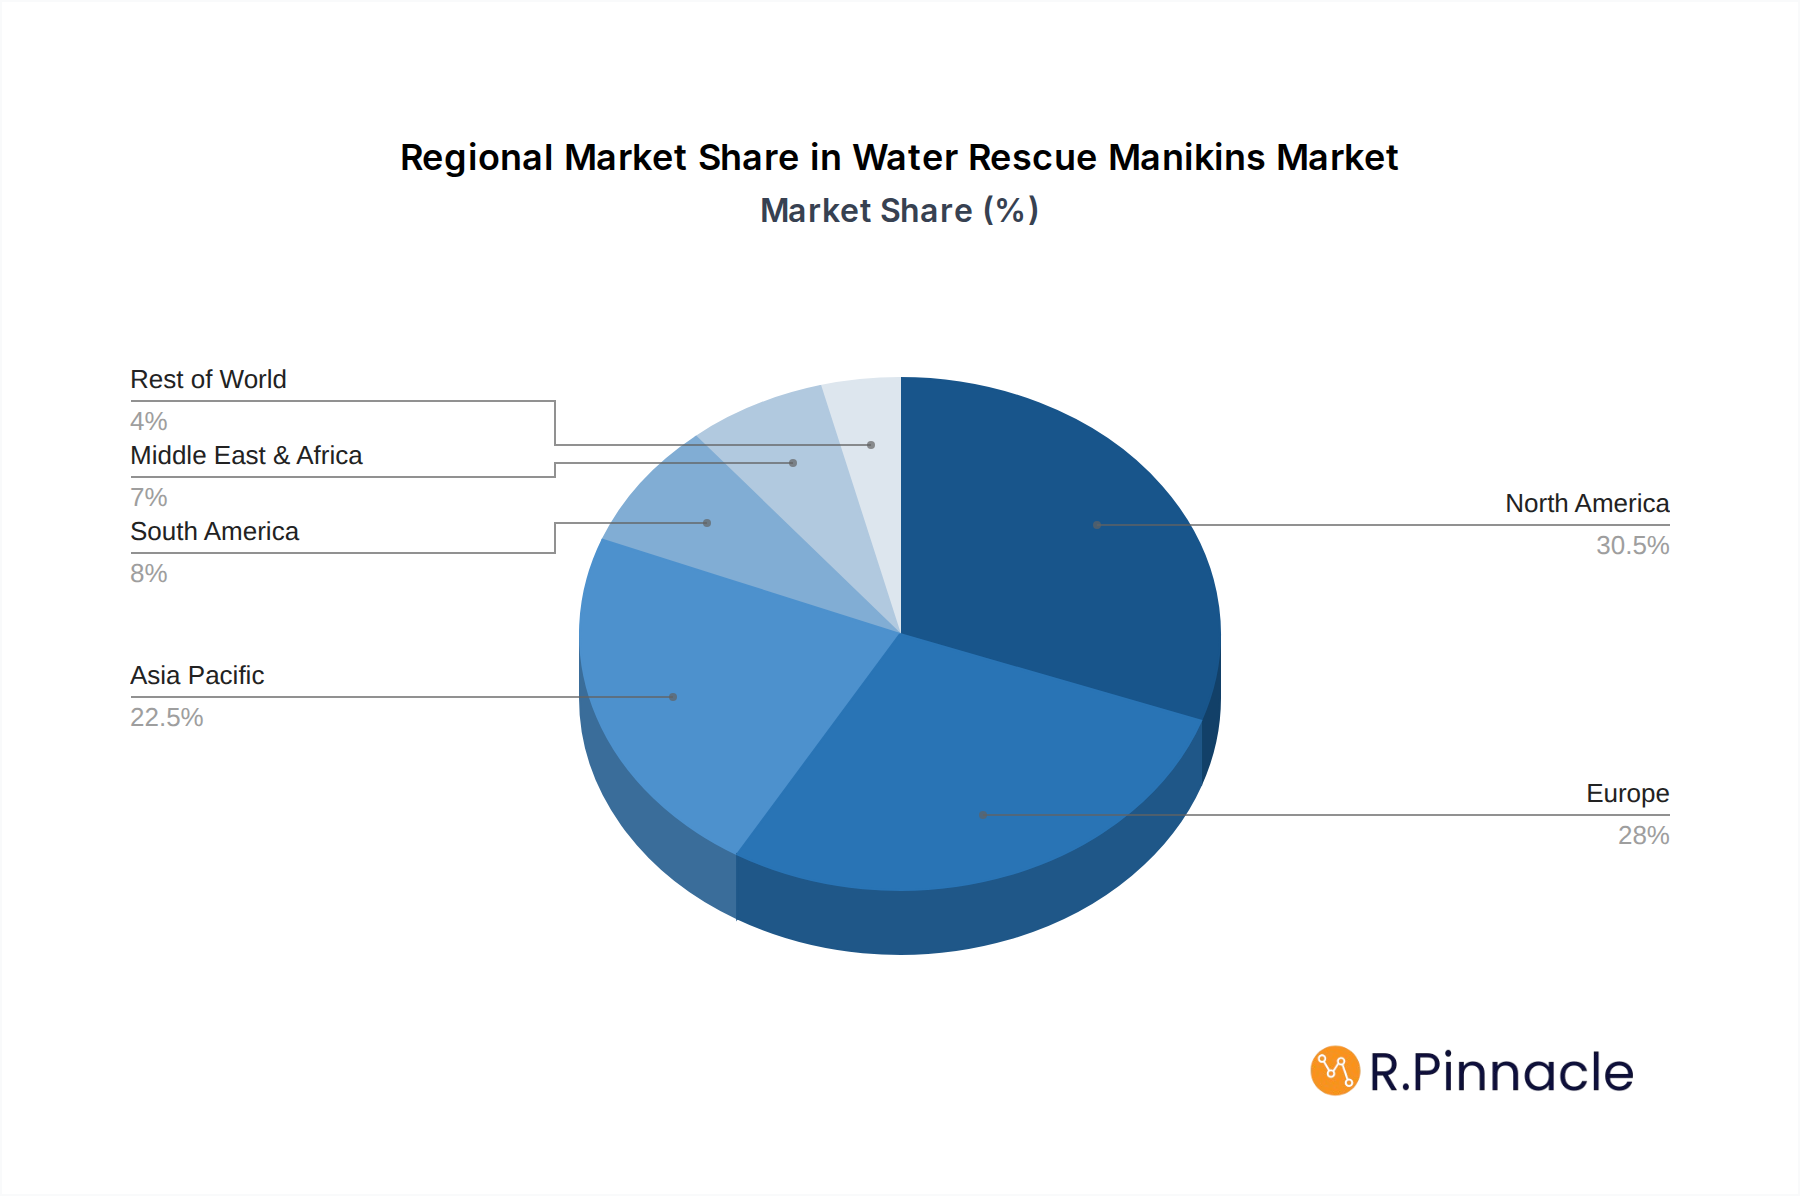
Geographically, North America and Europe are anticipated to maintain their dominance in the Water Rescue Manikins market, owing to well-established water safety regulations and high investment in emergency preparedness. However, the Asia Pacific region, particularly China and India, is expected to exhibit the fastest growth due to rising awareness of water safety, increasing drowning incidents, and government initiatives promoting water rescue training. The market's expansion is supported by technological advancements in manikin design, making them more lifelike and capable of simulating various drowning scenarios. Despite the positive outlook, potential restraints such as the high initial cost of advanced models and the availability of alternative, less expensive training methods could pose challenges. Nevertheless, the overarching trend towards enhanced water safety protocols and the critical need for skilled water rescue personnel are expected to fuel sustained market growth throughout the forecast period, 2025-2033.

Water Rescue Manikins Company Market Share
This in-depth report provides a comprehensive analysis of the global Water Rescue Manikins market, offering valuable insights for industry professionals, manufacturers, and stakeholders. Covering a study period from 2019 to 2033, with a base year of 2025, the report delves into market structure, dynamics, regional dominance, product innovations, key drivers, challenges, emerging opportunities, and a detailed outlook for the future. The analysis leverages high-ranking keywords to ensure maximum search visibility and reader engagement within the emergency preparedness, medical training, and water safety sectors.
Water Rescue Manikins Market Structure & Innovation Trends
The global Water Rescue Manikins market exhibits a moderately consolidated structure, with several key players dominating a significant portion of the market share. Leading companies like 3B Scientific and Ruth Lee are at the forefront, consistently investing in research and development to drive innovation. The market's growth is propelled by an increasing awareness of water safety protocols and the critical need for realistic training tools. Regulatory frameworks established by national and international safety organizations are a significant factor, mandating the use of certified manikins for various training programs. While direct substitutes are limited, advancements in virtual reality simulation offer a nascent competitive threat. End-user demographics are broad, encompassing professional rescuers, educational institutions, and various other entities focused on water safety. Mergers and acquisition (M&A) activities, while not excessively frequent, have played a role in market consolidation, with some notable deals valued in the tens of millions of dollars, aimed at expanding product portfolios and geographical reach. The market is characterized by a continuous drive towards more durable, realistic, and specialized manikin designs.
Water Rescue Manikins Market Dynamics & Trends
The Water Rescue Manikins market is poised for robust growth, driven by a confluence of factors including rising global drowning incidents and a consequent surge in demand for effective water rescue training solutions. The compound annual growth rate (CAGR) for the forecast period is projected to be a healthy xx%, indicating substantial market expansion. Technological disruptions are playing a pivotal role, with manufacturers increasingly incorporating advanced materials and designs to enhance realism, buoyancy, and durability. This includes the development of manikins that can simulate various body weights and resistance levels, crucial for training scenarios involving swift currents or deep water. Consumer preferences are leaning towards manikins that offer a lifelike feel and are easy to deploy and maintain in diverse aquatic environments. The competitive landscape is dynamic, with established players like Simulaids and Nasco Healthcare continually innovating to maintain their market position. Emerging economies are also presenting significant market penetration opportunities as governments and organizations prioritize water safety education. The integration of smart technologies, such as sensors for performance tracking, is another emerging trend that is reshaping the user experience. The increasing adoption of water rescue training in schools and educational institutions, coupled with professional certification requirements, further fuels market demand. The market penetration is expected to reach xx% by the end of the forecast period.
Dominant Regions & Segments in Water Rescue Manikins
North America currently stands as the dominant region in the global Water Rescue Manikins market, driven by stringent safety regulations, high public awareness of water safety, and significant investment in emergency response training infrastructure. Within North America, the United States leads due to its extensive coastline, numerous inland waterways, and a well-established network of training providers.
- Key Drivers for Dominance in North America:
- Economic Policies: Robust healthcare and public safety budgets allocated by federal and state governments.
- Infrastructure: Well-developed training facilities and emergency response systems.
- Regulatory Frameworks: Strict mandates from organizations like the American Red Cross and the US Coast Guard for certified water rescue training.
- Technological Adoption: Early and widespread adoption of advanced training manikins.
The Adult Model segment is the largest within the Types categorization, reflecting the prevalence of adult drowning incidents and the foundational nature of adult rescue training programs. However, significant growth is anticipated in the Child Model and Infant Model segments due to increasing awareness of the vulnerability of younger populations and specialized pediatric rescue training requirements.
In terms of Applications, while Hospital and School segments are substantial, the Others category, encompassing professional rescue organizations, fire departments, lifeguard training centers, and recreational facilities, represents a significant and growing market share. This is due to the specialized and continuous training needs of these professional groups. The increasing emphasis on comprehensive water safety education in educational curricula is also contributing to the growth of the School segment.
Water Rescue Manikins Product Innovations
Product innovations in the Water Rescue Manikins market are focused on enhancing realism and functionality. Manufacturers are developing manikins with improved buoyancy to simulate real drowning victims more accurately and with increased durability for repeated use in challenging conditions. Advancements in material science allow for manikins that can better withstand harsh weather and prolonged immersion. These innovations provide competitive advantages by offering more effective and cost-efficient training solutions for a wide range of aquatic rescue scenarios, catering to the evolving needs of the emergency services and water safety sectors.
Report Scope & Segmentation Analysis
This report provides a granular analysis of the Water Rescue Manikins market across key segmentation categories to offer a complete market picture.
Application Segments:
- Hospital: This segment focuses on manikins used in hospital settings for training healthcare professionals in emergency water rescue scenarios, particularly for patients involved in water-related incidents. Growth is steady, driven by the need for specialized medical response training.
- School: This segment encompasses manikins utilized in educational institutions for water safety and basic rescue education programs. It is a growing segment due to increased emphasis on school-based safety curricula.
- Others: This broad segment includes professional rescue organizations, fire departments, lifeguard training centers, and recreational facilities. It is the largest and fastest-growing segment, driven by the continuous training needs of professionals.
Type Segments:
- Adult Model: This is the largest segment, representing manikins designed to mimic the size and weight of adult victims, crucial for fundamental water rescue training.
- Adolescent Model: This segment caters to training scenarios involving teenagers, offering specific size and weight profiles.
- Child Model: Designed to simulate children, this segment is experiencing significant growth due to the increasing focus on pediatric rescue preparedness.
- Infant Model: These manikins are specifically designed for infant rescue training, a critical niche for specialized emergency response teams.
Key Drivers of Water Rescue Manikins Growth
The Water Rescue Manikins market is propelled by several critical growth drivers. Increasing global drowning incidents necessitate more effective and widespread training programs, directly boosting demand for realistic manikins. Stringent regulatory frameworks and certification requirements by national and international safety bodies mandate the use of certified training equipment, ensuring a consistent market for these products. Growing awareness of water safety and emergency preparedness among the general public and institutions further fuels the adoption of rescue training. Technological advancements in manikin design, focusing on durability, realism, and ease of use, are creating superior training tools and driving market expansion. The expansion of lifeguard services and professional rescue organizations worldwide also contributes significantly to market growth.
Challenges in the Water Rescue Manikins Sector
Despite the positive growth trajectory, the Water Rescue Manikins sector faces certain challenges. High initial manufacturing costs for advanced, feature-rich manikins can be a barrier for smaller organizations or those with limited budgets. Supply chain disruptions, as experienced globally in recent years, can impact the availability and cost of raw materials and finished products. Competition from lower-cost, less sophisticated alternatives or the perceived adequacy of older training methods can also pose a challenge. Furthermore, the need for regular maintenance and replacement of manikins, especially after intensive use, adds to the overall operational costs for end-users, potentially impacting purchasing decisions.
Emerging Opportunities in Water Rescue Manikins
Several emerging opportunities are set to shape the future of the Water Rescue Manikins market. The development of "smart" manikins with integrated sensors for performance tracking and feedback offers a significant avenue for growth, enhancing training effectiveness and data collection. The expansion of training programs into emerging economies with growing water bodies and increasing safety awareness presents a vast untapped market. The growing trend of virtual reality (VR) and augmented reality (AR) in training offers opportunities for hybrid manikin-based and digital training solutions, creating more immersive and engaging learning experiences. Furthermore, increased demand for specialized manikins for specific scenarios like swift water rescue, ice rescue, and confined space water rescue, opens niche market segments for innovation and growth.
Leading Players in the Water Rescue Manikins Market
- 3B Scientific
- Ruth Lee
- Simulaids
- LifeTec Pty Ltd
- Emerald Marine Products
- Nasco Healthcare
- Medical Doctor Education Technology (Shenzhen)
Key Developments in Water Rescue Manikins Industry
- 2023: Launch of advanced, weighted water rescue manikins with enhanced buoyancy features by several leading manufacturers, improving realism in training.
- 2022: Increased adoption of water rescue manikins in educational curricula for basic water safety awareness programs.
- 2021: Several companies focused on developing more durable and weather-resistant manikin materials to withstand diverse training environments.
- 2020: A surge in demand for water rescue manikins driven by heightened awareness of water safety following localized incidents.
- 2019: Introduction of manikins with more realistic limb articulation and weighted distribution for improved simulation of adult victims.
Future Outlook for Water Rescue Manikins Market
The future outlook for the Water Rescue Manikins market is exceptionally bright, driven by an unyielding focus on water safety and the continuous need for professional competence. The market is expected to witness accelerated growth as technological advancements lead to more sophisticated and lifelike manikins, enhancing the efficacy of rescue training. Strategic opportunities lie in the expansion into underserved geographic regions and the development of specialized manikins catering to increasingly complex rescue scenarios. The integration of digital technologies within training programs will further solidify the market's evolution, making water rescue training more accessible, engaging, and impactful, ultimately contributing to a reduction in drowning incidents globally.
Water Rescue Manikins Segmentation
-
1. Application
- 1.1. Hospital
- 1.2. School
- 1.3. Others
-
2. Types
- 2.1. Adult Model
- 2.2. Adolescent Model
- 2.3. Child Model
- 2.4. Infant Model
Water Rescue Manikins Segmentation By Geography
-
1. North America
- 1.1. United States
- 1.2. Canada
- 1.3. Mexico
-
2. South America
- 2.1. Brazil
- 2.2. Argentina
- 2.3. Rest of South America
-
3. Europe
- 3.1. United Kingdom
- 3.2. Germany
- 3.3. France
- 3.4. Italy
- 3.5. Spain
- 3.6. Russia
- 3.7. Benelux
- 3.8. Nordics
- 3.9. Rest of Europe
-
4. Middle East & Africa
- 4.1. Turkey
- 4.2. Israel
- 4.3. GCC
- 4.4. North Africa
- 4.5. South Africa
- 4.6. Rest of Middle East & Africa
-
5. Asia Pacific
- 5.1. China
- 5.2. India
- 5.3. Japan
- 5.4. South Korea
- 5.5. ASEAN
- 5.6. Oceania
- 5.7. Rest of Asia Pacific
Water Rescue Manikins Regional Market Share
Geographic Coverage of Water Rescue Manikins
Water Rescue Manikins REPORT HIGHLIGHTS
| Aspects | Details |
|---|---|
| Study Period | 2020-2034 |
| Base Year | 2025 |
| Estimated Year | 2026 |
| Forecast Period | 2026-2034 |
| Historical Period | 2020-2025 |
| Growth Rate | CAGR of 9.6% from 2020-2034 |
| Segmentation |
|
Table of Contents
- 1. Introduction
- 1.1. Research Scope
- 1.2. Market Segmentation
- 1.3. Research Methodology
- 1.4. Definitions and Assumptions
- 2. Executive Summary
- 2.1. Introduction
- 3. Market Dynamics
- 3.1. Introduction
- 3.2. Market Drivers
- 3.3. Market Restrains
- 3.4. Market Trends
- 4. Market Factor Analysis
- 4.1. Porters Five Forces
- 4.2. Supply/Value Chain
- 4.3. PESTEL analysis
- 4.4. Market Entropy
- 4.5. Patent/Trademark Analysis
- 5. Global Water Rescue Manikins Analysis, Insights and Forecast, 2020-2032
- 5.1. Market Analysis, Insights and Forecast - by Application
- 5.1.1. Hospital
- 5.1.2. School
- 5.1.3. Others
- 5.2. Market Analysis, Insights and Forecast - by Types
- 5.2.1. Adult Model
- 5.2.2. Adolescent Model
- 5.2.3. Child Model
- 5.2.4. Infant Model
- 5.3. Market Analysis, Insights and Forecast - by Region
- 5.3.1. North America
- 5.3.2. South America
- 5.3.3. Europe
- 5.3.4. Middle East & Africa
- 5.3.5. Asia Pacific
- 5.1. Market Analysis, Insights and Forecast - by Application
- 6. North America Water Rescue Manikins Analysis, Insights and Forecast, 2020-2032
- 6.1. Market Analysis, Insights and Forecast - by Application
- 6.1.1. Hospital
- 6.1.2. School
- 6.1.3. Others
- 6.2. Market Analysis, Insights and Forecast - by Types
- 6.2.1. Adult Model
- 6.2.2. Adolescent Model
- 6.2.3. Child Model
- 6.2.4. Infant Model
- 6.1. Market Analysis, Insights and Forecast - by Application
- 7. South America Water Rescue Manikins Analysis, Insights and Forecast, 2020-2032
- 7.1. Market Analysis, Insights and Forecast - by Application
- 7.1.1. Hospital
- 7.1.2. School
- 7.1.3. Others
- 7.2. Market Analysis, Insights and Forecast - by Types
- 7.2.1. Adult Model
- 7.2.2. Adolescent Model
- 7.2.3. Child Model
- 7.2.4. Infant Model
- 7.1. Market Analysis, Insights and Forecast - by Application
- 8. Europe Water Rescue Manikins Analysis, Insights and Forecast, 2020-2032
- 8.1. Market Analysis, Insights and Forecast - by Application
- 8.1.1. Hospital
- 8.1.2. School
- 8.1.3. Others
- 8.2. Market Analysis, Insights and Forecast - by Types
- 8.2.1. Adult Model
- 8.2.2. Adolescent Model
- 8.2.3. Child Model
- 8.2.4. Infant Model
- 8.1. Market Analysis, Insights and Forecast - by Application
- 9. Middle East & Africa Water Rescue Manikins Analysis, Insights and Forecast, 2020-2032
- 9.1. Market Analysis, Insights and Forecast - by Application
- 9.1.1. Hospital
- 9.1.2. School
- 9.1.3. Others
- 9.2. Market Analysis, Insights and Forecast - by Types
- 9.2.1. Adult Model
- 9.2.2. Adolescent Model
- 9.2.3. Child Model
- 9.2.4. Infant Model
- 9.1. Market Analysis, Insights and Forecast - by Application
- 10. Asia Pacific Water Rescue Manikins Analysis, Insights and Forecast, 2020-2032
- 10.1. Market Analysis, Insights and Forecast - by Application
- 10.1.1. Hospital
- 10.1.2. School
- 10.1.3. Others
- 10.2. Market Analysis, Insights and Forecast - by Types
- 10.2.1. Adult Model
- 10.2.2. Adolescent Model
- 10.2.3. Child Model
- 10.2.4. Infant Model
- 10.1. Market Analysis, Insights and Forecast - by Application
- 11. Competitive Analysis
- 11.1. Global Market Share Analysis 2025
- 11.2. Company Profiles
- 11.2.1 3B Scientific
- 11.2.1.1. Overview
- 11.2.1.2. Products
- 11.2.1.3. SWOT Analysis
- 11.2.1.4. Recent Developments
- 11.2.1.5. Financials (Based on Availability)
- 11.2.2 Ruth Lee
- 11.2.2.1. Overview
- 11.2.2.2. Products
- 11.2.2.3. SWOT Analysis
- 11.2.2.4. Recent Developments
- 11.2.2.5. Financials (Based on Availability)
- 11.2.3 Simulaids
- 11.2.3.1. Overview
- 11.2.3.2. Products
- 11.2.3.3. SWOT Analysis
- 11.2.3.4. Recent Developments
- 11.2.3.5. Financials (Based on Availability)
- 11.2.4 LifeTec Pty Ltd
- 11.2.4.1. Overview
- 11.2.4.2. Products
- 11.2.4.3. SWOT Analysis
- 11.2.4.4. Recent Developments
- 11.2.4.5. Financials (Based on Availability)
- 11.2.5 Emerald Marine Products
- 11.2.5.1. Overview
- 11.2.5.2. Products
- 11.2.5.3. SWOT Analysis
- 11.2.5.4. Recent Developments
- 11.2.5.5. Financials (Based on Availability)
- 11.2.6 Nasco Healthcare
- 11.2.6.1. Overview
- 11.2.6.2. Products
- 11.2.6.3. SWOT Analysis
- 11.2.6.4. Recent Developments
- 11.2.6.5. Financials (Based on Availability)
- 11.2.7 Medical Doctor Education Technology (Shenzhen)
- 11.2.7.1. Overview
- 11.2.7.2. Products
- 11.2.7.3. SWOT Analysis
- 11.2.7.4. Recent Developments
- 11.2.7.5. Financials (Based on Availability)
- 11.2.1 3B Scientific
List of Figures
- Figure 1: Global Water Rescue Manikins Revenue Breakdown (million, %) by Region 2025 & 2033
- Figure 2: Global Water Rescue Manikins Volume Breakdown (K, %) by Region 2025 & 2033
- Figure 3: North America Water Rescue Manikins Revenue (million), by Application 2025 & 2033
- Figure 4: North America Water Rescue Manikins Volume (K), by Application 2025 & 2033
- Figure 5: North America Water Rescue Manikins Revenue Share (%), by Application 2025 & 2033
- Figure 6: North America Water Rescue Manikins Volume Share (%), by Application 2025 & 2033
- Figure 7: North America Water Rescue Manikins Revenue (million), by Types 2025 & 2033
- Figure 8: North America Water Rescue Manikins Volume (K), by Types 2025 & 2033
- Figure 9: North America Water Rescue Manikins Revenue Share (%), by Types 2025 & 2033
- Figure 10: North America Water Rescue Manikins Volume Share (%), by Types 2025 & 2033
- Figure 11: North America Water Rescue Manikins Revenue (million), by Country 2025 & 2033
- Figure 12: North America Water Rescue Manikins Volume (K), by Country 2025 & 2033
- Figure 13: North America Water Rescue Manikins Revenue Share (%), by Country 2025 & 2033
- Figure 14: North America Water Rescue Manikins Volume Share (%), by Country 2025 & 2033
- Figure 15: South America Water Rescue Manikins Revenue (million), by Application 2025 & 2033
- Figure 16: South America Water Rescue Manikins Volume (K), by Application 2025 & 2033
- Figure 17: South America Water Rescue Manikins Revenue Share (%), by Application 2025 & 2033
- Figure 18: South America Water Rescue Manikins Volume Share (%), by Application 2025 & 2033
- Figure 19: South America Water Rescue Manikins Revenue (million), by Types 2025 & 2033
- Figure 20: South America Water Rescue Manikins Volume (K), by Types 2025 & 2033
- Figure 21: South America Water Rescue Manikins Revenue Share (%), by Types 2025 & 2033
- Figure 22: South America Water Rescue Manikins Volume Share (%), by Types 2025 & 2033
- Figure 23: South America Water Rescue Manikins Revenue (million), by Country 2025 & 2033
- Figure 24: South America Water Rescue Manikins Volume (K), by Country 2025 & 2033
- Figure 25: South America Water Rescue Manikins Revenue Share (%), by Country 2025 & 2033
- Figure 26: South America Water Rescue Manikins Volume Share (%), by Country 2025 & 2033
- Figure 27: Europe Water Rescue Manikins Revenue (million), by Application 2025 & 2033
- Figure 28: Europe Water Rescue Manikins Volume (K), by Application 2025 & 2033
- Figure 29: Europe Water Rescue Manikins Revenue Share (%), by Application 2025 & 2033
- Figure 30: Europe Water Rescue Manikins Volume Share (%), by Application 2025 & 2033
- Figure 31: Europe Water Rescue Manikins Revenue (million), by Types 2025 & 2033
- Figure 32: Europe Water Rescue Manikins Volume (K), by Types 2025 & 2033
- Figure 33: Europe Water Rescue Manikins Revenue Share (%), by Types 2025 & 2033
- Figure 34: Europe Water Rescue Manikins Volume Share (%), by Types 2025 & 2033
- Figure 35: Europe Water Rescue Manikins Revenue (million), by Country 2025 & 2033
- Figure 36: Europe Water Rescue Manikins Volume (K), by Country 2025 & 2033
- Figure 37: Europe Water Rescue Manikins Revenue Share (%), by Country 2025 & 2033
- Figure 38: Europe Water Rescue Manikins Volume Share (%), by Country 2025 & 2033
- Figure 39: Middle East & Africa Water Rescue Manikins Revenue (million), by Application 2025 & 2033
- Figure 40: Middle East & Africa Water Rescue Manikins Volume (K), by Application 2025 & 2033
- Figure 41: Middle East & Africa Water Rescue Manikins Revenue Share (%), by Application 2025 & 2033
- Figure 42: Middle East & Africa Water Rescue Manikins Volume Share (%), by Application 2025 & 2033
- Figure 43: Middle East & Africa Water Rescue Manikins Revenue (million), by Types 2025 & 2033
- Figure 44: Middle East & Africa Water Rescue Manikins Volume (K), by Types 2025 & 2033
- Figure 45: Middle East & Africa Water Rescue Manikins Revenue Share (%), by Types 2025 & 2033
- Figure 46: Middle East & Africa Water Rescue Manikins Volume Share (%), by Types 2025 & 2033
- Figure 47: Middle East & Africa Water Rescue Manikins Revenue (million), by Country 2025 & 2033
- Figure 48: Middle East & Africa Water Rescue Manikins Volume (K), by Country 2025 & 2033
- Figure 49: Middle East & Africa Water Rescue Manikins Revenue Share (%), by Country 2025 & 2033
- Figure 50: Middle East & Africa Water Rescue Manikins Volume Share (%), by Country 2025 & 2033
- Figure 51: Asia Pacific Water Rescue Manikins Revenue (million), by Application 2025 & 2033
- Figure 52: Asia Pacific Water Rescue Manikins Volume (K), by Application 2025 & 2033
- Figure 53: Asia Pacific Water Rescue Manikins Revenue Share (%), by Application 2025 & 2033
- Figure 54: Asia Pacific Water Rescue Manikins Volume Share (%), by Application 2025 & 2033
- Figure 55: Asia Pacific Water Rescue Manikins Revenue (million), by Types 2025 & 2033
- Figure 56: Asia Pacific Water Rescue Manikins Volume (K), by Types 2025 & 2033
- Figure 57: Asia Pacific Water Rescue Manikins Revenue Share (%), by Types 2025 & 2033
- Figure 58: Asia Pacific Water Rescue Manikins Volume Share (%), by Types 2025 & 2033
- Figure 59: Asia Pacific Water Rescue Manikins Revenue (million), by Country 2025 & 2033
- Figure 60: Asia Pacific Water Rescue Manikins Volume (K), by Country 2025 & 2033
- Figure 61: Asia Pacific Water Rescue Manikins Revenue Share (%), by Country 2025 & 2033
- Figure 62: Asia Pacific Water Rescue Manikins Volume Share (%), by Country 2025 & 2033
List of Tables
- Table 1: Global Water Rescue Manikins Revenue million Forecast, by Application 2020 & 2033
- Table 2: Global Water Rescue Manikins Volume K Forecast, by Application 2020 & 2033
- Table 3: Global Water Rescue Manikins Revenue million Forecast, by Types 2020 & 2033
- Table 4: Global Water Rescue Manikins Volume K Forecast, by Types 2020 & 2033
- Table 5: Global Water Rescue Manikins Revenue million Forecast, by Region 2020 & 2033
- Table 6: Global Water Rescue Manikins Volume K Forecast, by Region 2020 & 2033
- Table 7: Global Water Rescue Manikins Revenue million Forecast, by Application 2020 & 2033
- Table 8: Global Water Rescue Manikins Volume K Forecast, by Application 2020 & 2033
- Table 9: Global Water Rescue Manikins Revenue million Forecast, by Types 2020 & 2033
- Table 10: Global Water Rescue Manikins Volume K Forecast, by Types 2020 & 2033
- Table 11: Global Water Rescue Manikins Revenue million Forecast, by Country 2020 & 2033
- Table 12: Global Water Rescue Manikins Volume K Forecast, by Country 2020 & 2033
- Table 13: United States Water Rescue Manikins Revenue (million) Forecast, by Application 2020 & 2033
- Table 14: United States Water Rescue Manikins Volume (K) Forecast, by Application 2020 & 2033
- Table 15: Canada Water Rescue Manikins Revenue (million) Forecast, by Application 2020 & 2033
- Table 16: Canada Water Rescue Manikins Volume (K) Forecast, by Application 2020 & 2033
- Table 17: Mexico Water Rescue Manikins Revenue (million) Forecast, by Application 2020 & 2033
- Table 18: Mexico Water Rescue Manikins Volume (K) Forecast, by Application 2020 & 2033
- Table 19: Global Water Rescue Manikins Revenue million Forecast, by Application 2020 & 2033
- Table 20: Global Water Rescue Manikins Volume K Forecast, by Application 2020 & 2033
- Table 21: Global Water Rescue Manikins Revenue million Forecast, by Types 2020 & 2033
- Table 22: Global Water Rescue Manikins Volume K Forecast, by Types 2020 & 2033
- Table 23: Global Water Rescue Manikins Revenue million Forecast, by Country 2020 & 2033
- Table 24: Global Water Rescue Manikins Volume K Forecast, by Country 2020 & 2033
- Table 25: Brazil Water Rescue Manikins Revenue (million) Forecast, by Application 2020 & 2033
- Table 26: Brazil Water Rescue Manikins Volume (K) Forecast, by Application 2020 & 2033
- Table 27: Argentina Water Rescue Manikins Revenue (million) Forecast, by Application 2020 & 2033
- Table 28: Argentina Water Rescue Manikins Volume (K) Forecast, by Application 2020 & 2033
- Table 29: Rest of South America Water Rescue Manikins Revenue (million) Forecast, by Application 2020 & 2033
- Table 30: Rest of South America Water Rescue Manikins Volume (K) Forecast, by Application 2020 & 2033
- Table 31: Global Water Rescue Manikins Revenue million Forecast, by Application 2020 & 2033
- Table 32: Global Water Rescue Manikins Volume K Forecast, by Application 2020 & 2033
- Table 33: Global Water Rescue Manikins Revenue million Forecast, by Types 2020 & 2033
- Table 34: Global Water Rescue Manikins Volume K Forecast, by Types 2020 & 2033
- Table 35: Global Water Rescue Manikins Revenue million Forecast, by Country 2020 & 2033
- Table 36: Global Water Rescue Manikins Volume K Forecast, by Country 2020 & 2033
- Table 37: United Kingdom Water Rescue Manikins Revenue (million) Forecast, by Application 2020 & 2033
- Table 38: United Kingdom Water Rescue Manikins Volume (K) Forecast, by Application 2020 & 2033
- Table 39: Germany Water Rescue Manikins Revenue (million) Forecast, by Application 2020 & 2033
- Table 40: Germany Water Rescue Manikins Volume (K) Forecast, by Application 2020 & 2033
- Table 41: France Water Rescue Manikins Revenue (million) Forecast, by Application 2020 & 2033
- Table 42: France Water Rescue Manikins Volume (K) Forecast, by Application 2020 & 2033
- Table 43: Italy Water Rescue Manikins Revenue (million) Forecast, by Application 2020 & 2033
- Table 44: Italy Water Rescue Manikins Volume (K) Forecast, by Application 2020 & 2033
- Table 45: Spain Water Rescue Manikins Revenue (million) Forecast, by Application 2020 & 2033
- Table 46: Spain Water Rescue Manikins Volume (K) Forecast, by Application 2020 & 2033
- Table 47: Russia Water Rescue Manikins Revenue (million) Forecast, by Application 2020 & 2033
- Table 48: Russia Water Rescue Manikins Volume (K) Forecast, by Application 2020 & 2033
- Table 49: Benelux Water Rescue Manikins Revenue (million) Forecast, by Application 2020 & 2033
- Table 50: Benelux Water Rescue Manikins Volume (K) Forecast, by Application 2020 & 2033
- Table 51: Nordics Water Rescue Manikins Revenue (million) Forecast, by Application 2020 & 2033
- Table 52: Nordics Water Rescue Manikins Volume (K) Forecast, by Application 2020 & 2033
- Table 53: Rest of Europe Water Rescue Manikins Revenue (million) Forecast, by Application 2020 & 2033
- Table 54: Rest of Europe Water Rescue Manikins Volume (K) Forecast, by Application 2020 & 2033
- Table 55: Global Water Rescue Manikins Revenue million Forecast, by Application 2020 & 2033
- Table 56: Global Water Rescue Manikins Volume K Forecast, by Application 2020 & 2033
- Table 57: Global Water Rescue Manikins Revenue million Forecast, by Types 2020 & 2033
- Table 58: Global Water Rescue Manikins Volume K Forecast, by Types 2020 & 2033
- Table 59: Global Water Rescue Manikins Revenue million Forecast, by Country 2020 & 2033
- Table 60: Global Water Rescue Manikins Volume K Forecast, by Country 2020 & 2033
- Table 61: Turkey Water Rescue Manikins Revenue (million) Forecast, by Application 2020 & 2033
- Table 62: Turkey Water Rescue Manikins Volume (K) Forecast, by Application 2020 & 2033
- Table 63: Israel Water Rescue Manikins Revenue (million) Forecast, by Application 2020 & 2033
- Table 64: Israel Water Rescue Manikins Volume (K) Forecast, by Application 2020 & 2033
- Table 65: GCC Water Rescue Manikins Revenue (million) Forecast, by Application 2020 & 2033
- Table 66: GCC Water Rescue Manikins Volume (K) Forecast, by Application 2020 & 2033
- Table 67: North Africa Water Rescue Manikins Revenue (million) Forecast, by Application 2020 & 2033
- Table 68: North Africa Water Rescue Manikins Volume (K) Forecast, by Application 2020 & 2033
- Table 69: South Africa Water Rescue Manikins Revenue (million) Forecast, by Application 2020 & 2033
- Table 70: South Africa Water Rescue Manikins Volume (K) Forecast, by Application 2020 & 2033
- Table 71: Rest of Middle East & Africa Water Rescue Manikins Revenue (million) Forecast, by Application 2020 & 2033
- Table 72: Rest of Middle East & Africa Water Rescue Manikins Volume (K) Forecast, by Application 2020 & 2033
- Table 73: Global Water Rescue Manikins Revenue million Forecast, by Application 2020 & 2033
- Table 74: Global Water Rescue Manikins Volume K Forecast, by Application 2020 & 2033
- Table 75: Global Water Rescue Manikins Revenue million Forecast, by Types 2020 & 2033
- Table 76: Global Water Rescue Manikins Volume K Forecast, by Types 2020 & 2033
- Table 77: Global Water Rescue Manikins Revenue million Forecast, by Country 2020 & 2033
- Table 78: Global Water Rescue Manikins Volume K Forecast, by Country 2020 & 2033
- Table 79: China Water Rescue Manikins Revenue (million) Forecast, by Application 2020 & 2033
- Table 80: China Water Rescue Manikins Volume (K) Forecast, by Application 2020 & 2033
- Table 81: India Water Rescue Manikins Revenue (million) Forecast, by Application 2020 & 2033
- Table 82: India Water Rescue Manikins Volume (K) Forecast, by Application 2020 & 2033
- Table 83: Japan Water Rescue Manikins Revenue (million) Forecast, by Application 2020 & 2033
- Table 84: Japan Water Rescue Manikins Volume (K) Forecast, by Application 2020 & 2033
- Table 85: South Korea Water Rescue Manikins Revenue (million) Forecast, by Application 2020 & 2033
- Table 86: South Korea Water Rescue Manikins Volume (K) Forecast, by Application 2020 & 2033
- Table 87: ASEAN Water Rescue Manikins Revenue (million) Forecast, by Application 2020 & 2033
- Table 88: ASEAN Water Rescue Manikins Volume (K) Forecast, by Application 2020 & 2033
- Table 89: Oceania Water Rescue Manikins Revenue (million) Forecast, by Application 2020 & 2033
- Table 90: Oceania Water Rescue Manikins Volume (K) Forecast, by Application 2020 & 2033
- Table 91: Rest of Asia Pacific Water Rescue Manikins Revenue (million) Forecast, by Application 2020 & 2033
- Table 92: Rest of Asia Pacific Water Rescue Manikins Volume (K) Forecast, by Application 2020 & 2033
Frequently Asked Questions
1. What is the projected Compound Annual Growth Rate (CAGR) of the Water Rescue Manikins?
The projected CAGR is approximately 9.6%.
2. Which companies are prominent players in the Water Rescue Manikins?
Key companies in the market include 3B Scientific, Ruth Lee, Simulaids, LifeTec Pty Ltd, Emerald Marine Products, Nasco Healthcare, Medical Doctor Education Technology (Shenzhen).
3. What are the main segments of the Water Rescue Manikins?
The market segments include Application, Types.
4. Can you provide details about the market size?
The market size is estimated to be USD 151.82 million as of 2022.
5. What are some drivers contributing to market growth?
N/A
6. What are the notable trends driving market growth?
N/A
7. Are there any restraints impacting market growth?
N/A
8. Can you provide examples of recent developments in the market?
N/A
9. What pricing options are available for accessing the report?
Pricing options include single-user, multi-user, and enterprise licenses priced at USD 4350.00, USD 6525.00, and USD 8700.00 respectively.
10. Is the market size provided in terms of value or volume?
The market size is provided in terms of value, measured in million and volume, measured in K.
11. Are there any specific market keywords associated with the report?
Yes, the market keyword associated with the report is "Water Rescue Manikins," which aids in identifying and referencing the specific market segment covered.
12. How do I determine which pricing option suits my needs best?
The pricing options vary based on user requirements and access needs. Individual users may opt for single-user licenses, while businesses requiring broader access may choose multi-user or enterprise licenses for cost-effective access to the report.
13. Are there any additional resources or data provided in the Water Rescue Manikins report?
While the report offers comprehensive insights, it's advisable to review the specific contents or supplementary materials provided to ascertain if additional resources or data are available.
14. How can I stay updated on further developments or reports in the Water Rescue Manikins?
To stay informed about further developments, trends, and reports in the Water Rescue Manikins, consider subscribing to industry newsletters, following relevant companies and organizations, or regularly checking reputable industry news sources and publications.
Methodology
Step 1 - Identification of Relevant Samples Size from Population Database


Step 2 - Approaches for Defining Global Market Size (Value, Volume* & Price*)

Note*: In applicable scenarios
Step 3 - Data Sources
Primary Research
- Web Analytics
- Survey Reports
- Research Institute
- Latest Research Reports
- Opinion Leaders
Secondary Research
- Annual Reports
- White Paper
- Latest Press Release
- Industry Association
- Paid Database
- Investor Presentations

Step 4 - Data Triangulation
Involves using different sources of information in order to increase the validity of a study
These sources are likely to be stakeholders in a program - participants, other researchers, program staff, other community members, and so on.
Then we put all data in single framework & apply various statistical tools to find out the dynamic on the market.
During the analysis stage, feedback from the stakeholder groups would be compared to determine areas of agreement as well as areas of divergence