

Key Insights
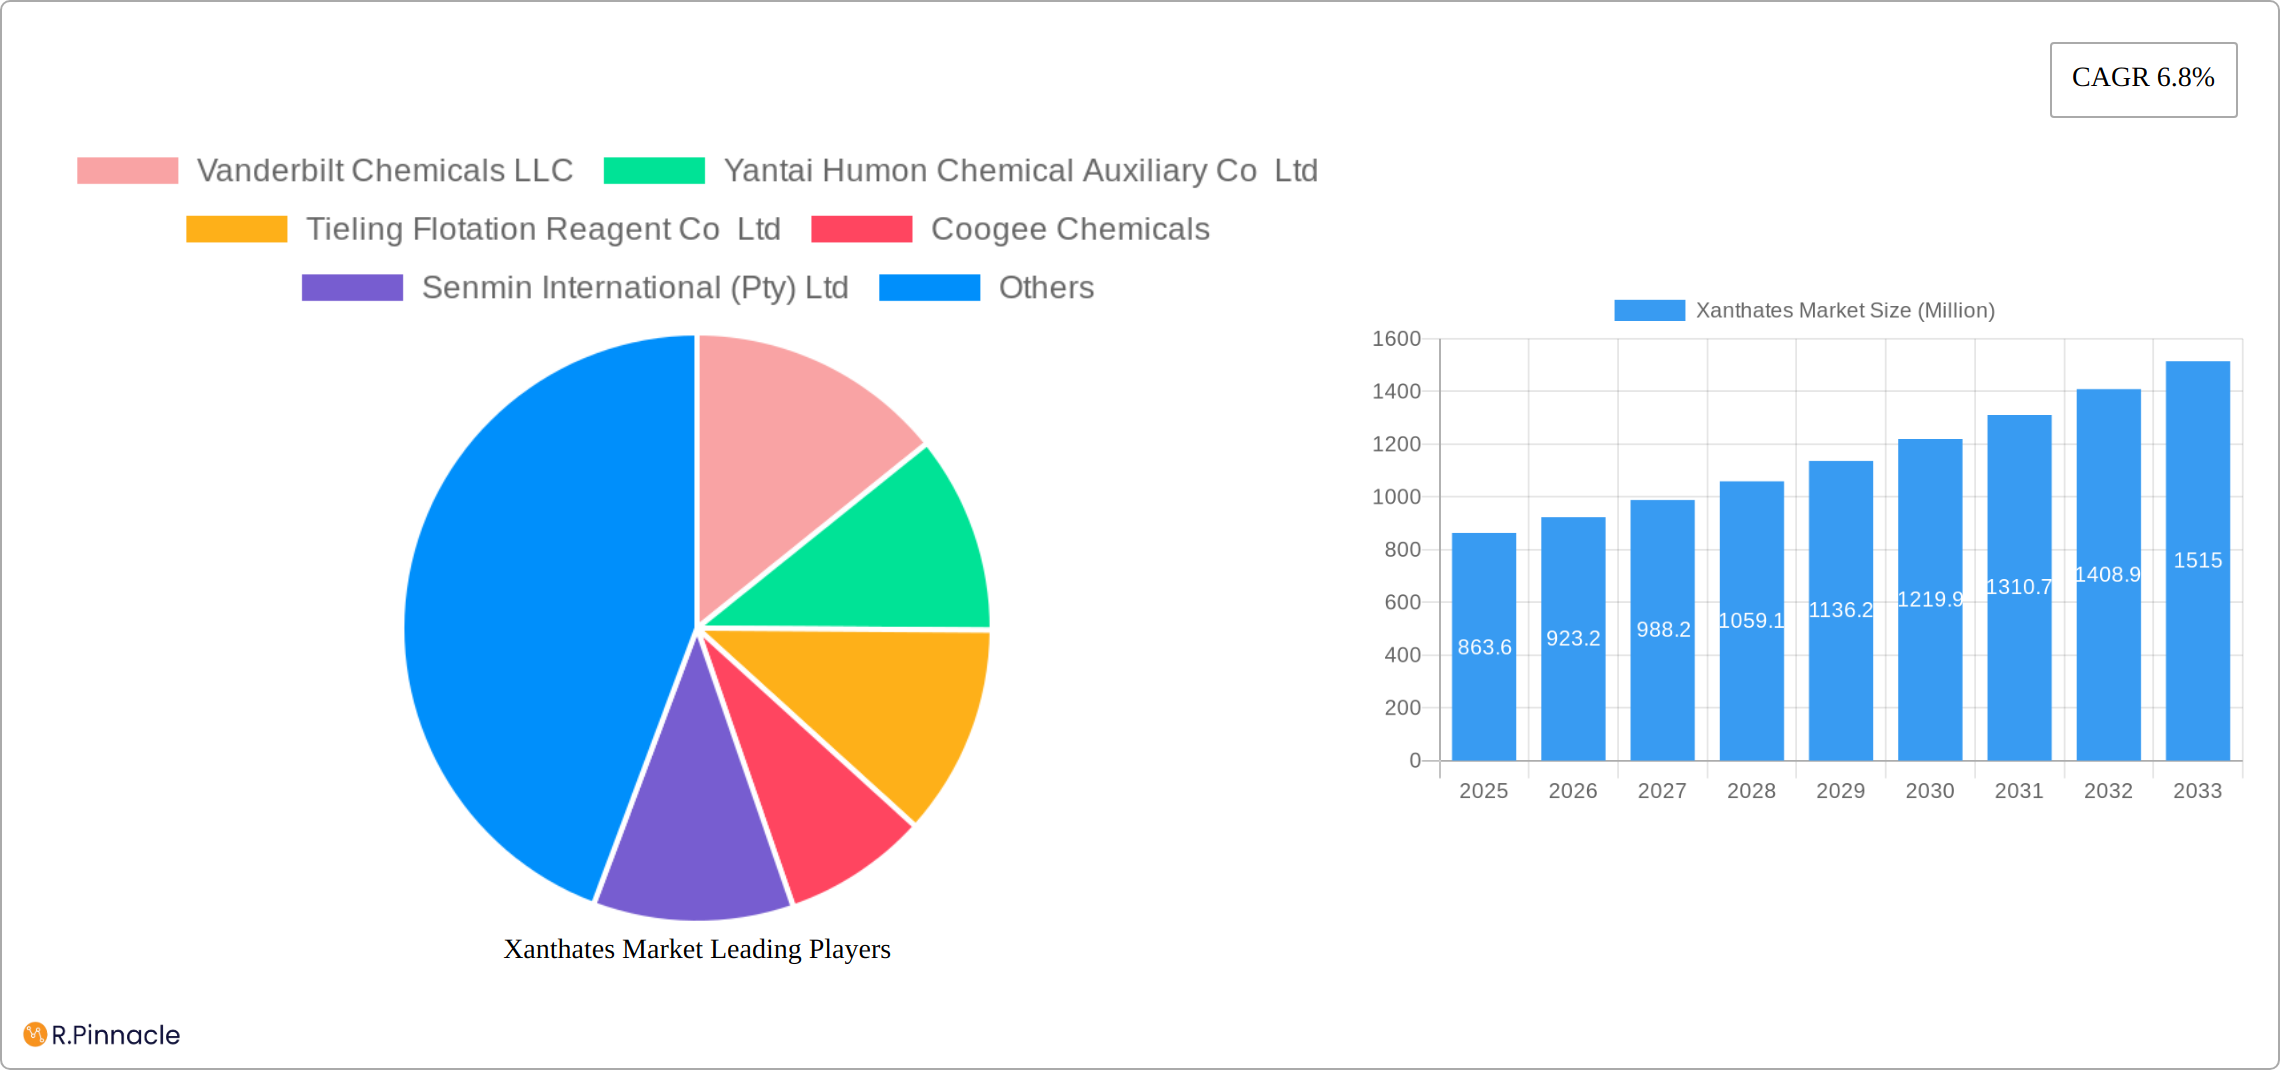
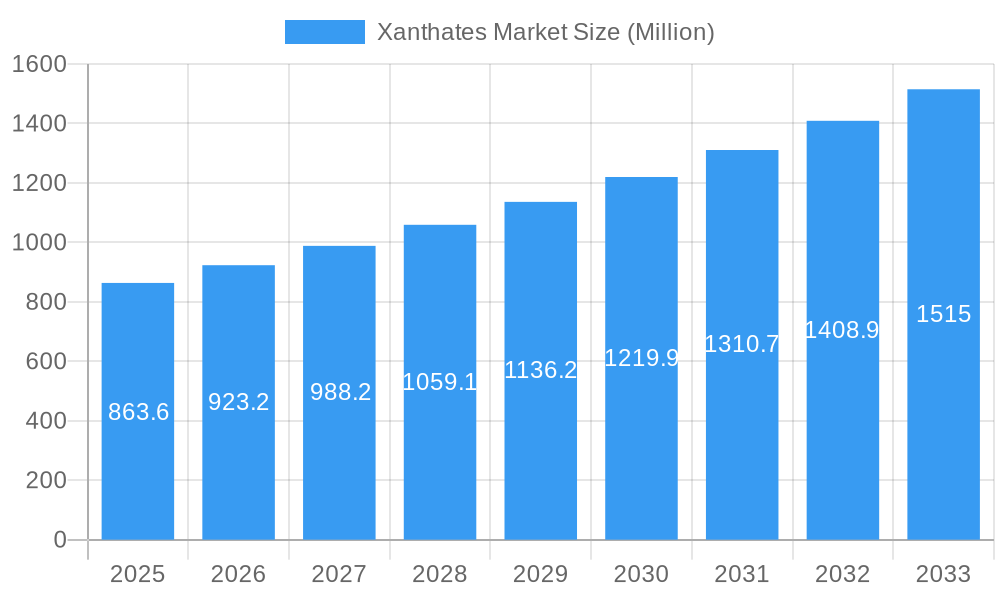
The global xanthates market, valued at $863.6 million in 2025, is projected to experience robust growth, driven by a compound annual growth rate (CAGR) of 6.8% from 2025 to 2033. This expansion is fueled primarily by the burgeoning mining industry, particularly the increasing demand for copper, gold, and other minerals. The rising global population and subsequent infrastructure development further contribute to this market's growth trajectory. Specific growth drivers include advancements in flotation techniques, leading to enhanced efficiency in mineral extraction, and the increasing adoption of xanthates as efficient and cost-effective collectors in the mining process. While the market faces restraints such as stringent environmental regulations concerning chemical usage and fluctuating raw material prices, the overall positive outlook is strengthened by the expanding application of xanthates in rubber processing and agrochemicals, which offer diversification and growth opportunities beyond the dominant mining sector. The segmentation by product type (Sodium Ethyl Xanthate, Sodium Isopropyl Xanthate, etc.) and application (mining, rubber processing, etc.) allows for a granular understanding of market dynamics and provides insights for strategic decision-making. Geographic analysis reveals significant regional variations, with Asia-Pacific expected to maintain a leading market share due to the high concentration of mining activities and rapid industrialization. North America and Europe also present substantial opportunities, particularly focusing on sustainable mining practices and technological advancements.
Xanthates Market Market Size (In Million)
The competitive landscape of the xanthates market is characterized by a mix of established multinational corporations and regional players. Key players are constantly innovating and investing in research and development to improve product efficacy, reduce environmental impact, and explore new applications. Strategic collaborations, mergers, and acquisitions are common strategies used to expand market reach and strengthen competitive positioning. The future growth of the xanthates market hinges on the continuous evolution of mining techniques, the adoption of sustainable practices within the industry, and the successful penetration of xanthate applications beyond traditional sectors. A proactive approach to addressing environmental concerns and leveraging technological advancements will be critical for market players to maintain a competitive edge and capitalize on the anticipated growth opportunities in the years ahead.
Xanthates Market Company Market Share
Xanthates Market: A Comprehensive Report 2019-2033
This in-depth report provides a comprehensive analysis of the Xanthates Market, offering invaluable insights for industry professionals, investors, and strategic decision-makers. Covering the period from 2019 to 2033, with 2025 as the base and estimated year, this report unveils the market's dynamics, growth drivers, challenges, and future prospects. The study incorporates detailed segmentations by product type and application, offering a granular understanding of market trends and opportunities.
Xanthates Market Structure & Innovation Trends
The Xanthates market exhibits a moderately concentrated structure, with key players like Vanderbilt Chemicals LLC, Yantai Humon Chemical Auxiliary Co Ltd, and Orica Limited holding significant market share. The market share distribution varies across different product types and geographic regions. Precise market share figures will be detailed in the full report, but preliminary estimates suggest Vanderbilt Chemicals LLC holds approximately xx% market share in 2025, while Yantai Humon holds approximately xx%.
Innovation in the Xanthates market is driven by the need for enhanced efficiency, improved selectivity in mineral processing, and environmentally friendly alternatives. Regulatory frameworks, particularly those concerning environmental protection and worker safety, significantly influence product development and manufacturing processes. The emergence of bio-based xanthates and the ongoing research on improving the performance and sustainability of existing products are key innovation drivers. Product substitutes, primarily other flotation reagents, are a significant factor, driving innovation in terms of cost-effectiveness and performance. Market consolidation through M&A activity is also observed, with deal values in the xx Million range recorded in recent years (Specific deal details and values are included in the full report). End-user demographics, primarily mining companies and rubber processors, influence demand patterns and product specifications.
Xanthates Market Dynamics & Trends
The Xanthates market is projected to witness a CAGR of xx% during the forecast period (2025-2033). This growth is primarily fueled by the increasing demand from the mining industry, particularly in regions experiencing robust mining activities. The rising global consumption of rubber, coupled with advancements in rubber processing techniques, further contributes to market expansion. Technological disruptions, such as the adoption of advanced process control and automation in mining operations, influence the demand for high-performance xanthates. Consumer preferences are shifting towards environmentally benign and more efficient reagents, driving the development of sustainable xanthate alternatives. Competitive dynamics are characterized by intense competition among established players and the emergence of new entrants, leading to price pressures and innovation. Market penetration of specific xanthate types, like sodium ethyl xanthate, is already high in established mining regions, but untapped potential exists in developing economies.
Dominant Regions & Segments in Xanthates Market
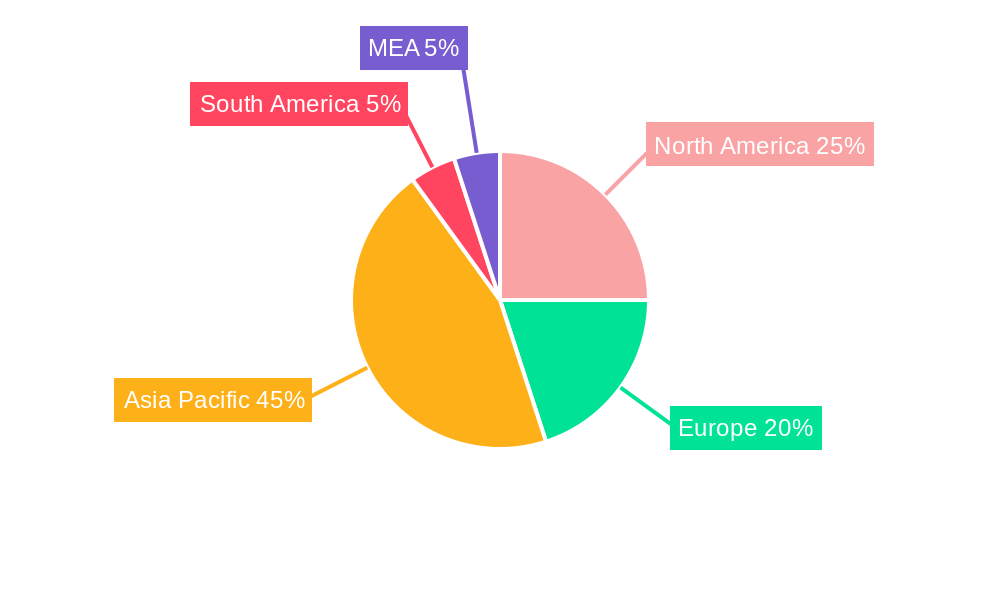
The Asia-Pacific region holds a commanding position in the global xanthates market, fueled by the substantial concentration of mining and rubber processing industries in countries such as China, India, and Australia. Within the product landscape, Sodium Ethyl Xanthate maintains the largest market share, owing to its widespread applicability and cost-effectiveness. The mining sector represents the most significant revenue contributor to the overall market, followed by the rubber processing industry. This regional dominance is further solidified by several key factors.
Key Drivers of Asia-Pacific Dominance:
- Rapid Industrialization and Urbanization: The region's burgeoning economies are driving up demand for raw materials and infrastructure development.
- Significant Investments in Mining Infrastructure: Increased capital expenditure in mining operations enhances production capacity and contributes to market growth.
- Growing Demand for Minerals and Metals: The rise of emerging economies and the global expansion of industries like construction and manufacturing fuel demand for essential minerals.
- Supportive Government Policies and Regulations: Favorable regulatory environments and government incentives encourage investment and expansion within the mining sector.
Dominant Market Segments: A Deeper Dive
- Product Type: While Sodium Ethyl Xanthate leads due to its cost-efficiency and broad applications, Sodium Isopropyl Xanthate and Sodium Isobutyl Xanthate also hold substantial shares, catering to niche applications requiring enhanced performance characteristics. The market is witnessing innovation in product formulations to meet specific industry needs.
- Application: The mining industry remains the cornerstone of the xanthates market, its growth intrinsically linked to global economic trends and the demand for industrial metals. The rubber processing segment, though smaller, constitutes a significant and stable market segment, providing a buffer against fluctuations in mining demand.
Xanthates Market Product Innovations
Recent product developments focus on enhancing selectivity, improving performance at lower concentrations, and reducing environmental impact. New formulations aim for enhanced compatibility with different ore types and improved recovery rates. These innovations offer significant competitive advantages, leading to increased market share and improved profitability for producers. The focus on greener technologies also aligns with growing environmental regulations, opening up new market opportunities.
Report Scope & Segmentation Analysis
This report provides a detailed segmentation of the Xanthates market based on product type (Sodium Ethyl Xanthate, Sodium Isopropyl Xanthate, Sodium Isobutyl Xanthate, Potassium Amyl Xanthate, Other Product Types) and application (Mining, Rubber Processing, Agrochemicals, Other Applications). Each segment is analyzed based on market size, growth rate, and competitive landscape, offering a comprehensive picture of current and future market dynamics. Detailed growth projections and market size data for each segment are provided in the full report.
Key Drivers of Xanthates Market Growth
The xanthates market's continued expansion is driven by a confluence of factors. The escalating global demand for minerals and metals, particularly in developing nations, is a primary driver. This is complemented by the steady growth of the global rubber industry and proactive government initiatives aimed at improving mining efficiency and responsible resource utilization. Technological advancements, including the development of higher-performing, more environmentally friendly xanthate formulations, further stimulate market growth. Finally, robust economic conditions in key regions create a favorable environment for market expansion.
Challenges in the Xanthates Market Sector
Despite its growth trajectory, the xanthates market faces several challenges. Fluctuations in raw material prices pose a significant risk to profitability and pricing stability. Stringent environmental regulations necessitate investments in sustainable production practices and potentially limit the use of certain formulations. Furthermore, intense competition from both established players and new entrants, coupled with the availability of substitute products, exerts continuous pressure on market participants. A detailed analysis of these challenges and their quantitative impact on revenue and market share is available in the complete report.
Emerging Opportunities in Xanthates Market
Emerging opportunities lie in the development of bio-based and sustainable xanthates, the expansion into new geographical markets (particularly in Africa and South America), and the growing demand for specialized xanthates catering to niche applications in industries beyond mining and rubber processing.
Leading Players in the Xanthates Market
- Vanderbilt Chemicals LLC
- Yantai Humon Chemical Auxiliary Co Ltd
- Tieling Flotation Reagent Co Ltd
- Coogee Chemicals
- Senmin International (Pty) Ltd
- QiXia TongDa Flotation Reagent Co Ltd
- CTC Energy & Mining Company
- Orica Limited
- Amruta Industries
- SNF Group
Key Developments in Xanthates Market Industry
- 2024 Q4: Orica Limited's launch of a new, environmentally sustainable xanthate formulation underscores the industry's shift towards greener technologies and highlights a growing consumer and regulatory focus on sustainability.
- 2023 Q2: The merger of two smaller xanthate producers resulted in a more consolidated market structure, potentially leading to increased efficiency and market share adjustments. (Specific details regarding the companies and financial aspects of this merger are provided within the full report.)
- 2022 Q1: Vanderbilt Chemicals LLC's investment in expanded production capacity reflects the industry's response to rising demand and its confidence in the future prospects of the xanthates market.
Future Outlook for Xanthates Market
The future of the Xanthates market appears promising, with continued growth driven by sustained demand from core sectors and the emergence of novel applications. Strategic partnerships, focused research and development initiatives on sustainable products, and expansion into new markets represent key growth accelerators. The market is expected to maintain a steady growth trajectory throughout the forecast period.
Xanthates Market Segmentation
-
1. Product Type
- 1.1. Sodium Ethyl Xanthate
- 1.2. Sodium Isopropyl Xanthate
- 1.3. Sodium Isobutyl Xanthate
- 1.4. Potassium Amyl Xanthate
- 1.5. Other Product Types
-
2. Application
- 2.1. Mining
- 2.2. Rubber Processing
- 2.3. Agrochemicals
- 2.4. Other Applications
Xanthates Market Segmentation By Geography
-
1. Asia Pacific
- 1.1. China
- 1.2. India
- 1.3. Japan
- 1.4. South Korea
- 1.5. Rest of Asia Pacific
-
2. North America
- 2.1. United States
- 2.2. Canada
- 2.3. Mexico
-
3. Europe
- 3.1. Germany
- 3.2. United Kingdom
- 3.3. Italy
- 3.4. France
- 3.5. Rest of Europe
-
4. South America
- 4.1. Brazil
- 4.2. Argentina
- 4.3. Rest of South America
-
5. Middle East and Africa
- 5.1. Saudi Arabia
- 5.2. South Africa
- 5.3. Rest of Middle East and Africa
Xanthates Market Regional Market Share
Geographic Coverage of Xanthates Market
Xanthates Market REPORT HIGHLIGHTS
| Aspects | Details |
|---|---|
| Study Period | 2020-2034 |
| Base Year | 2025 |
| Estimated Year | 2026 |
| Forecast Period | 2026-2034 |
| Historical Period | 2020-2025 |
| Growth Rate | CAGR of 6.8% from 2020-2034 |
| Segmentation |
|
Table of Contents
- 1. Introduction
- 1.1. Research Scope
- 1.2. Market Segmentation
- 1.3. Research Objective
- 1.4. Definitions and Assumptions
- 2. Executive Summary
- 2.1. Market Snapshot
- 3. Market Dynamics
- 3.1. Market Drivers
- 3.2. Market Restrains
- 3.3. Market Trends
- 3.4. Market Opportunities
- 4. Market Factor Analysis
- 4.1. Porters Five Forces
- 4.1.1. Bargaining Power of Suppliers
- 4.1.2. Bargaining Power of Buyers
- 4.1.3. Threat of New Entrants
- 4.1.4. Threat of Substitutes
- 4.1.5. Competitive Rivalry
- 4.2. PESTEL analysis
- 4.3. BCG Analysis
- 4.3.1. Stars (High Growth, High Market Share)
- 4.3.2. Cash Cows (Low Growth, High Market Share)
- 4.3.3. Question Mark (High Growth, Low Market Share)
- 4.3.4. Dogs (Low Growth, Low Market Share)
- 4.4. Ansoff Matrix Analysis
- 4.5. Supply Chain Analysis
- 4.6. Regulatory Landscape
- 4.7. Current Market Potential and Opportunity Assessment (TAM–SAM–SOM Framework)
- 4.8. PRI Analyst Note
- 4.1. Porters Five Forces
- 5. Market Analysis, Insights and Forecast 2021-2033
- 5.1. Market Analysis, Insights and Forecast - by Product Type
- 5.1.1. Sodium Ethyl Xanthate
- 5.1.2. Sodium Isopropyl Xanthate
- 5.1.3. Sodium Isobutyl Xanthate
- 5.1.4. Potassium Amyl Xanthate
- 5.1.5. Other Product Types
- 5.2. Market Analysis, Insights and Forecast - by Application
- 5.2.1. Mining
- 5.2.2. Rubber Processing
- 5.2.3. Agrochemicals
- 5.2.4. Other Applications
- 5.3. Market Analysis, Insights and Forecast - by Region
- 5.3.1. Asia Pacific
- 5.3.2. North America
- 5.3.3. Europe
- 5.3.4. South America
- 5.3.5. Middle East and Africa
- 5.1. Market Analysis, Insights and Forecast - by Product Type
- 6. Global Xanthates Market Analysis, Insights and Forecast, 2021-2033
- 6.1. Market Analysis, Insights and Forecast - by Product Type
- 6.1.1. Sodium Ethyl Xanthate
- 6.1.2. Sodium Isopropyl Xanthate
- 6.1.3. Sodium Isobutyl Xanthate
- 6.1.4. Potassium Amyl Xanthate
- 6.1.5. Other Product Types
- 6.2. Market Analysis, Insights and Forecast - by Application
- 6.2.1. Mining
- 6.2.2. Rubber Processing
- 6.2.3. Agrochemicals
- 6.2.4. Other Applications
- 6.1. Market Analysis, Insights and Forecast - by Product Type
- 7. Asia Pacific Xanthates Market Analysis, Insights and Forecast, 2020-2032
- 7.1. Market Analysis, Insights and Forecast - by Product Type
- 7.1.1. Sodium Ethyl Xanthate
- 7.1.2. Sodium Isopropyl Xanthate
- 7.1.3. Sodium Isobutyl Xanthate
- 7.1.4. Potassium Amyl Xanthate
- 7.1.5. Other Product Types
- 7.2. Market Analysis, Insights and Forecast - by Application
- 7.2.1. Mining
- 7.2.2. Rubber Processing
- 7.2.3. Agrochemicals
- 7.2.4. Other Applications
- 7.1. Market Analysis, Insights and Forecast - by Product Type
- 8. North America Xanthates Market Analysis, Insights and Forecast, 2020-2032
- 8.1. Market Analysis, Insights and Forecast - by Product Type
- 8.1.1. Sodium Ethyl Xanthate
- 8.1.2. Sodium Isopropyl Xanthate
- 8.1.3. Sodium Isobutyl Xanthate
- 8.1.4. Potassium Amyl Xanthate
- 8.1.5. Other Product Types
- 8.2. Market Analysis, Insights and Forecast - by Application
- 8.2.1. Mining
- 8.2.2. Rubber Processing
- 8.2.3. Agrochemicals
- 8.2.4. Other Applications
- 8.1. Market Analysis, Insights and Forecast - by Product Type
- 9. Europe Xanthates Market Analysis, Insights and Forecast, 2020-2032
- 9.1. Market Analysis, Insights and Forecast - by Product Type
- 9.1.1. Sodium Ethyl Xanthate
- 9.1.2. Sodium Isopropyl Xanthate
- 9.1.3. Sodium Isobutyl Xanthate
- 9.1.4. Potassium Amyl Xanthate
- 9.1.5. Other Product Types
- 9.2. Market Analysis, Insights and Forecast - by Application
- 9.2.1. Mining
- 9.2.2. Rubber Processing
- 9.2.3. Agrochemicals
- 9.2.4. Other Applications
- 9.1. Market Analysis, Insights and Forecast - by Product Type
- 10. South America Xanthates Market Analysis, Insights and Forecast, 2020-2032
- 10.1. Market Analysis, Insights and Forecast - by Product Type
- 10.1.1. Sodium Ethyl Xanthate
- 10.1.2. Sodium Isopropyl Xanthate
- 10.1.3. Sodium Isobutyl Xanthate
- 10.1.4. Potassium Amyl Xanthate
- 10.1.5. Other Product Types
- 10.2. Market Analysis, Insights and Forecast - by Application
- 10.2.1. Mining
- 10.2.2. Rubber Processing
- 10.2.3. Agrochemicals
- 10.2.4. Other Applications
- 10.1. Market Analysis, Insights and Forecast - by Product Type
- 11. Middle East and Africa Xanthates Market Analysis, Insights and Forecast, 2020-2032
- 11.1. Market Analysis, Insights and Forecast - by Product Type
- 11.1.1. Sodium Ethyl Xanthate
- 11.1.2. Sodium Isopropyl Xanthate
- 11.1.3. Sodium Isobutyl Xanthate
- 11.1.4. Potassium Amyl Xanthate
- 11.1.5. Other Product Types
- 11.2. Market Analysis, Insights and Forecast - by Application
- 11.2.1. Mining
- 11.2.2. Rubber Processing
- 11.2.3. Agrochemicals
- 11.2.4. Other Applications
- 11.1. Market Analysis, Insights and Forecast - by Product Type
- 12. Competitive Analysis
- 12.1. Company Profiles
- 12.1.1 Vanderbilt Chemicals LLC
- 12.1.1.1. Company Overview
- 12.1.1.2. Products
- 12.1.1.3. Company Financials
- 12.1.1.4. SWOT Analysis
- 12.1.2 Yantai Humon Chemical Auxiliary Co Ltd
- 12.1.2.1. Company Overview
- 12.1.2.2. Products
- 12.1.2.3. Company Financials
- 12.1.2.4. SWOT Analysis
- 12.1.3 Tieling Flotation Reagent Co Ltd
- 12.1.3.1. Company Overview
- 12.1.3.2. Products
- 12.1.3.3. Company Financials
- 12.1.3.4. SWOT Analysis
- 12.1.4 Coogee Chemicals
- 12.1.4.1. Company Overview
- 12.1.4.2. Products
- 12.1.4.3. Company Financials
- 12.1.4.4. SWOT Analysis
- 12.1.5 Senmin International (Pty) Ltd
- 12.1.5.1. Company Overview
- 12.1.5.2. Products
- 12.1.5.3. Company Financials
- 12.1.5.4. SWOT Analysis
- 12.1.6 QiXia TongDa Flotation Reagent Co Ltd
- 12.1.6.1. Company Overview
- 12.1.6.2. Products
- 12.1.6.3. Company Financials
- 12.1.6.4. SWOT Analysis
- 12.1.7 CTC Energy & Mining Company
- 12.1.7.1. Company Overview
- 12.1.7.2. Products
- 12.1.7.3. Company Financials
- 12.1.7.4. SWOT Analysis
- 12.1.8 Orica Limited
- 12.1.8.1. Company Overview
- 12.1.8.2. Products
- 12.1.8.3. Company Financials
- 12.1.8.4. SWOT Analysis
- 12.1.9 Amruta Industries
- 12.1.9.1. Company Overview
- 12.1.9.2. Products
- 12.1.9.3. Company Financials
- 12.1.9.4. SWOT Analysis
- 12.1.10 SNF Group
- 12.1.10.1. Company Overview
- 12.1.10.2. Products
- 12.1.10.3. Company Financials
- 12.1.10.4. SWOT Analysis
- 12.1.1 Vanderbilt Chemicals LLC
- 12.2. Market Entropy
- 12.2.1 Company's Key Areas Served
- 12.2.2 Recent Developments
- 12.3. Company Market Share Analysis 2025
- 12.3.1 Top 5 Companies Market Share Analysis
- 12.3.2 Top 3 Companies Market Share Analysis
- 12.4. List of Potential Customers
- 13. Research Methodology
List of Figures
- Figure 1: Global Xanthates Market Revenue Breakdown (Million, %) by Region 2025 & 2033
- Figure 2: Global Xanthates Market Volume Breakdown (K Tons, %) by Region 2025 & 2033
- Figure 3: Asia Pacific Xanthates Market Revenue (Million), by Product Type 2025 & 2033
- Figure 4: Asia Pacific Xanthates Market Volume (K Tons), by Product Type 2025 & 2033
- Figure 5: Asia Pacific Xanthates Market Revenue Share (%), by Product Type 2025 & 2033
- Figure 6: Asia Pacific Xanthates Market Volume Share (%), by Product Type 2025 & 2033
- Figure 7: Asia Pacific Xanthates Market Revenue (Million), by Application 2025 & 2033
- Figure 8: Asia Pacific Xanthates Market Volume (K Tons), by Application 2025 & 2033
- Figure 9: Asia Pacific Xanthates Market Revenue Share (%), by Application 2025 & 2033
- Figure 10: Asia Pacific Xanthates Market Volume Share (%), by Application 2025 & 2033
- Figure 11: Asia Pacific Xanthates Market Revenue (Million), by Country 2025 & 2033
- Figure 12: Asia Pacific Xanthates Market Volume (K Tons), by Country 2025 & 2033
- Figure 13: Asia Pacific Xanthates Market Revenue Share (%), by Country 2025 & 2033
- Figure 14: Asia Pacific Xanthates Market Volume Share (%), by Country 2025 & 2033
- Figure 15: North America Xanthates Market Revenue (Million), by Product Type 2025 & 2033
- Figure 16: North America Xanthates Market Volume (K Tons), by Product Type 2025 & 2033
- Figure 17: North America Xanthates Market Revenue Share (%), by Product Type 2025 & 2033
- Figure 18: North America Xanthates Market Volume Share (%), by Product Type 2025 & 2033
- Figure 19: North America Xanthates Market Revenue (Million), by Application 2025 & 2033
- Figure 20: North America Xanthates Market Volume (K Tons), by Application 2025 & 2033
- Figure 21: North America Xanthates Market Revenue Share (%), by Application 2025 & 2033
- Figure 22: North America Xanthates Market Volume Share (%), by Application 2025 & 2033
- Figure 23: North America Xanthates Market Revenue (Million), by Country 2025 & 2033
- Figure 24: North America Xanthates Market Volume (K Tons), by Country 2025 & 2033
- Figure 25: North America Xanthates Market Revenue Share (%), by Country 2025 & 2033
- Figure 26: North America Xanthates Market Volume Share (%), by Country 2025 & 2033
- Figure 27: Europe Xanthates Market Revenue (Million), by Product Type 2025 & 2033
- Figure 28: Europe Xanthates Market Volume (K Tons), by Product Type 2025 & 2033
- Figure 29: Europe Xanthates Market Revenue Share (%), by Product Type 2025 & 2033
- Figure 30: Europe Xanthates Market Volume Share (%), by Product Type 2025 & 2033
- Figure 31: Europe Xanthates Market Revenue (Million), by Application 2025 & 2033
- Figure 32: Europe Xanthates Market Volume (K Tons), by Application 2025 & 2033
- Figure 33: Europe Xanthates Market Revenue Share (%), by Application 2025 & 2033
- Figure 34: Europe Xanthates Market Volume Share (%), by Application 2025 & 2033
- Figure 35: Europe Xanthates Market Revenue (Million), by Country 2025 & 2033
- Figure 36: Europe Xanthates Market Volume (K Tons), by Country 2025 & 2033
- Figure 37: Europe Xanthates Market Revenue Share (%), by Country 2025 & 2033
- Figure 38: Europe Xanthates Market Volume Share (%), by Country 2025 & 2033
- Figure 39: South America Xanthates Market Revenue (Million), by Product Type 2025 & 2033
- Figure 40: South America Xanthates Market Volume (K Tons), by Product Type 2025 & 2033
- Figure 41: South America Xanthates Market Revenue Share (%), by Product Type 2025 & 2033
- Figure 42: South America Xanthates Market Volume Share (%), by Product Type 2025 & 2033
- Figure 43: South America Xanthates Market Revenue (Million), by Application 2025 & 2033
- Figure 44: South America Xanthates Market Volume (K Tons), by Application 2025 & 2033
- Figure 45: South America Xanthates Market Revenue Share (%), by Application 2025 & 2033
- Figure 46: South America Xanthates Market Volume Share (%), by Application 2025 & 2033
- Figure 47: South America Xanthates Market Revenue (Million), by Country 2025 & 2033
- Figure 48: South America Xanthates Market Volume (K Tons), by Country 2025 & 2033
- Figure 49: South America Xanthates Market Revenue Share (%), by Country 2025 & 2033
- Figure 50: South America Xanthates Market Volume Share (%), by Country 2025 & 2033
- Figure 51: Middle East and Africa Xanthates Market Revenue (Million), by Product Type 2025 & 2033
- Figure 52: Middle East and Africa Xanthates Market Volume (K Tons), by Product Type 2025 & 2033
- Figure 53: Middle East and Africa Xanthates Market Revenue Share (%), by Product Type 2025 & 2033
- Figure 54: Middle East and Africa Xanthates Market Volume Share (%), by Product Type 2025 & 2033
- Figure 55: Middle East and Africa Xanthates Market Revenue (Million), by Application 2025 & 2033
- Figure 56: Middle East and Africa Xanthates Market Volume (K Tons), by Application 2025 & 2033
- Figure 57: Middle East and Africa Xanthates Market Revenue Share (%), by Application 2025 & 2033
- Figure 58: Middle East and Africa Xanthates Market Volume Share (%), by Application 2025 & 2033
- Figure 59: Middle East and Africa Xanthates Market Revenue (Million), by Country 2025 & 2033
- Figure 60: Middle East and Africa Xanthates Market Volume (K Tons), by Country 2025 & 2033
- Figure 61: Middle East and Africa Xanthates Market Revenue Share (%), by Country 2025 & 2033
- Figure 62: Middle East and Africa Xanthates Market Volume Share (%), by Country 2025 & 2033
List of Tables
- Table 1: Global Xanthates Market Revenue Million Forecast, by Product Type 2020 & 2033
- Table 2: Global Xanthates Market Volume K Tons Forecast, by Product Type 2020 & 2033
- Table 3: Global Xanthates Market Revenue Million Forecast, by Application 2020 & 2033
- Table 4: Global Xanthates Market Volume K Tons Forecast, by Application 2020 & 2033
- Table 5: Global Xanthates Market Revenue Million Forecast, by Region 2020 & 2033
- Table 6: Global Xanthates Market Volume K Tons Forecast, by Region 2020 & 2033
- Table 7: Global Xanthates Market Revenue Million Forecast, by Product Type 2020 & 2033
- Table 8: Global Xanthates Market Volume K Tons Forecast, by Product Type 2020 & 2033
- Table 9: Global Xanthates Market Revenue Million Forecast, by Application 2020 & 2033
- Table 10: Global Xanthates Market Volume K Tons Forecast, by Application 2020 & 2033
- Table 11: Global Xanthates Market Revenue Million Forecast, by Country 2020 & 2033
- Table 12: Global Xanthates Market Volume K Tons Forecast, by Country 2020 & 2033
- Table 13: China Xanthates Market Revenue (Million) Forecast, by Application 2020 & 2033
- Table 14: China Xanthates Market Volume (K Tons) Forecast, by Application 2020 & 2033
- Table 15: India Xanthates Market Revenue (Million) Forecast, by Application 2020 & 2033
- Table 16: India Xanthates Market Volume (K Tons) Forecast, by Application 2020 & 2033
- Table 17: Japan Xanthates Market Revenue (Million) Forecast, by Application 2020 & 2033
- Table 18: Japan Xanthates Market Volume (K Tons) Forecast, by Application 2020 & 2033
- Table 19: South Korea Xanthates Market Revenue (Million) Forecast, by Application 2020 & 2033
- Table 20: South Korea Xanthates Market Volume (K Tons) Forecast, by Application 2020 & 2033
- Table 21: Rest of Asia Pacific Xanthates Market Revenue (Million) Forecast, by Application 2020 & 2033
- Table 22: Rest of Asia Pacific Xanthates Market Volume (K Tons) Forecast, by Application 2020 & 2033
- Table 23: Global Xanthates Market Revenue Million Forecast, by Product Type 2020 & 2033
- Table 24: Global Xanthates Market Volume K Tons Forecast, by Product Type 2020 & 2033
- Table 25: Global Xanthates Market Revenue Million Forecast, by Application 2020 & 2033
- Table 26: Global Xanthates Market Volume K Tons Forecast, by Application 2020 & 2033
- Table 27: Global Xanthates Market Revenue Million Forecast, by Country 2020 & 2033
- Table 28: Global Xanthates Market Volume K Tons Forecast, by Country 2020 & 2033
- Table 29: United States Xanthates Market Revenue (Million) Forecast, by Application 2020 & 2033
- Table 30: United States Xanthates Market Volume (K Tons) Forecast, by Application 2020 & 2033
- Table 31: Canada Xanthates Market Revenue (Million) Forecast, by Application 2020 & 2033
- Table 32: Canada Xanthates Market Volume (K Tons) Forecast, by Application 2020 & 2033
- Table 33: Mexico Xanthates Market Revenue (Million) Forecast, by Application 2020 & 2033
- Table 34: Mexico Xanthates Market Volume (K Tons) Forecast, by Application 2020 & 2033
- Table 35: Global Xanthates Market Revenue Million Forecast, by Product Type 2020 & 2033
- Table 36: Global Xanthates Market Volume K Tons Forecast, by Product Type 2020 & 2033
- Table 37: Global Xanthates Market Revenue Million Forecast, by Application 2020 & 2033
- Table 38: Global Xanthates Market Volume K Tons Forecast, by Application 2020 & 2033
- Table 39: Global Xanthates Market Revenue Million Forecast, by Country 2020 & 2033
- Table 40: Global Xanthates Market Volume K Tons Forecast, by Country 2020 & 2033
- Table 41: Germany Xanthates Market Revenue (Million) Forecast, by Application 2020 & 2033
- Table 42: Germany Xanthates Market Volume (K Tons) Forecast, by Application 2020 & 2033
- Table 43: United Kingdom Xanthates Market Revenue (Million) Forecast, by Application 2020 & 2033
- Table 44: United Kingdom Xanthates Market Volume (K Tons) Forecast, by Application 2020 & 2033
- Table 45: Italy Xanthates Market Revenue (Million) Forecast, by Application 2020 & 2033
- Table 46: Italy Xanthates Market Volume (K Tons) Forecast, by Application 2020 & 2033
- Table 47: France Xanthates Market Revenue (Million) Forecast, by Application 2020 & 2033
- Table 48: France Xanthates Market Volume (K Tons) Forecast, by Application 2020 & 2033
- Table 49: Rest of Europe Xanthates Market Revenue (Million) Forecast, by Application 2020 & 2033
- Table 50: Rest of Europe Xanthates Market Volume (K Tons) Forecast, by Application 2020 & 2033
- Table 51: Global Xanthates Market Revenue Million Forecast, by Product Type 2020 & 2033
- Table 52: Global Xanthates Market Volume K Tons Forecast, by Product Type 2020 & 2033
- Table 53: Global Xanthates Market Revenue Million Forecast, by Application 2020 & 2033
- Table 54: Global Xanthates Market Volume K Tons Forecast, by Application 2020 & 2033
- Table 55: Global Xanthates Market Revenue Million Forecast, by Country 2020 & 2033
- Table 56: Global Xanthates Market Volume K Tons Forecast, by Country 2020 & 2033
- Table 57: Brazil Xanthates Market Revenue (Million) Forecast, by Application 2020 & 2033
- Table 58: Brazil Xanthates Market Volume (K Tons) Forecast, by Application 2020 & 2033
- Table 59: Argentina Xanthates Market Revenue (Million) Forecast, by Application 2020 & 2033
- Table 60: Argentina Xanthates Market Volume (K Tons) Forecast, by Application 2020 & 2033
- Table 61: Rest of South America Xanthates Market Revenue (Million) Forecast, by Application 2020 & 2033
- Table 62: Rest of South America Xanthates Market Volume (K Tons) Forecast, by Application 2020 & 2033
- Table 63: Global Xanthates Market Revenue Million Forecast, by Product Type 2020 & 2033
- Table 64: Global Xanthates Market Volume K Tons Forecast, by Product Type 2020 & 2033
- Table 65: Global Xanthates Market Revenue Million Forecast, by Application 2020 & 2033
- Table 66: Global Xanthates Market Volume K Tons Forecast, by Application 2020 & 2033
- Table 67: Global Xanthates Market Revenue Million Forecast, by Country 2020 & 2033
- Table 68: Global Xanthates Market Volume K Tons Forecast, by Country 2020 & 2033
- Table 69: Saudi Arabia Xanthates Market Revenue (Million) Forecast, by Application 2020 & 2033
- Table 70: Saudi Arabia Xanthates Market Volume (K Tons) Forecast, by Application 2020 & 2033
- Table 71: South Africa Xanthates Market Revenue (Million) Forecast, by Application 2020 & 2033
- Table 72: South Africa Xanthates Market Volume (K Tons) Forecast, by Application 2020 & 2033
- Table 73: Rest of Middle East and Africa Xanthates Market Revenue (Million) Forecast, by Application 2020 & 2033
- Table 74: Rest of Middle East and Africa Xanthates Market Volume (K Tons) Forecast, by Application 2020 & 2033
Frequently Asked Questions
1. What is the projected Compound Annual Growth Rate (CAGR) of the Xanthates Market?
The projected CAGR is approximately 6.8%.
2. Which companies are prominent players in the Xanthates Market?
Key companies in the market include Vanderbilt Chemicals LLC, Yantai Humon Chemical Auxiliary Co Ltd, Tieling Flotation Reagent Co Ltd, Coogee Chemicals, Senmin International (Pty) Ltd, QiXia TongDa Flotation Reagent Co Ltd, CTC Energy & Mining Company, Orica Limited, Amruta Industries, SNF Group.
3. What are the main segments of the Xanthates Market?
The market segments include Product Type, Application.
4. Can you provide details about the market size?
The market size is estimated to be USD 863.6 Million as of 2022.
5. What are some drivers contributing to market growth?
Rising Mining Activities Across the Globe; Widening Use of Xanthates in Rubber Industry.
6. What are the notable trends driving market growth?
Rising Mining Activities Across the Globe.
7. Are there any restraints impacting market growth?
Emergence of Xanthates Replacement Technology; Environmental Regulations Associated with Mining Activities.
8. Can you provide examples of recent developments in the market?
N/A
9. What pricing options are available for accessing the report?
Pricing options include single-user, multi-user, and enterprise licenses priced at USD 4750, USD 5250, and USD 8750 respectively.
10. Is the market size provided in terms of value or volume?
The market size is provided in terms of value, measured in Million and volume, measured in K Tons.
11. Are there any specific market keywords associated with the report?
Yes, the market keyword associated with the report is "Xanthates Market," which aids in identifying and referencing the specific market segment covered.
12. How do I determine which pricing option suits my needs best?
The pricing options vary based on user requirements and access needs. Individual users may opt for single-user licenses, while businesses requiring broader access may choose multi-user or enterprise licenses for cost-effective access to the report.
13. Are there any additional resources or data provided in the Xanthates Market report?
While the report offers comprehensive insights, it's advisable to review the specific contents or supplementary materials provided to ascertain if additional resources or data are available.
14. How can I stay updated on further developments or reports in the Xanthates Market?
To stay informed about further developments, trends, and reports in the Xanthates Market, consider subscribing to industry newsletters, following relevant companies and organizations, or regularly checking reputable industry news sources and publications.
Methodology
Step 1 - Identification of Relevant Samples Size from Population Database


Step 2 - Approaches for Defining Global Market Size (Value, Volume* & Price*)

Note*: In applicable scenarios
Step 3 - Data Sources
Primary Research
- Web Analytics
- Survey Reports
- Research Institute
- Latest Research Reports
- Opinion Leaders
Secondary Research
- Annual Reports
- White Paper
- Latest Press Release
- Industry Association
- Paid Database
- Investor Presentations

Step 4 - Data Triangulation
Involves using different sources of information in order to increase the validity of a study
These sources are likely to be stakeholders in a program - participants, other researchers, program staff, other community members, and so on.
Then we put all data in single framework & apply various statistical tools to find out the dynamic on the market.
During the analysis stage, feedback from the stakeholder groups would be compared to determine areas of agreement as well as areas of divergence