

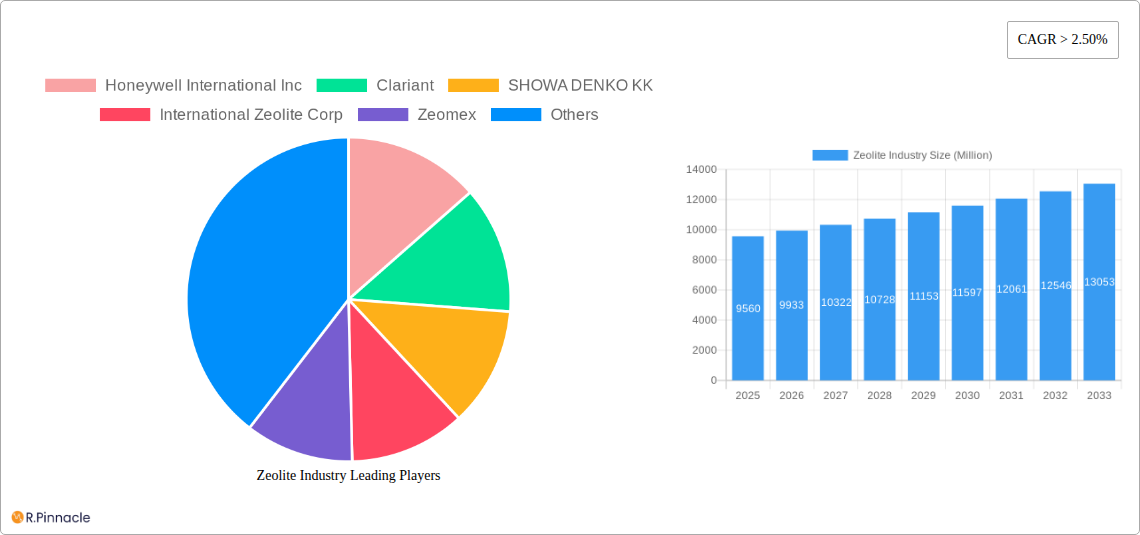
Key Insights
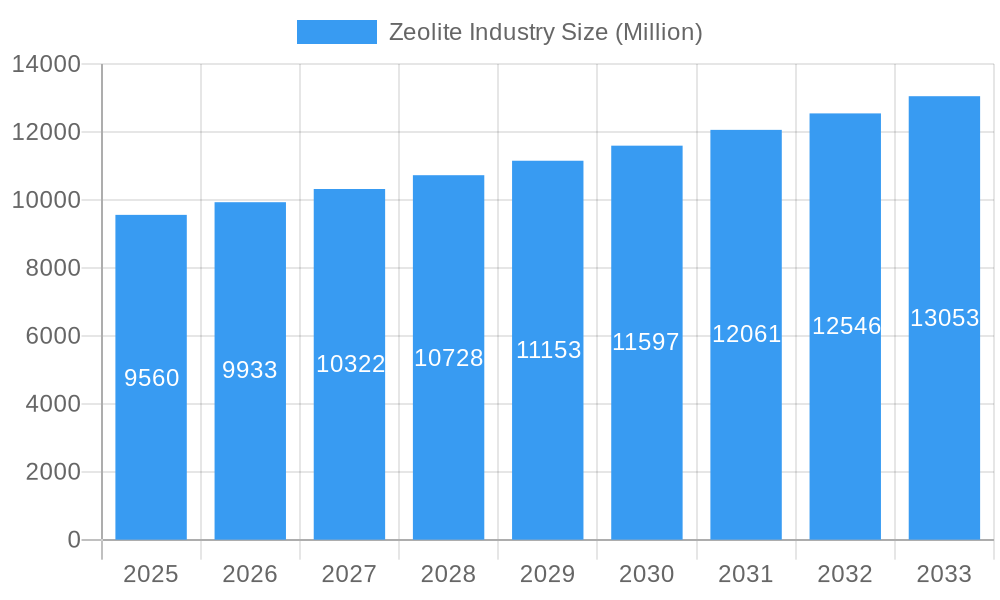
The global zeolite market is poised for robust growth, projected to reach USD 9.56 billion in 2025, driven by an increasing demand for sustainable solutions across various industries. The market is expected to witness a Compound Annual Growth Rate (CAGR) of 3.94% from 2025 to 2033. This expansion is fueled by the versatile applications of zeolites, particularly as highly effective adsorbents and catalysts. In the water treatment sector, zeolites are instrumental in removing impurities and heavy metals, addressing growing concerns about water scarcity and quality. Similarly, their application in air purification systems is on the rise, contributing to improved indoor and outdoor air quality. The agricultural industry leverages zeolites for soil amendment, enhancing nutrient retention and reducing fertilizer runoff. Furthermore, the petrochemical industry utilizes zeolites extensively in refining processes to produce cleaner fuels and valuable chemical intermediates.
Zeolite Industry Market Size (In Billion)
Emerging trends indicate a strong preference for natural zeolites due to their environmental friendliness and cost-effectiveness, although synthetic zeolites continue to hold a significant share due to their tailored properties for specific applications. The market is also witnessing innovation in developing novel zeolite structures and composites to address complex industrial challenges. Key players are focusing on strategic partnerships, mergers, and acquisitions to expand their product portfolios and geographical reach. While growth is promising, challenges such as the high initial cost of some synthetic zeolites and the development of more efficient production methods need to be addressed to unlock the full market potential. The Asia Pacific region is expected to lead the market in terms of growth, owing to rapid industrialization and increasing environmental regulations, followed by North America and Europe.
Zeolite Industry Company Market Share
Zeolite Industry Market: Comprehensive Analysis and Future Outlook (2019-2033)
This in-depth report offers a definitive analysis of the global Zeolite Industry, a rapidly expanding sector driven by increasing demand for sustainable and high-performance materials. Spanning a comprehensive study period from 2019 to 2033, with a base and estimated year of 2025, this report provides granular insights into market dynamics, key players, and future growth trajectories. Leveraging high-ranking keywords such as "zeolite market," "synthetic zeolites," "natural zeolites," "zeolite applications," "catalyst zeolites," "adsorbent zeolites," and "water treatment zeolites," this report is designed for industry professionals seeking actionable intelligence to navigate and capitalize on this evolving market.
The global zeolite market is projected to reach $XX billion by 2033, exhibiting a robust Compound Annual Growth Rate (CAGR) of XX% from the historical period of 2019-2024. This growth is fueled by the intrinsic properties of zeolites, including their high adsorption capacity, ion-exchange capabilities, and catalytic activity, making them indispensable in a wide array of applications.
Zeolite Industry Market Structure & Innovation Trends
The Zeolite Industry market is characterized by a moderate to high degree of concentration, with a few dominant players holding significant market shares. Key innovation drivers include the development of novel synthetic zeolite structures with tailored pore sizes and functionalities, enhancing their performance in specific applications like advanced catalysis and specialized adsorption. Regulatory frameworks, particularly concerning environmental protection and emissions control, are increasingly favoring the adoption of zeolites for their role in pollution abatement and purification processes. Product substitutes exist, such as activated carbon and other molecular sieves, but zeolites often offer superior selectivity and regeneration capabilities. End-user demographics are expanding, with a growing emphasis on sustainable solutions in agriculture, water treatment, and air purification. Merger and acquisition (M&A) activities are observed as companies seek to expand their product portfolios, geographical reach, and technological expertise. For instance, strategic investments and partnerships are common, aiming to accelerate commercialization and market penetration. The M&A deal value in the sector is estimated to be in the billions, reflecting strategic consolidation and growth ambitions.
- Market Concentration: Moderate to high, with key players like Honeywell International Inc., Clariant, and W R Grace & Co. dominating significant portions of the market.
- Innovation Drivers: Development of novel synthetic zeolite structures, enhanced catalytic activity, improved adsorption selectivity, and sustainable production methods.
- Regulatory Frameworks: Increasing stringency in environmental regulations (e.g., emissions standards, water quality mandates) driving demand for zeolite-based solutions.
- Product Substitutes: Activated carbon, silica gel, activated alumina, and other molecular sieves, though zeolites often offer superior performance in specific niches.
- End-User Demographics: Expanding adoption across diverse sectors including petrochemicals, water treatment, air purification, agriculture, and construction.
- M&A Activities: Strategic acquisitions and partnerships to gain market share, access new technologies, and expand product offerings, with estimated deal values reaching billions.
Zeolite Industry Market Dynamics & Trends
The Zeolite Industry market is experiencing dynamic growth propelled by several interconnected factors. A primary growth driver is the escalating global demand for cleaner energy and more efficient industrial processes, where zeolites play a crucial role as catalysts and adsorbents. The petrochemical industry, for instance, heavily relies on zeolites for cracking and isomerization processes, contributing to higher yields of valuable fuels and petrochemical intermediates. Similarly, the burgeoning need for clean water and air worldwide is a significant catalyst for market expansion. Zeolites' exceptional ion-exchange and adsorption properties make them ideal for removing contaminants, heavy metals, and pollutants from water and air. Technological disruptions are also shaping the market, with ongoing research and development focusing on creating advanced synthetic zeolites with enhanced selectivity, capacity, and thermal stability. This includes the development of zeolites for specialized applications like carbon capture, biogas purification, and advanced wastewater treatment. Consumer preferences are shifting towards environmentally friendly and sustainable products, which indirectly bolsters the demand for zeolites as they enable greener manufacturing processes and more efficient resource utilization. The competitive landscape is characterized by intense innovation and strategic collaborations. Companies are investing heavily in R&D to develop proprietary zeolite formulations and manufacturing techniques, aiming to gain a competitive edge. Market penetration is steadily increasing across various end-user industries, with the agriculture sector witnessing significant growth due to the adoption of zeolites as soil conditioners and animal feed additives, improving nutrient uptake and animal health. The construction industry is also exploring zeolites for their insulation properties and as components in sustainable building materials. The overall CAGR of the zeolite market is projected to remain strong, indicating sustained growth in the coming years. The market penetration of zeolites is expected to deepen as awareness of their multifaceted benefits grows across industrial and consumer applications. The continuous pursuit of performance enhancements and cost-effectiveness in zeolite production further fuels market expansion and innovation.
Dominant Regions & Segments in Zeolite Industry
The Zeolite Industry exhibits a clear dominance in specific geographic regions and application segments, driven by a confluence of economic policies, industrial infrastructure, and regulatory landscapes.
Leading Region: North America
- Economic Policies: Robust government support for environmental initiatives, coupled with significant investments in the petrochemical and water treatment sectors, fuels demand.
- Industrial Infrastructure: Well-established petrochemical complexes and advanced manufacturing facilities create a strong base for zeolite consumption.
- Regulatory Landscape: Stringent environmental regulations concerning air and water quality drive the adoption of zeolites for pollution control and purification.
- Market Penetration: High adoption rates in refining, chemical synthesis, and water purification applications.
Dominant Segment: Synthetic Zeolites
- Technological Advancement: Continuous innovation in synthesis methods leads to customized zeolite structures with superior performance for specific applications.
- Application Versatility: Synthetic zeolites offer a wider range of pore sizes, structures, and chemical compositions, making them suitable for high-value applications like catalysts and advanced adsorbents.
- Market Share: Synthetic zeolites command a larger market share due to their tailored properties and high-performance capabilities in critical industrial processes.
Key Application Segments Driving Growth:
- Catalysts:
- Petrochemical Industry: Essential for fluid catalytic cracking (FCC), isomerization, alkylation, and other refining processes, contributing billions in market value.
- Environmental Catalysis: Used in automotive catalytic converters and industrial emission control systems.
- Chemical Synthesis: Facilitating selective reactions and increasing product yields.
- Adsorbents:
- Air Purification: Removal of VOCs, moisture, and other pollutants in industrial and residential settings.
- Water Treatment: Removal of heavy metals, ammonia, and organic contaminants.
- Gas Separation: Used in the production of oxygen and nitrogen from air.
- Other Applications (Refining, Biogas):
- Biogas Purification: Removal of H2S and CO2 to upgrade biogas to biomethane, contributing significantly to the green energy sector.
- Specialty Refining: Used in dewaxing and other purification processes.
Leading End-User Industries:
- Petrochemical: The largest consumer of zeolites for catalytic processes, representing billions in market value.
- Water Treatment: Rapidly growing due to increasing global demand for clean water and stringent regulations.
- Air Purification: Driven by growing awareness of air quality and health concerns.
- Agriculture: Emerging applications in soil amendment, animal feed, and controlled-release fertilizers.
Zeolite Industry Product Innovations
Product innovation in the Zeolite Industry is intensely focused on enhancing performance and expanding application reach. Key developments include the creation of highly selective synthetic zeolites for targeted contaminant removal in water and air purification, significantly improving efficiency and reducing waste. In catalysis, novel zeolite structures are being engineered to boost reaction rates and selectivity in petrochemical processes, leading to higher yields and reduced energy consumption. The agricultural sector is witnessing the integration of zeolites into advanced grow systems, like International Zeolite Corp.'s NEREA, and as components in fertilizers for improved nutrient delivery. These innovations provide competitive advantages through superior functionality, cost-effectiveness, and environmental sustainability, aligning with global trends towards greener technologies.
Report Scope & Segmentation Analysis
This report comprehensively analyzes the Zeolite Industry across its key segments.
- Product Type:
- Natural Zeolites: Market size projected at $XX billion, characterized by cost-effectiveness and applications in agriculture and construction.
- Synthetic Zeolites: Market size projected at $XX billion, driven by high-performance applications in catalysis and adsorption, with robust growth potential.
- Application:
- Adsorbents: Market size projected at $XX billion, with strong demand in air and water purification.
- Catalysts: Market size projected at $XX billion, primarily serving the petrochemical and chemical industries.
- Detergents: Market size projected at $XX billion, a mature but stable segment.
- Other Applications (Refining, Biogas): Market size projected at $XX billion, with significant growth opportunities in biogas purification and specialized refining.
- End-user Industry:
- Water Treatment: Market size projected at $XX billion, a rapidly expanding segment due to global water scarcity and regulatory pressures.
- Air Purification: Market size projected at $XX billion, driven by health consciousness and environmental regulations.
- Agriculture: Market size projected at $XX billion, with growing adoption for soil improvement and animal feed.
- Petrochemical: Market size projected at $XX billion, the largest segment due to extensive use in refining and chemical processes.
- Construction: Market size projected at $XX billion, an emerging segment with potential in sustainable building materials.
- Other Industries: Market size projected at $XX billion, encompassing diverse niche applications.
Key Drivers of Zeolite Industry Growth
The Zeolite Industry's growth is propelled by a combination of powerful drivers.
- Technological Advancements: The development of novel synthetic zeolites with enhanced properties for catalysis and adsorption is a significant driver. For instance, advancements in zeolite synthesis allow for the creation of materials with tailored pore sizes and surface chemistries, leading to improved selectivity and efficiency in chemical reactions and separation processes.
- Environmental Regulations: Increasingly stringent global regulations aimed at reducing pollution and improving air and water quality are a major catalyst. Zeolites are vital in catalytic converters, industrial emission control systems, and water purification technologies, directly benefiting from these policies.
- Growing Demand for Sustainable Solutions: The increasing focus on sustainability across industries is driving the adoption of zeolites. Their role in efficient resource utilization, waste reduction, and the purification of renewable energy sources like biogas underscores their importance in a circular economy.
- Expansion of Petrochemical and Refining Industries: While transitioning towards greener alternatives, these industries remain significant consumers of zeolites for crucial processes like cracking and isomerization, contributing billions to the market.
Challenges in the Zeolite Industry Sector
Despite robust growth, the Zeolite Industry faces several challenges that can impact market expansion.
- High Production Costs of Specialty Zeolites: The synthesis of highly specialized zeolites with unique structures can be energy-intensive and complex, leading to higher production costs compared to commodity materials. This can limit their adoption in price-sensitive applications.
- Competition from Alternative Materials: While zeolites offer distinct advantages, they face competition from other adsorbents like activated carbon and molecular sieves, which may be more cost-effective for certain applications.
- Supply Chain Volatility and Raw Material Availability: The availability and price fluctuations of key raw materials, such as aluminates and silicates, can impact production costs and supply chain stability, potentially affecting market dynamics by billions in unforeseen costs.
- Technical Expertise for Application Development: Optimizing zeolite performance often requires specialized technical knowledge and R&D investment, which can be a barrier for smaller companies or nascent applications.
Emerging Opportunities in Zeolite Industry
The Zeolite Industry is ripe with emerging opportunities driven by innovation and evolving market demands.
- Carbon Capture and Storage (CCS): Zeolites are showing significant promise as highly efficient materials for capturing CO2 from industrial emissions and the atmosphere, presenting a multi-billion dollar opportunity aligned with global climate change mitigation efforts.
- Biogas and Renewable Energy Purification: The increasing demand for biogas upgrading to biomethane for injection into natural gas grids or use as fuel creates a substantial market for zeolites in H2S and CO2 removal.
- Advanced Water and Wastewater Treatment: Development of zeolites for the removal of emerging contaminants like microplastics and pharmaceutical residues offers new avenues for growth in the water treatment sector.
- Smart Agriculture and Controlled-Release Fertilizers: Innovations in agricultural applications, including their use as soil amendments and in slow-release fertilizer systems, are creating new revenue streams and expanding market reach.
Leading Players in the Zeolite Industry Market
- Honeywell International Inc.
- Clariant
- SHOWA DENKO KK
- International Zeolite Corp.
- Zeomex
- Interra Global
- KNT Group
- ZEOCEM AS
- BASF SE
- Arkema Group
- Tosoh Corporation
- W R Grace & Co
- Zeolyst International Inc
Key Developments in Zeolite Industry Industry
- December 2022: International Zeolite Corp. announced an agreement with Niagara College's Horticultural & Environmental Sciences Innovation Centre (HESIC). HESIC will provide priority support for research projects related to IZ's proprietary grow system NEREA, impacting agricultural innovation.
- February 2022: International Zeolite Corp. and CoTec Holdings Corp. announced a USD 2 million strategic investment from CoTec into IZ. This investment is aimed at accelerating IZ's go-to-market activities in the agricultural and green tech segments, bolstering its commercialization capabilities.
Future Outlook for Zeolite Industry Market
The future outlook for the Zeolite Industry is exceptionally bright, projecting sustained growth driven by their indispensable role in sustainable technologies and critical industrial processes. The increasing global focus on environmental remediation, energy efficiency, and resource management will continue to propel demand for zeolites. Innovations in CO2 capture, biogas purification, and advanced water treatment represent significant growth accelerators, opening up multi-billion dollar market opportunities. Furthermore, the ongoing development of novel synthetic zeolites with enhanced performance characteristics will solidify their position as key materials in catalysis and specialized adsorption. Strategic investments in R&D and market expansion by leading players, alongside supportive regulatory frameworks, will further catalyze market growth, ensuring zeolites remain at the forefront of technological advancement and sustainable solutions.
Zeolite Industry Segmentation
-
1. Product Type
- 1.1. Natural
- 1.2. Synthetic
-
2. Application
- 2.1. Adsorbents
- 2.2. Catalysts
- 2.3. Detergents
- 2.4. Other Applications (Refining, Biogas)
-
3. End-user Industry
- 3.1. Water Treatment
- 3.2. Air Purification
- 3.3. Agriculture
- 3.4. Petrochemical
- 3.5. Construction
- 3.6. Other En
Zeolite Industry Segmentation By Geography
-
1. Asia Pacific
- 1.1. China
- 1.2. India
- 1.3. Japan
- 1.4. South Korea
- 1.5. Rest of Asia Pacific
-
2. North America
- 2.1. United States
- 2.2. Canada
- 2.3. Mexico
-
3. Europe
- 3.1. Germany
- 3.2. United Kingdom
- 3.3. Italy
- 3.4. France
- 3.5. Rest of Europe
-
4. South America
- 4.1. Brazil
- 4.2. Argentina
- 4.3. Rest of South America
- 5. Middle East
-
6. Saudi Arabia
- 6.1. South Africa
- 6.2. Rest of Middle East
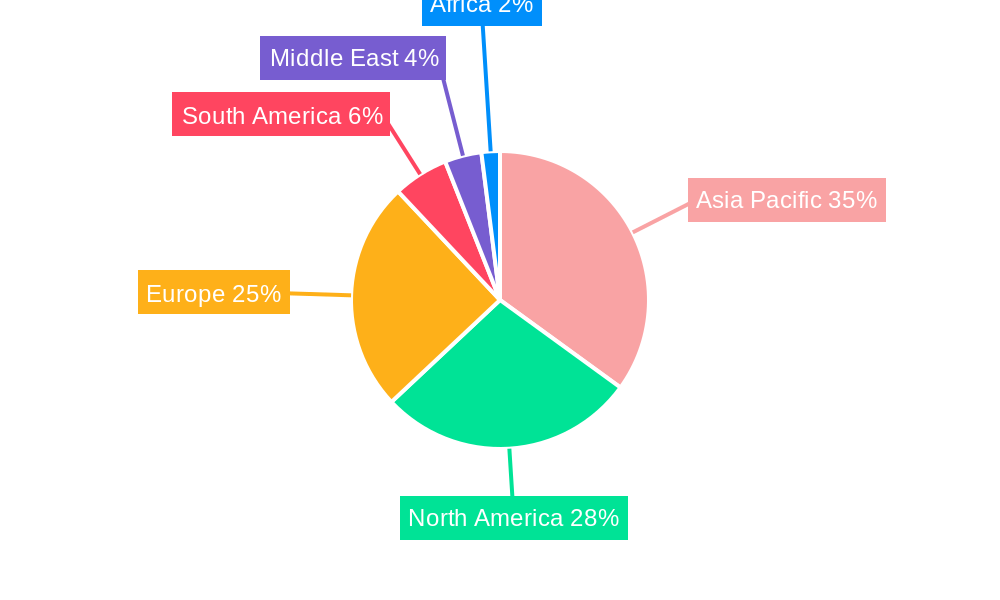
Zeolite Industry Regional Market Share
Geographic Coverage of Zeolite Industry
Zeolite Industry REPORT HIGHLIGHTS
| Aspects | Details |
|---|---|
| Study Period | 2020-2034 |
| Base Year | 2025 |
| Estimated Year | 2026 |
| Forecast Period | 2026-2034 |
| Historical Period | 2020-2025 |
| Growth Rate | CAGR of 9.3% from 2020-2034 |
| Segmentation |
|
Table of Contents
- 1. Introduction
- 1.1. Research Scope
- 1.2. Market Segmentation
- 1.3. Research Objective
- 1.4. Definitions and Assumptions
- 2. Executive Summary
- 2.1. Market Snapshot
- 3. Market Dynamics
- 3.1. Market Drivers
- 3.2. Market Restrains
- 3.3. Market Trends
- 3.4. Market Opportunities
- 4. Market Factor Analysis
- 4.1. Porters Five Forces
- 4.1.1. Bargaining Power of Suppliers
- 4.1.2. Bargaining Power of Buyers
- 4.1.3. Threat of New Entrants
- 4.1.4. Threat of Substitutes
- 4.1.5. Competitive Rivalry
- 4.2. PESTEL analysis
- 4.3. BCG Analysis
- 4.3.1. Stars (High Growth, High Market Share)
- 4.3.2. Cash Cows (Low Growth, High Market Share)
- 4.3.3. Question Mark (High Growth, Low Market Share)
- 4.3.4. Dogs (Low Growth, Low Market Share)
- 4.4. Ansoff Matrix Analysis
- 4.5. Supply Chain Analysis
- 4.6. Regulatory Landscape
- 4.7. Current Market Potential and Opportunity Assessment (TAM–SAM–SOM Framework)
- 4.8. PRI Analyst Note
- 4.1. Porters Five Forces
- 5. Market Analysis, Insights and Forecast 2021-2033
- 5.1. Market Analysis, Insights and Forecast - by Product Type
- 5.1.1. Natural
- 5.1.2. Synthetic
- 5.2. Market Analysis, Insights and Forecast - by Application
- 5.2.1. Adsorbents
- 5.2.2. Catalysts
- 5.2.3. Detergents
- 5.2.4. Other Applications (Refining, Biogas)
- 5.3. Market Analysis, Insights and Forecast - by End-user Industry
- 5.3.1. Water Treatment
- 5.3.2. Air Purification
- 5.3.3. Agriculture
- 5.3.4. Petrochemical
- 5.3.5. Construction
- 5.3.6. Other En
- 5.4. Market Analysis, Insights and Forecast - by Region
- 5.4.1. Asia Pacific
- 5.4.2. North America
- 5.4.3. Europe
- 5.4.4. South America
- 5.4.5. Middle East
- 5.4.6. Saudi Arabia
- 5.1. Market Analysis, Insights and Forecast - by Product Type
- 6. Global Zeolite Industry Analysis, Insights and Forecast, 2021-2033
- 6.1. Market Analysis, Insights and Forecast - by Product Type
- 6.1.1. Natural
- 6.1.2. Synthetic
- 6.2. Market Analysis, Insights and Forecast - by Application
- 6.2.1. Adsorbents
- 6.2.2. Catalysts
- 6.2.3. Detergents
- 6.2.4. Other Applications (Refining, Biogas)
- 6.3. Market Analysis, Insights and Forecast - by End-user Industry
- 6.3.1. Water Treatment
- 6.3.2. Air Purification
- 6.3.3. Agriculture
- 6.3.4. Petrochemical
- 6.3.5. Construction
- 6.3.6. Other En
- 6.1. Market Analysis, Insights and Forecast - by Product Type
- 7. Asia Pacific Zeolite Industry Analysis, Insights and Forecast, 2020-2032
- 7.1. Market Analysis, Insights and Forecast - by Product Type
- 7.1.1. Natural
- 7.1.2. Synthetic
- 7.2. Market Analysis, Insights and Forecast - by Application
- 7.2.1. Adsorbents
- 7.2.2. Catalysts
- 7.2.3. Detergents
- 7.2.4. Other Applications (Refining, Biogas)
- 7.3. Market Analysis, Insights and Forecast - by End-user Industry
- 7.3.1. Water Treatment
- 7.3.2. Air Purification
- 7.3.3. Agriculture
- 7.3.4. Petrochemical
- 7.3.5. Construction
- 7.3.6. Other En
- 7.1. Market Analysis, Insights and Forecast - by Product Type
- 8. North America Zeolite Industry Analysis, Insights and Forecast, 2020-2032
- 8.1. Market Analysis, Insights and Forecast - by Product Type
- 8.1.1. Natural
- 8.1.2. Synthetic
- 8.2. Market Analysis, Insights and Forecast - by Application
- 8.2.1. Adsorbents
- 8.2.2. Catalysts
- 8.2.3. Detergents
- 8.2.4. Other Applications (Refining, Biogas)
- 8.3. Market Analysis, Insights and Forecast - by End-user Industry
- 8.3.1. Water Treatment
- 8.3.2. Air Purification
- 8.3.3. Agriculture
- 8.3.4. Petrochemical
- 8.3.5. Construction
- 8.3.6. Other En
- 8.1. Market Analysis, Insights and Forecast - by Product Type
- 9. Europe Zeolite Industry Analysis, Insights and Forecast, 2020-2032
- 9.1. Market Analysis, Insights and Forecast - by Product Type
- 9.1.1. Natural
- 9.1.2. Synthetic
- 9.2. Market Analysis, Insights and Forecast - by Application
- 9.2.1. Adsorbents
- 9.2.2. Catalysts
- 9.2.3. Detergents
- 9.2.4. Other Applications (Refining, Biogas)
- 9.3. Market Analysis, Insights and Forecast - by End-user Industry
- 9.3.1. Water Treatment
- 9.3.2. Air Purification
- 9.3.3. Agriculture
- 9.3.4. Petrochemical
- 9.3.5. Construction
- 9.3.6. Other En
- 9.1. Market Analysis, Insights and Forecast - by Product Type
- 10. South America Zeolite Industry Analysis, Insights and Forecast, 2020-2032
- 10.1. Market Analysis, Insights and Forecast - by Product Type
- 10.1.1. Natural
- 10.1.2. Synthetic
- 10.2. Market Analysis, Insights and Forecast - by Application
- 10.2.1. Adsorbents
- 10.2.2. Catalysts
- 10.2.3. Detergents
- 10.2.4. Other Applications (Refining, Biogas)
- 10.3. Market Analysis, Insights and Forecast - by End-user Industry
- 10.3.1. Water Treatment
- 10.3.2. Air Purification
- 10.3.3. Agriculture
- 10.3.4. Petrochemical
- 10.3.5. Construction
- 10.3.6. Other En
- 10.1. Market Analysis, Insights and Forecast - by Product Type
- 11. Middle East Zeolite Industry Analysis, Insights and Forecast, 2020-2032
- 11.1. Market Analysis, Insights and Forecast - by Product Type
- 11.1.1. Natural
- 11.1.2. Synthetic
- 11.2. Market Analysis, Insights and Forecast - by Application
- 11.2.1. Adsorbents
- 11.2.2. Catalysts
- 11.2.3. Detergents
- 11.2.4. Other Applications (Refining, Biogas)
- 11.3. Market Analysis, Insights and Forecast - by End-user Industry
- 11.3.1. Water Treatment
- 11.3.2. Air Purification
- 11.3.3. Agriculture
- 11.3.4. Petrochemical
- 11.3.5. Construction
- 11.3.6. Other En
- 11.1. Market Analysis, Insights and Forecast - by Product Type
- 12. Saudi Arabia Zeolite Industry Analysis, Insights and Forecast, 2020-2032
- 12.1. Market Analysis, Insights and Forecast - by Product Type
- 12.1.1. Natural
- 12.1.2. Synthetic
- 12.2. Market Analysis, Insights and Forecast - by Application
- 12.2.1. Adsorbents
- 12.2.2. Catalysts
- 12.2.3. Detergents
- 12.2.4. Other Applications (Refining, Biogas)
- 12.3. Market Analysis, Insights and Forecast - by End-user Industry
- 12.3.1. Water Treatment
- 12.3.2. Air Purification
- 12.3.3. Agriculture
- 12.3.4. Petrochemical
- 12.3.5. Construction
- 12.3.6. Other En
- 12.1. Market Analysis, Insights and Forecast - by Product Type
- 13. Competitive Analysis
- 13.1. Company Profiles
- 13.1.1 Honeywell International Inc
- 13.1.1.1. Company Overview
- 13.1.1.2. Products
- 13.1.1.3. Company Financials
- 13.1.1.4. SWOT Analysis
- 13.1.2 Clariant
- 13.1.2.1. Company Overview
- 13.1.2.2. Products
- 13.1.2.3. Company Financials
- 13.1.2.4. SWOT Analysis
- 13.1.3 SHOWA DENKO KK
- 13.1.3.1. Company Overview
- 13.1.3.2. Products
- 13.1.3.3. Company Financials
- 13.1.3.4. SWOT Analysis
- 13.1.4 International Zeolite Corp
- 13.1.4.1. Company Overview
- 13.1.4.2. Products
- 13.1.4.3. Company Financials
- 13.1.4.4. SWOT Analysis
- 13.1.5 Zeomex
- 13.1.5.1. Company Overview
- 13.1.5.2. Products
- 13.1.5.3. Company Financials
- 13.1.5.4. SWOT Analysis
- 13.1.6 Interra Global
- 13.1.6.1. Company Overview
- 13.1.6.2. Products
- 13.1.6.3. Company Financials
- 13.1.6.4. SWOT Analysis
- 13.1.7 KNT Group
- 13.1.7.1. Company Overview
- 13.1.7.2. Products
- 13.1.7.3. Company Financials
- 13.1.7.4. SWOT Analysis
- 13.1.8 ZEOCEM AS
- 13.1.8.1. Company Overview
- 13.1.8.2. Products
- 13.1.8.3. Company Financials
- 13.1.8.4. SWOT Analysis
- 13.1.9 BASF SE
- 13.1.9.1. Company Overview
- 13.1.9.2. Products
- 13.1.9.3. Company Financials
- 13.1.9.4. SWOT Analysis
- 13.1.10 Arkema Group
- 13.1.10.1. Company Overview
- 13.1.10.2. Products
- 13.1.10.3. Company Financials
- 13.1.10.4. SWOT Analysis
- 13.1.11 Tosoh Corporation
- 13.1.11.1. Company Overview
- 13.1.11.2. Products
- 13.1.11.3. Company Financials
- 13.1.11.4. SWOT Analysis
- 13.1.12 W R Grace & Co
- 13.1.12.1. Company Overview
- 13.1.12.2. Products
- 13.1.12.3. Company Financials
- 13.1.12.4. SWOT Analysis
- 13.1.13 Zeolyst International Inc
- 13.1.13.1. Company Overview
- 13.1.13.2. Products
- 13.1.13.3. Company Financials
- 13.1.13.4. SWOT Analysis
- 13.1.1 Honeywell International Inc
- 13.2. Market Entropy
- 13.2.1 Company's Key Areas Served
- 13.2.2 Recent Developments
- 13.3. Company Market Share Analysis 2025
- 13.3.1 Top 5 Companies Market Share Analysis
- 13.3.2 Top 3 Companies Market Share Analysis
- 13.4. List of Potential Customers
- 14. Research Methodology
List of Figures
- Figure 1: Global Zeolite Industry Revenue Breakdown (million, %) by Region 2025 & 2033
- Figure 2: Global Zeolite Industry Volume Breakdown (K Tons, %) by Region 2025 & 2033
- Figure 3: Asia Pacific Zeolite Industry Revenue (million), by Product Type 2025 & 2033
- Figure 4: Asia Pacific Zeolite Industry Volume (K Tons), by Product Type 2025 & 2033
- Figure 5: Asia Pacific Zeolite Industry Revenue Share (%), by Product Type 2025 & 2033
- Figure 6: Asia Pacific Zeolite Industry Volume Share (%), by Product Type 2025 & 2033
- Figure 7: Asia Pacific Zeolite Industry Revenue (million), by Application 2025 & 2033
- Figure 8: Asia Pacific Zeolite Industry Volume (K Tons), by Application 2025 & 2033
- Figure 9: Asia Pacific Zeolite Industry Revenue Share (%), by Application 2025 & 2033
- Figure 10: Asia Pacific Zeolite Industry Volume Share (%), by Application 2025 & 2033
- Figure 11: Asia Pacific Zeolite Industry Revenue (million), by End-user Industry 2025 & 2033
- Figure 12: Asia Pacific Zeolite Industry Volume (K Tons), by End-user Industry 2025 & 2033
- Figure 13: Asia Pacific Zeolite Industry Revenue Share (%), by End-user Industry 2025 & 2033
- Figure 14: Asia Pacific Zeolite Industry Volume Share (%), by End-user Industry 2025 & 2033
- Figure 15: Asia Pacific Zeolite Industry Revenue (million), by Country 2025 & 2033
- Figure 16: Asia Pacific Zeolite Industry Volume (K Tons), by Country 2025 & 2033
- Figure 17: Asia Pacific Zeolite Industry Revenue Share (%), by Country 2025 & 2033
- Figure 18: Asia Pacific Zeolite Industry Volume Share (%), by Country 2025 & 2033
- Figure 19: North America Zeolite Industry Revenue (million), by Product Type 2025 & 2033
- Figure 20: North America Zeolite Industry Volume (K Tons), by Product Type 2025 & 2033
- Figure 21: North America Zeolite Industry Revenue Share (%), by Product Type 2025 & 2033
- Figure 22: North America Zeolite Industry Volume Share (%), by Product Type 2025 & 2033
- Figure 23: North America Zeolite Industry Revenue (million), by Application 2025 & 2033
- Figure 24: North America Zeolite Industry Volume (K Tons), by Application 2025 & 2033
- Figure 25: North America Zeolite Industry Revenue Share (%), by Application 2025 & 2033
- Figure 26: North America Zeolite Industry Volume Share (%), by Application 2025 & 2033
- Figure 27: North America Zeolite Industry Revenue (million), by End-user Industry 2025 & 2033
- Figure 28: North America Zeolite Industry Volume (K Tons), by End-user Industry 2025 & 2033
- Figure 29: North America Zeolite Industry Revenue Share (%), by End-user Industry 2025 & 2033
- Figure 30: North America Zeolite Industry Volume Share (%), by End-user Industry 2025 & 2033
- Figure 31: North America Zeolite Industry Revenue (million), by Country 2025 & 2033
- Figure 32: North America Zeolite Industry Volume (K Tons), by Country 2025 & 2033
- Figure 33: North America Zeolite Industry Revenue Share (%), by Country 2025 & 2033
- Figure 34: North America Zeolite Industry Volume Share (%), by Country 2025 & 2033
- Figure 35: Europe Zeolite Industry Revenue (million), by Product Type 2025 & 2033
- Figure 36: Europe Zeolite Industry Volume (K Tons), by Product Type 2025 & 2033
- Figure 37: Europe Zeolite Industry Revenue Share (%), by Product Type 2025 & 2033
- Figure 38: Europe Zeolite Industry Volume Share (%), by Product Type 2025 & 2033
- Figure 39: Europe Zeolite Industry Revenue (million), by Application 2025 & 2033
- Figure 40: Europe Zeolite Industry Volume (K Tons), by Application 2025 & 2033
- Figure 41: Europe Zeolite Industry Revenue Share (%), by Application 2025 & 2033
- Figure 42: Europe Zeolite Industry Volume Share (%), by Application 2025 & 2033
- Figure 43: Europe Zeolite Industry Revenue (million), by End-user Industry 2025 & 2033
- Figure 44: Europe Zeolite Industry Volume (K Tons), by End-user Industry 2025 & 2033
- Figure 45: Europe Zeolite Industry Revenue Share (%), by End-user Industry 2025 & 2033
- Figure 46: Europe Zeolite Industry Volume Share (%), by End-user Industry 2025 & 2033
- Figure 47: Europe Zeolite Industry Revenue (million), by Country 2025 & 2033
- Figure 48: Europe Zeolite Industry Volume (K Tons), by Country 2025 & 2033
- Figure 49: Europe Zeolite Industry Revenue Share (%), by Country 2025 & 2033
- Figure 50: Europe Zeolite Industry Volume Share (%), by Country 2025 & 2033
- Figure 51: South America Zeolite Industry Revenue (million), by Product Type 2025 & 2033
- Figure 52: South America Zeolite Industry Volume (K Tons), by Product Type 2025 & 2033
- Figure 53: South America Zeolite Industry Revenue Share (%), by Product Type 2025 & 2033
- Figure 54: South America Zeolite Industry Volume Share (%), by Product Type 2025 & 2033
- Figure 55: South America Zeolite Industry Revenue (million), by Application 2025 & 2033
- Figure 56: South America Zeolite Industry Volume (K Tons), by Application 2025 & 2033
- Figure 57: South America Zeolite Industry Revenue Share (%), by Application 2025 & 2033
- Figure 58: South America Zeolite Industry Volume Share (%), by Application 2025 & 2033
- Figure 59: South America Zeolite Industry Revenue (million), by End-user Industry 2025 & 2033
- Figure 60: South America Zeolite Industry Volume (K Tons), by End-user Industry 2025 & 2033
- Figure 61: South America Zeolite Industry Revenue Share (%), by End-user Industry 2025 & 2033
- Figure 62: South America Zeolite Industry Volume Share (%), by End-user Industry 2025 & 2033
- Figure 63: South America Zeolite Industry Revenue (million), by Country 2025 & 2033
- Figure 64: South America Zeolite Industry Volume (K Tons), by Country 2025 & 2033
- Figure 65: South America Zeolite Industry Revenue Share (%), by Country 2025 & 2033
- Figure 66: South America Zeolite Industry Volume Share (%), by Country 2025 & 2033
- Figure 67: Middle East Zeolite Industry Revenue (million), by Product Type 2025 & 2033
- Figure 68: Middle East Zeolite Industry Volume (K Tons), by Product Type 2025 & 2033
- Figure 69: Middle East Zeolite Industry Revenue Share (%), by Product Type 2025 & 2033
- Figure 70: Middle East Zeolite Industry Volume Share (%), by Product Type 2025 & 2033
- Figure 71: Middle East Zeolite Industry Revenue (million), by Application 2025 & 2033
- Figure 72: Middle East Zeolite Industry Volume (K Tons), by Application 2025 & 2033
- Figure 73: Middle East Zeolite Industry Revenue Share (%), by Application 2025 & 2033
- Figure 74: Middle East Zeolite Industry Volume Share (%), by Application 2025 & 2033
- Figure 75: Middle East Zeolite Industry Revenue (million), by End-user Industry 2025 & 2033
- Figure 76: Middle East Zeolite Industry Volume (K Tons), by End-user Industry 2025 & 2033
- Figure 77: Middle East Zeolite Industry Revenue Share (%), by End-user Industry 2025 & 2033
- Figure 78: Middle East Zeolite Industry Volume Share (%), by End-user Industry 2025 & 2033
- Figure 79: Middle East Zeolite Industry Revenue (million), by Country 2025 & 2033
- Figure 80: Middle East Zeolite Industry Volume (K Tons), by Country 2025 & 2033
- Figure 81: Middle East Zeolite Industry Revenue Share (%), by Country 2025 & 2033
- Figure 82: Middle East Zeolite Industry Volume Share (%), by Country 2025 & 2033
- Figure 83: Saudi Arabia Zeolite Industry Revenue (million), by Product Type 2025 & 2033
- Figure 84: Saudi Arabia Zeolite Industry Volume (K Tons), by Product Type 2025 & 2033
- Figure 85: Saudi Arabia Zeolite Industry Revenue Share (%), by Product Type 2025 & 2033
- Figure 86: Saudi Arabia Zeolite Industry Volume Share (%), by Product Type 2025 & 2033
- Figure 87: Saudi Arabia Zeolite Industry Revenue (million), by Application 2025 & 2033
- Figure 88: Saudi Arabia Zeolite Industry Volume (K Tons), by Application 2025 & 2033
- Figure 89: Saudi Arabia Zeolite Industry Revenue Share (%), by Application 2025 & 2033
- Figure 90: Saudi Arabia Zeolite Industry Volume Share (%), by Application 2025 & 2033
- Figure 91: Saudi Arabia Zeolite Industry Revenue (million), by End-user Industry 2025 & 2033
- Figure 92: Saudi Arabia Zeolite Industry Volume (K Tons), by End-user Industry 2025 & 2033
- Figure 93: Saudi Arabia Zeolite Industry Revenue Share (%), by End-user Industry 2025 & 2033
- Figure 94: Saudi Arabia Zeolite Industry Volume Share (%), by End-user Industry 2025 & 2033
- Figure 95: Saudi Arabia Zeolite Industry Revenue (million), by Country 2025 & 2033
- Figure 96: Saudi Arabia Zeolite Industry Volume (K Tons), by Country 2025 & 2033
- Figure 97: Saudi Arabia Zeolite Industry Revenue Share (%), by Country 2025 & 2033
- Figure 98: Saudi Arabia Zeolite Industry Volume Share (%), by Country 2025 & 2033
List of Tables
- Table 1: Global Zeolite Industry Revenue million Forecast, by Product Type 2020 & 2033
- Table 2: Global Zeolite Industry Volume K Tons Forecast, by Product Type 2020 & 2033
- Table 3: Global Zeolite Industry Revenue million Forecast, by Application 2020 & 2033
- Table 4: Global Zeolite Industry Volume K Tons Forecast, by Application 2020 & 2033
- Table 5: Global Zeolite Industry Revenue million Forecast, by End-user Industry 2020 & 2033
- Table 6: Global Zeolite Industry Volume K Tons Forecast, by End-user Industry 2020 & 2033
- Table 7: Global Zeolite Industry Revenue million Forecast, by Region 2020 & 2033
- Table 8: Global Zeolite Industry Volume K Tons Forecast, by Region 2020 & 2033
- Table 9: Global Zeolite Industry Revenue million Forecast, by Product Type 2020 & 2033
- Table 10: Global Zeolite Industry Volume K Tons Forecast, by Product Type 2020 & 2033
- Table 11: Global Zeolite Industry Revenue million Forecast, by Application 2020 & 2033
- Table 12: Global Zeolite Industry Volume K Tons Forecast, by Application 2020 & 2033
- Table 13: Global Zeolite Industry Revenue million Forecast, by End-user Industry 2020 & 2033
- Table 14: Global Zeolite Industry Volume K Tons Forecast, by End-user Industry 2020 & 2033
- Table 15: Global Zeolite Industry Revenue million Forecast, by Country 2020 & 2033
- Table 16: Global Zeolite Industry Volume K Tons Forecast, by Country 2020 & 2033
- Table 17: China Zeolite Industry Revenue (million) Forecast, by Application 2020 & 2033
- Table 18: China Zeolite Industry Volume (K Tons) Forecast, by Application 2020 & 2033
- Table 19: India Zeolite Industry Revenue (million) Forecast, by Application 2020 & 2033
- Table 20: India Zeolite Industry Volume (K Tons) Forecast, by Application 2020 & 2033
- Table 21: Japan Zeolite Industry Revenue (million) Forecast, by Application 2020 & 2033
- Table 22: Japan Zeolite Industry Volume (K Tons) Forecast, by Application 2020 & 2033
- Table 23: South Korea Zeolite Industry Revenue (million) Forecast, by Application 2020 & 2033
- Table 24: South Korea Zeolite Industry Volume (K Tons) Forecast, by Application 2020 & 2033
- Table 25: Rest of Asia Pacific Zeolite Industry Revenue (million) Forecast, by Application 2020 & 2033
- Table 26: Rest of Asia Pacific Zeolite Industry Volume (K Tons) Forecast, by Application 2020 & 2033
- Table 27: Global Zeolite Industry Revenue million Forecast, by Product Type 2020 & 2033
- Table 28: Global Zeolite Industry Volume K Tons Forecast, by Product Type 2020 & 2033
- Table 29: Global Zeolite Industry Revenue million Forecast, by Application 2020 & 2033
- Table 30: Global Zeolite Industry Volume K Tons Forecast, by Application 2020 & 2033
- Table 31: Global Zeolite Industry Revenue million Forecast, by End-user Industry 2020 & 2033
- Table 32: Global Zeolite Industry Volume K Tons Forecast, by End-user Industry 2020 & 2033
- Table 33: Global Zeolite Industry Revenue million Forecast, by Country 2020 & 2033
- Table 34: Global Zeolite Industry Volume K Tons Forecast, by Country 2020 & 2033
- Table 35: United States Zeolite Industry Revenue (million) Forecast, by Application 2020 & 2033
- Table 36: United States Zeolite Industry Volume (K Tons) Forecast, by Application 2020 & 2033
- Table 37: Canada Zeolite Industry Revenue (million) Forecast, by Application 2020 & 2033
- Table 38: Canada Zeolite Industry Volume (K Tons) Forecast, by Application 2020 & 2033
- Table 39: Mexico Zeolite Industry Revenue (million) Forecast, by Application 2020 & 2033
- Table 40: Mexico Zeolite Industry Volume (K Tons) Forecast, by Application 2020 & 2033
- Table 41: Global Zeolite Industry Revenue million Forecast, by Product Type 2020 & 2033
- Table 42: Global Zeolite Industry Volume K Tons Forecast, by Product Type 2020 & 2033
- Table 43: Global Zeolite Industry Revenue million Forecast, by Application 2020 & 2033
- Table 44: Global Zeolite Industry Volume K Tons Forecast, by Application 2020 & 2033
- Table 45: Global Zeolite Industry Revenue million Forecast, by End-user Industry 2020 & 2033
- Table 46: Global Zeolite Industry Volume K Tons Forecast, by End-user Industry 2020 & 2033
- Table 47: Global Zeolite Industry Revenue million Forecast, by Country 2020 & 2033
- Table 48: Global Zeolite Industry Volume K Tons Forecast, by Country 2020 & 2033
- Table 49: Germany Zeolite Industry Revenue (million) Forecast, by Application 2020 & 2033
- Table 50: Germany Zeolite Industry Volume (K Tons) Forecast, by Application 2020 & 2033
- Table 51: United Kingdom Zeolite Industry Revenue (million) Forecast, by Application 2020 & 2033
- Table 52: United Kingdom Zeolite Industry Volume (K Tons) Forecast, by Application 2020 & 2033
- Table 53: Italy Zeolite Industry Revenue (million) Forecast, by Application 2020 & 2033
- Table 54: Italy Zeolite Industry Volume (K Tons) Forecast, by Application 2020 & 2033
- Table 55: France Zeolite Industry Revenue (million) Forecast, by Application 2020 & 2033
- Table 56: France Zeolite Industry Volume (K Tons) Forecast, by Application 2020 & 2033
- Table 57: Rest of Europe Zeolite Industry Revenue (million) Forecast, by Application 2020 & 2033
- Table 58: Rest of Europe Zeolite Industry Volume (K Tons) Forecast, by Application 2020 & 2033
- Table 59: Global Zeolite Industry Revenue million Forecast, by Product Type 2020 & 2033
- Table 60: Global Zeolite Industry Volume K Tons Forecast, by Product Type 2020 & 2033
- Table 61: Global Zeolite Industry Revenue million Forecast, by Application 2020 & 2033
- Table 62: Global Zeolite Industry Volume K Tons Forecast, by Application 2020 & 2033
- Table 63: Global Zeolite Industry Revenue million Forecast, by End-user Industry 2020 & 2033
- Table 64: Global Zeolite Industry Volume K Tons Forecast, by End-user Industry 2020 & 2033
- Table 65: Global Zeolite Industry Revenue million Forecast, by Country 2020 & 2033
- Table 66: Global Zeolite Industry Volume K Tons Forecast, by Country 2020 & 2033
- Table 67: Brazil Zeolite Industry Revenue (million) Forecast, by Application 2020 & 2033
- Table 68: Brazil Zeolite Industry Volume (K Tons) Forecast, by Application 2020 & 2033
- Table 69: Argentina Zeolite Industry Revenue (million) Forecast, by Application 2020 & 2033
- Table 70: Argentina Zeolite Industry Volume (K Tons) Forecast, by Application 2020 & 2033
- Table 71: Rest of South America Zeolite Industry Revenue (million) Forecast, by Application 2020 & 2033
- Table 72: Rest of South America Zeolite Industry Volume (K Tons) Forecast, by Application 2020 & 2033
- Table 73: Global Zeolite Industry Revenue million Forecast, by Product Type 2020 & 2033
- Table 74: Global Zeolite Industry Volume K Tons Forecast, by Product Type 2020 & 2033
- Table 75: Global Zeolite Industry Revenue million Forecast, by Application 2020 & 2033
- Table 76: Global Zeolite Industry Volume K Tons Forecast, by Application 2020 & 2033
- Table 77: Global Zeolite Industry Revenue million Forecast, by End-user Industry 2020 & 2033
- Table 78: Global Zeolite Industry Volume K Tons Forecast, by End-user Industry 2020 & 2033
- Table 79: Global Zeolite Industry Revenue million Forecast, by Country 2020 & 2033
- Table 80: Global Zeolite Industry Volume K Tons Forecast, by Country 2020 & 2033
- Table 81: Global Zeolite Industry Revenue million Forecast, by Product Type 2020 & 2033
- Table 82: Global Zeolite Industry Volume K Tons Forecast, by Product Type 2020 & 2033
- Table 83: Global Zeolite Industry Revenue million Forecast, by Application 2020 & 2033
- Table 84: Global Zeolite Industry Volume K Tons Forecast, by Application 2020 & 2033
- Table 85: Global Zeolite Industry Revenue million Forecast, by End-user Industry 2020 & 2033
- Table 86: Global Zeolite Industry Volume K Tons Forecast, by End-user Industry 2020 & 2033
- Table 87: Global Zeolite Industry Revenue million Forecast, by Country 2020 & 2033
- Table 88: Global Zeolite Industry Volume K Tons Forecast, by Country 2020 & 2033
- Table 89: South Africa Zeolite Industry Revenue (million) Forecast, by Application 2020 & 2033
- Table 90: South Africa Zeolite Industry Volume (K Tons) Forecast, by Application 2020 & 2033
- Table 91: Rest of Middle East Zeolite Industry Revenue (million) Forecast, by Application 2020 & 2033
- Table 92: Rest of Middle East Zeolite Industry Volume (K Tons) Forecast, by Application 2020 & 2033
Frequently Asked Questions
1. What is the projected Compound Annual Growth Rate (CAGR) of the Zeolite Industry?
The projected CAGR is approximately 9.3%.
2. Which companies are prominent players in the Zeolite Industry?
Key companies in the market include Honeywell International Inc, Clariant, SHOWA DENKO KK, International Zeolite Corp, Zeomex, Interra Global, KNT Group, ZEOCEM AS, BASF SE, Arkema Group, Tosoh Corporation, W R Grace & Co, Zeolyst International Inc.
3. What are the main segments of the Zeolite Industry?
The market segments include Product Type, Application, End-user Industry.
4. Can you provide details about the market size?
The market size is estimated to be USD 34471.87 million as of 2022.
5. What are some drivers contributing to market growth?
Increasing Demand from Water Treatment Industry; Increasing Use of Zeolite as Refrigeration Adsorbents; Significant Usage of Zeolites for Catalytic Cracking in the Petroleum Industry.
6. What are the notable trends driving market growth?
Agriculture Industry to Dominate the Market.
7. Are there any restraints impacting market growth?
Usage of Substitutes for Zeolites.
8. Can you provide examples of recent developments in the market?
December 2022: International Zeolite Corp. is pleased to announce an agreement between Niagara College's Horticultural & Environmental Sciences Innovation Centre (HESIC). Under the terms of the agreement, Niagara College will provide priority and support for research projects in relationship to IZ's proprietary grow system NEREA, which HESIC will carry out.
9. What pricing options are available for accessing the report?
Pricing options include single-user, multi-user, and enterprise licenses priced at USD 4750, USD 5250, and USD 8750 respectively.
10. Is the market size provided in terms of value or volume?
The market size is provided in terms of value, measured in million and volume, measured in K Tons.
11. Are there any specific market keywords associated with the report?
Yes, the market keyword associated with the report is "Zeolite Industry," which aids in identifying and referencing the specific market segment covered.
12. How do I determine which pricing option suits my needs best?
The pricing options vary based on user requirements and access needs. Individual users may opt for single-user licenses, while businesses requiring broader access may choose multi-user or enterprise licenses for cost-effective access to the report.
13. Are there any additional resources or data provided in the Zeolite Industry report?
While the report offers comprehensive insights, it's advisable to review the specific contents or supplementary materials provided to ascertain if additional resources or data are available.
14. How can I stay updated on further developments or reports in the Zeolite Industry?
To stay informed about further developments, trends, and reports in the Zeolite Industry, consider subscribing to industry newsletters, following relevant companies and organizations, or regularly checking reputable industry news sources and publications.
Methodology
Step 1 - Identification of Relevant Samples Size from Population Database


Step 2 - Approaches for Defining Global Market Size (Value, Volume* & Price*)

Note*: In applicable scenarios
Step 3 - Data Sources
Primary Research
- Web Analytics
- Survey Reports
- Research Institute
- Latest Research Reports
- Opinion Leaders
Secondary Research
- Annual Reports
- White Paper
- Latest Press Release
- Industry Association
- Paid Database
- Investor Presentations

Step 4 - Data Triangulation
Involves using different sources of information in order to increase the validity of a study
These sources are likely to be stakeholders in a program - participants, other researchers, program staff, other community members, and so on.
Then we put all data in single framework & apply various statistical tools to find out the dynamic on the market.
During the analysis stage, feedback from the stakeholder groups would be compared to determine areas of agreement as well as areas of divergence