

Key Insights
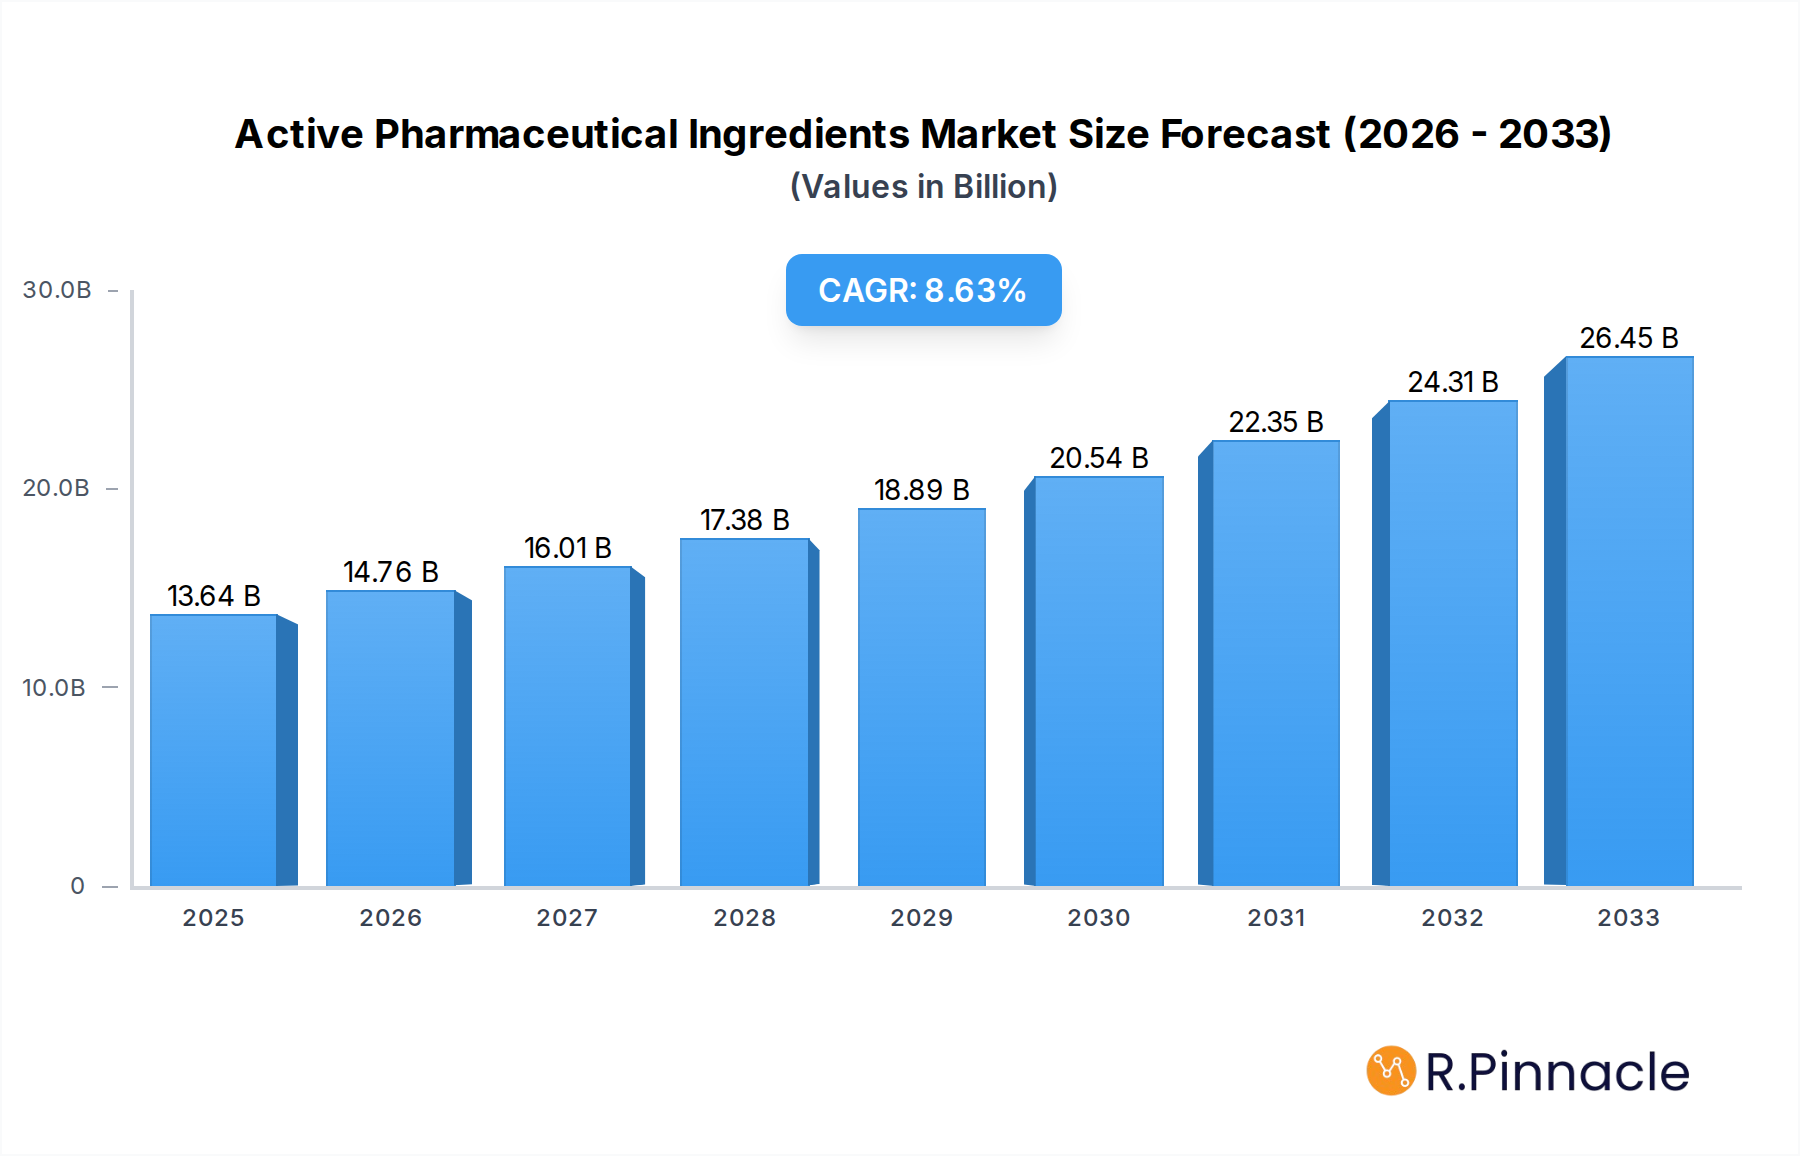
The Active Pharmaceutical Ingredients (API) market is poised for significant expansion, currently valued at an estimated USD 13.64 billion and projected to grow at a robust Compound Annual Growth Rate (CAGR) of 8.31% from 2025 to 2033. This sustained growth is underpinned by a confluence of powerful market drivers. Escalating global healthcare expenditure, driven by an aging population and the increasing prevalence of chronic diseases like cardiovascular ailments and cancer, fuels the demand for essential medications. Furthermore, advancements in drug discovery and development, particularly in complex therapeutic areas such as oncology and neurology, necessitate a consistent and high-quality supply of APIs. The trend towards personalized medicine and the rise of biopharmaceuticals also contribute to market dynamism, requiring specialized and innovative API production.

Active Pharmaceutical Ingredients Market Market Size (In Billion)
Despite this optimistic outlook, the API market faces certain restraints. The stringent regulatory landscape governing API manufacturing and quality control, coupled with the lengthy approval processes for new drugs, can pose challenges for market participants. Additionally, price pressures from generic drug manufacturers and the increasing outsourcing of API production to cost-effective regions can impact profit margins. However, the market is actively adapting. Key trends include the growing adoption of green chemistry principles to enhance sustainability in API synthesis and the increasing integration of digital technologies, such as AI and machine learning, to optimize R&D processes and improve manufacturing efficiency. The market is segmented across various business models (Captive API, Merchant API), synthesis types (Synthetic, Biotech), drug types (Generic, Branded), and diverse applications spanning cardiology, oncology, pulmonology, neurology, orthopedics, ophthalmology, and other therapeutic areas, showcasing its breadth and depth. Leading companies like Boehringer Ingelheim, Novartis, and Pfizer are at the forefront of innovation and market penetration.
Active Pharmaceutical Ingredients Market Company Market Share
This in-depth report provides a definitive analysis of the global Active Pharmaceutical Ingredients (API) market, a critical segment underpinning the entire pharmaceutical industry. Spanning the historical period of 2019–2024 and projecting growth through 2033, this comprehensive study leverages advanced analytics and industry expertise to deliver actionable insights for manufacturers, suppliers, R&D professionals, and investors. Dive deep into market dynamics, regional dominance, emerging trends, and the competitive landscape of synthetic APIs, biotech APIs, generic drugs, branded drugs, and key therapeutic applications including cardiology, oncology, pulmonology, neurology, orthopedic, and ophthalmology.
Active Pharmaceutical Ingredients Market Market Structure & Innovation Trends
The Active Pharmaceutical Ingredients (API) market exhibits a moderately concentrated structure, with key players like Boehringer Ingelheim GmbH, Novartis AG, and Pfizer Inc. holding significant market shares. Innovation remains a primary driver, fueled by advancements in synthetic chemistry, biotechnology, and a growing demand for complex and novel APIs. Regulatory frameworks, such as stringent FDA and EMA guidelines, continue to shape market entry and product development. Product substitutes are primarily driven by the emergence of biosimilars and the development of alternative drug delivery systems. End-user demographics are increasingly influenced by the aging global population and the rising prevalence of chronic diseases, necessitating a broader range of therapeutic APIs. Merger and acquisition (M&A) activities are strategically employed to consolidate market presence, expand product portfolios, and gain access to new technologies. Recent M&A deals, such as the acquisition of certain assets by Viatris Inc., highlight consolidation trends. Estimated M&A deal values are projected to reach approximately $XX Billion by 2025, indicating robust strategic investment.
Active Pharmaceutical Ingredients Market Market Dynamics & Trends
The Active Pharmaceutical Ingredients (API) market is experiencing robust growth, driven by several interconnected factors. A key accelerator is the increasing global burden of chronic diseases, including cardiovascular disorders, cancer, and neurological conditions, which directly fuels the demand for a diverse range of APIs. The escalating healthcare expenditure worldwide, particularly in emerging economies, further bolsters market expansion as governments and private entities invest more in pharmaceutical research and development. Technological disruptions are continuously reshaping the API landscape. Advancements in continuous manufacturing processes are leading to more efficient, cost-effective, and sustainable API production, reducing lead times and enhancing product quality. The rise of biologics and the increasing complexity of peptide and antibody-based drugs necessitate specialized manufacturing capabilities, creating opportunities for biotech API manufacturers. Consumer preferences are subtly shifting towards personalized medicine and targeted therapies, demanding more specialized and potent APIs. This trend is particularly evident in oncology and neurology, where precision medicine approaches are gaining traction. The competitive dynamics are intensifying, characterized by fierce price competition in the generic API segment and a strong emphasis on intellectual property protection and innovation in the branded API sector. Strategic partnerships between pharmaceutical companies and Contract Development and Manufacturing Organizations (CDMOs) are becoming increasingly common, allowing for streamlined drug development and manufacturing. The CAGR for the API market is estimated to be around 6.5% from 2025 to 2033, with market penetration in key therapeutic areas like cardiology already exceeding 85%. The growing demand for novel drug formulations and the increasing prevalence of rare diseases are expected to further stimulate market growth. The shift towards sustainable manufacturing practices and the focus on reducing environmental impact are also becoming significant trends, influencing investment and R&D priorities within the API sector.
Dominant Regions & Segments in Active Pharmaceutical Ingredients Market
The Active Pharmaceutical Ingredients (API) market is characterized by regional dominance and segment-specific growth patterns. North America, particularly the United States, currently holds a leading position due to its advanced pharmaceutical research infrastructure, high healthcare spending, and strong presence of major pharmaceutical companies. The region benefits from robust regulatory oversight and a significant demand for both generic and branded APIs across various therapeutic applications.
Leading Region: North America.
- Key Drivers: High R&D investment, established pharmaceutical giants, strong regulatory frameworks, and significant healthcare expenditure.
- Detailed Dominance Analysis: The US market, in particular, drives demand for APIs in cardiology, oncology, and neurology, owing to the high incidence of these diseases and the availability of advanced treatment options. The presence of major pharmaceutical innovators and generics manufacturers ensures a consistent demand for a wide spectrum of APIs.
Dominant Segments:
- Business Mode: Merchant API segment is projected to witness substantial growth, driven by the increasing reliance of pharmaceutical companies on external suppliers for cost-effective and specialized API production. Captive API manufacturing remains significant for large integrated players.
- Key Drivers: Cost-effectiveness, specialization, and outsourcing trends.
- Synthesis Type: The Synthetic API segment continues to dominate, owing to its established manufacturing processes and broad applicability across various drug types. However, the Biotech API segment is experiencing rapid expansion, fueled by the growing demand for biologics, monoclonal antibodies, and recombinant proteins.
- Key Drivers: Established infrastructure, cost-efficiency (Synthetic); rising demand for biologics, complex therapies (Biotech).
- Drug Type: The Generic API segment holds the largest market share due to patent expiries of blockbuster drugs and the increasing emphasis on affordable healthcare solutions. The Branded API segment, while smaller in volume, commands higher value and is driven by innovation and proprietary drug development.
- Key Drivers: Affordability, patent expiries (Generic); innovation, specialized therapies (Branded).
- Application: Cardiology and Oncology are the most significant application segments, driven by the high prevalence of cardiovascular diseases and cancer globally, coupled with continuous advancements in treatment. Pulmonology and Neurology are also experiencing robust growth due to increasing awareness and improved diagnostic capabilities.
- Key Drivers: High disease burden, R&D investment, advanced treatment options.
- Business Mode: Merchant API segment is projected to witness substantial growth, driven by the increasing reliance of pharmaceutical companies on external suppliers for cost-effective and specialized API production. Captive API manufacturing remains significant for large integrated players.
Asia Pacific, particularly China and India, is emerging as a crucial manufacturing hub for APIs due to lower production costs and government initiatives promoting local manufacturing. This region is expected to exhibit the highest growth rate in the coming years.
Active Pharmaceutical Ingredients Market Product Innovations
Product innovation in the API market is characterized by the development of novel synthetic routes for complex molecules, advancements in biotech manufacturing for biologics and peptides, and the optimization of purification techniques. Companies are focusing on enhancing the efficacy and safety of APIs for oncology, neurology, and immunology applications. Competitive advantages are derived from intellectual property protection, the ability to scale up production efficiently, and adherence to stringent quality standards like Good Manufacturing Practices (GMP). The increasing integration of artificial intelligence and machine learning in drug discovery and API synthesis is also a significant technological trend.
Report Scope & Segmentation Analysis
This report provides a comprehensive analysis of the Active Pharmaceutical Ingredients (API) market, segmented across key parameters. The Business Mode includes Captive API and Merchant API, with Merchant APIs anticipated to see robust growth due to outsourcing trends. The Synthesis Type covers Synthetic and Biotech APIs, with Synthetic dominating in volume but Biotech experiencing rapid expansion driven by biologics. The Drug Type segmentation focuses on Generic and Branded APIs, with Generic APIs leading in market share due to cost-effectiveness. The Application segment details APIs for Cardiology, Oncology, Pulmonology, Neurology, Orthopedic, Ophthalmology, and Other Applications, with Cardiology and Oncology being the largest contributors to market revenue. Growth projections and market sizes for each segment are thoroughly analyzed, revealing competitive dynamics and future potential.
Key Drivers of Active Pharmaceutical Ingredients Market Growth
The Active Pharmaceutical Ingredients (API) market is propelled by a confluence of powerful growth drivers. The escalating global prevalence of chronic diseases, such as cardiovascular ailments, cancer, and neurological disorders, directly translates to an increased demand for therapeutic APIs. This is further amplified by rising healthcare expenditures worldwide, particularly in developing economies, as governments and private sectors invest more in pharmaceutical R&D and accessible treatments. Technological advancements, including continuous manufacturing processes and advancements in biotechnology for complex biologics, are enhancing production efficiency and enabling the development of novel drugs. Government initiatives and policies aimed at promoting domestic pharmaceutical manufacturing and reducing import dependency, as seen in India, also play a crucial role in market expansion.
Challenges in the Active Pharmaceutical Ingredients Market Sector
The Active Pharmaceutical Ingredients (API) market faces several significant challenges that can impede growth. Stringent and evolving regulatory landscapes across different regions necessitate substantial investment in compliance and quality control, increasing operational costs and lead times. Supply chain disruptions, exacerbated by geopolitical events, trade tensions, and pandemics, pose a persistent risk to the availability and cost of raw materials and finished APIs. Intense price competition, particularly in the generic API segment, puts pressure on profit margins. Furthermore, the increasing complexity of drug molecules, especially in the biologics and oncology sectors, requires specialized expertise and advanced manufacturing capabilities, creating barriers to entry for smaller players. The environmental impact of chemical synthesis also presents a growing concern, demanding more sustainable manufacturing practices.
Emerging Opportunities in Active Pharmaceutical Ingredients Market
The Active Pharmaceutical Ingredients (API) market is ripe with emerging opportunities. The growing demand for personalized medicine and targeted therapies is creating a niche for highly specialized and potent APIs, particularly in oncology and neurology. The expanding biologics market presents significant growth potential for biotech API manufacturers, driven by the development of novel monoclonal antibodies, vaccines, and gene therapies. The increasing focus on sustainable manufacturing practices and green chemistry is opening doors for innovative and environmentally friendly API production technologies. Furthermore, the growing healthcare infrastructure and rising disposable incomes in emerging economies are creating new market frontiers for API suppliers. The trend of backward integration by pharmaceutical companies and strategic partnerships with CDMOs also presents opportunities for API manufacturers with specialized capabilities.
Leading Players in the Active Pharmaceutical Ingredients Market Market
- Boehringer Ingelheim GmbH
- Novartis AG
- Viatris Inc.
- Lupin Ltd
- BASF SE
- Sun Pharmaceutical Industries Ltd
- Aurobindo Pharma
- Sanofi Inc
- Dr Reddy's Laboratories Ltd
- GlaxoSmithKline PLC
- Pfizer Inc
Key Developments in Active Pharmaceutical Ingredients Market Industry
- July 2022: Piramal Pharma Limited's Pharma Solutions business, a leading Contract Development and Manufacturing Organization (CDMO), launched a new active pharmaceutical ingredient (API) plant at the company's site in Aurora, Ontario. This expansion aims to enhance its manufacturing capabilities for complex APIs.
- March 2022: India started the local manufacturing of 35 active pharmaceutical ingredients (APIs), for which the country was 90% dependent on import activities from China, under the Production-Linked Incentives (PLI) scheme. This initiative aims to bolster domestic API production and reduce reliance on imports.
Future Outlook for Active Pharmaceutical Ingredients Market Market
The Active Pharmaceutical Ingredients (API) market is poised for sustained growth in the future, driven by ongoing innovation and increasing global healthcare demands. The continued rise of chronic diseases, coupled with advancements in pharmaceutical research and development, will fuel the demand for a diverse range of APIs. The increasing adoption of advanced manufacturing technologies, such as continuous manufacturing and artificial intelligence in drug discovery, will enhance efficiency and sustainability. The growing significance of biologics and personalized medicine will further diversify the market, creating significant opportunities for biotech API manufacturers. Strategic collaborations, mergers, and acquisitions will continue to shape the competitive landscape, enabling companies to expand their portfolios and market reach. The focus on supply chain resilience and domestic manufacturing capabilities will remain a critical factor influencing market dynamics.
Active Pharmaceutical Ingredients Market Segmentation
-
1. Business Mode
- 1.1. Captive API
- 1.2. Merchant API
-
2. Synthesis Type
- 2.1. Synthetic
- 2.2. Biotech
-
3. Drug Type
- 3.1. Generic
- 3.2. Branded
-
4. Application
- 4.1. Cardiology
- 4.2. Oncology
- 4.3. Pulmonology
- 4.4. Neurology
- 4.5. Orthopedic
- 4.6. Ophthalmology
- 4.7. Other Applications
Active Pharmaceutical Ingredients Market Segmentation By Geography
-
1. North America
- 1.1. United States
- 1.2. Canada
- 1.3. Mexico
-
2. South America
- 2.1. Brazil
- 2.2. Argentina
- 2.3. Rest of South America
-
3. Europe
- 3.1. United Kingdom
- 3.2. Germany
- 3.3. France
- 3.4. Italy
- 3.5. Spain
- 3.6. Russia
- 3.7. Benelux
- 3.8. Nordics
- 3.9. Rest of Europe
-
4. Middle East & Africa
- 4.1. Turkey
- 4.2. Israel
- 4.3. GCC
- 4.4. North Africa
- 4.5. South Africa
- 4.6. Rest of Middle East & Africa
-
5. Asia Pacific
- 5.1. China
- 5.2. India
- 5.3. Japan
- 5.4. South Korea
- 5.5. ASEAN
- 5.6. Oceania
- 5.7. Rest of Asia Pacific
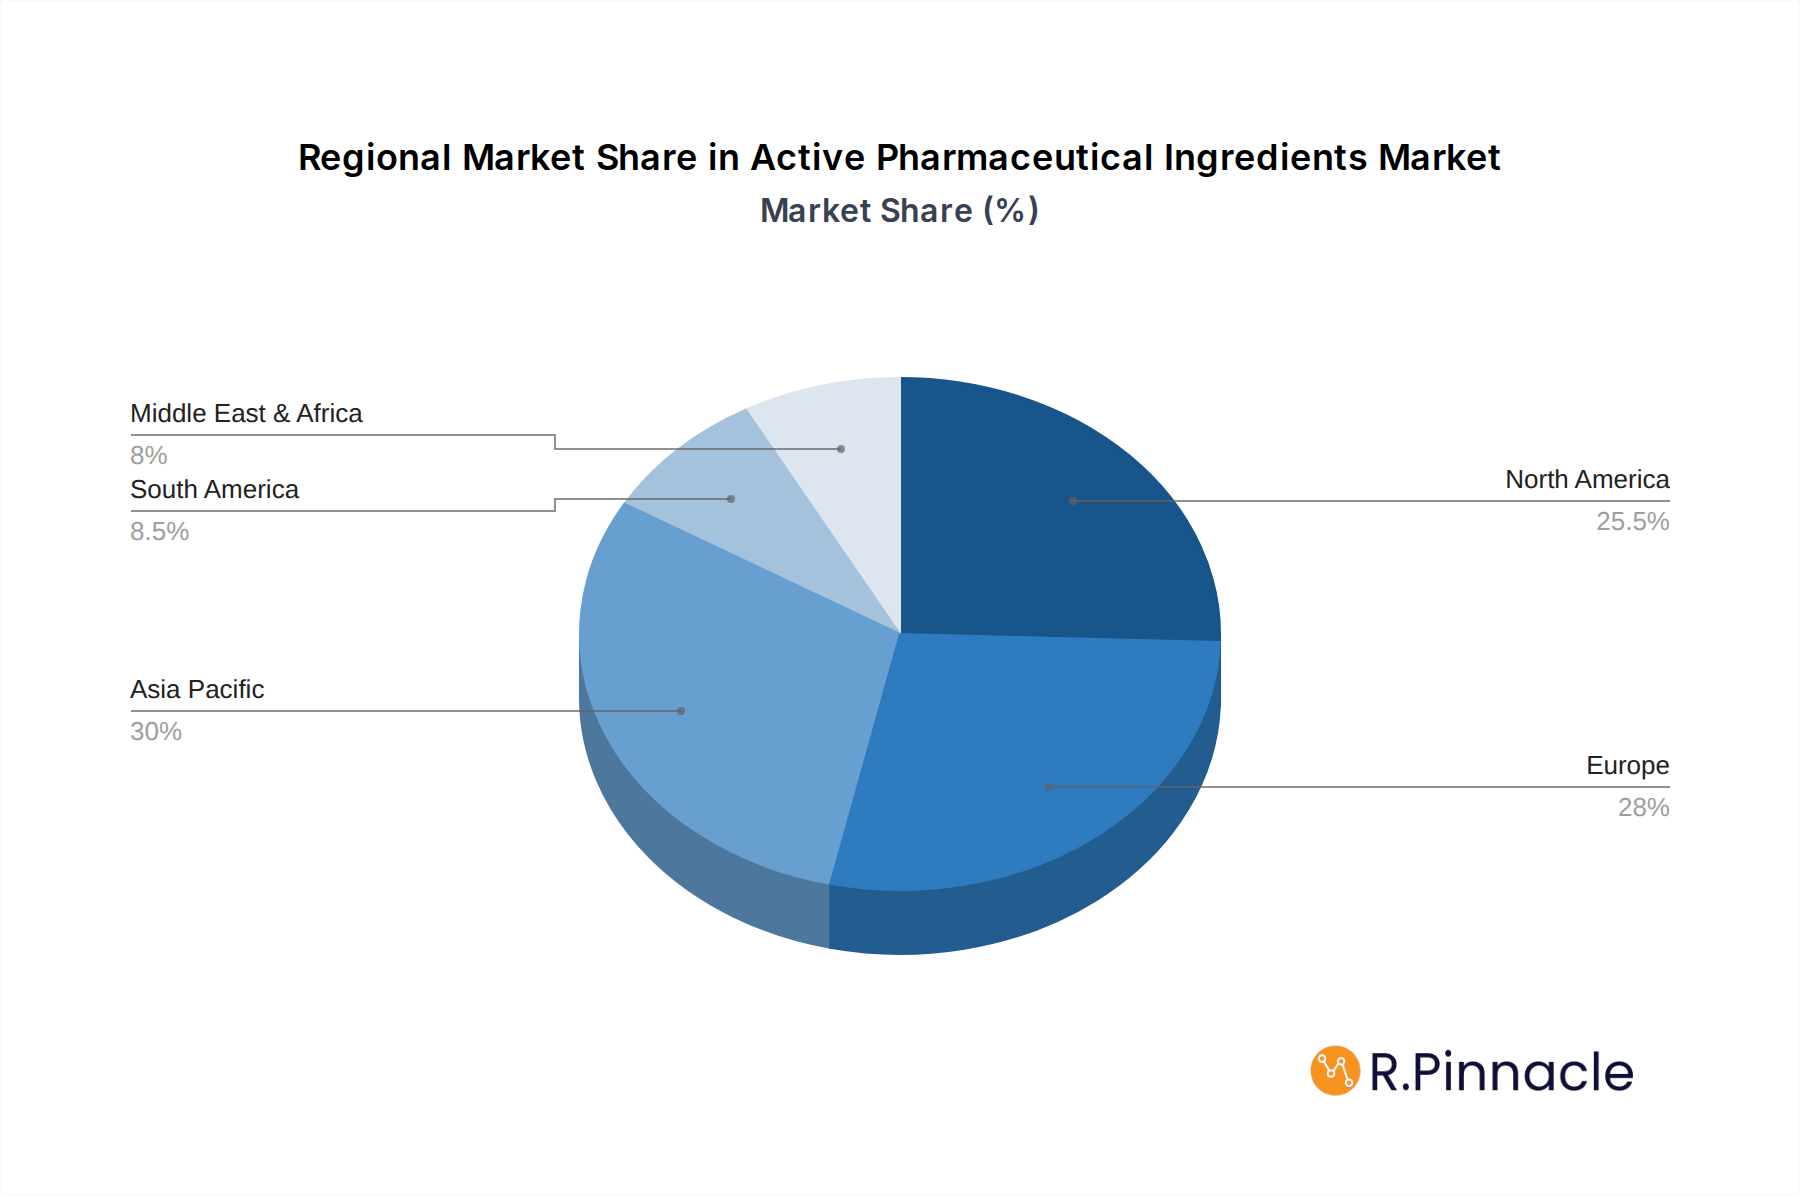
Active Pharmaceutical Ingredients Market Regional Market Share
Geographic Coverage of Active Pharmaceutical Ingredients Market
Active Pharmaceutical Ingredients Market REPORT HIGHLIGHTS
| Aspects | Details |
|---|---|
| Study Period | 2020-2034 |
| Base Year | 2025 |
| Estimated Year | 2026 |
| Forecast Period | 2026-2034 |
| Historical Period | 2020-2025 |
| Growth Rate | CAGR of 8.31% from 2020-2034 |
| Segmentation |
|
Table of Contents
- 1. Introduction
- 1.1. Research Scope
- 1.2. Market Segmentation
- 1.3. Research Objective
- 1.4. Definitions and Assumptions
- 2. Executive Summary
- 2.1. Market Snapshot
- 3. Market Dynamics
- 3.1. Market Drivers
- 3.2. Market Restrains
- 3.3. Market Trends
- 3.4. Market Opportunities
- 4. Market Factor Analysis
- 4.1. Porters Five Forces
- 4.1.1. Bargaining Power of Suppliers
- 4.1.2. Bargaining Power of Buyers
- 4.1.3. Threat of New Entrants
- 4.1.4. Threat of Substitutes
- 4.1.5. Competitive Rivalry
- 4.2. PESTEL analysis
- 4.3. BCG Analysis
- 4.3.1. Stars (High Growth, High Market Share)
- 4.3.2. Cash Cows (Low Growth, High Market Share)
- 4.3.3. Question Mark (High Growth, Low Market Share)
- 4.3.4. Dogs (Low Growth, Low Market Share)
- 4.4. Ansoff Matrix Analysis
- 4.5. Supply Chain Analysis
- 4.6. Regulatory Landscape
- 4.7. Current Market Potential and Opportunity Assessment (TAM–SAM–SOM Framework)
- 4.8. PRI Analyst Note
- 4.1. Porters Five Forces
- 5. Market Analysis, Insights and Forecast 2021-2033
- 5.1. Market Analysis, Insights and Forecast - by Business Mode
- 5.1.1. Captive API
- 5.1.2. Merchant API
- 5.2. Market Analysis, Insights and Forecast - by Synthesis Type
- 5.2.1. Synthetic
- 5.2.2. Biotech
- 5.3. Market Analysis, Insights and Forecast - by Drug Type
- 5.3.1. Generic
- 5.3.2. Branded
- 5.4. Market Analysis, Insights and Forecast - by Application
- 5.4.1. Cardiology
- 5.4.2. Oncology
- 5.4.3. Pulmonology
- 5.4.4. Neurology
- 5.4.5. Orthopedic
- 5.4.6. Ophthalmology
- 5.4.7. Other Applications
- 5.5. Market Analysis, Insights and Forecast - by Region
- 5.5.1. North America
- 5.5.2. South America
- 5.5.3. Europe
- 5.5.4. Middle East & Africa
- 5.5.5. Asia Pacific
- 5.1. Market Analysis, Insights and Forecast - by Business Mode
- 6. Global Active Pharmaceutical Ingredients Market Analysis, Insights and Forecast, 2021-2033
- 6.1. Market Analysis, Insights and Forecast - by Business Mode
- 6.1.1. Captive API
- 6.1.2. Merchant API
- 6.2. Market Analysis, Insights and Forecast - by Synthesis Type
- 6.2.1. Synthetic
- 6.2.2. Biotech
- 6.3. Market Analysis, Insights and Forecast - by Drug Type
- 6.3.1. Generic
- 6.3.2. Branded
- 6.4. Market Analysis, Insights and Forecast - by Application
- 6.4.1. Cardiology
- 6.4.2. Oncology
- 6.4.3. Pulmonology
- 6.4.4. Neurology
- 6.4.5. Orthopedic
- 6.4.6. Ophthalmology
- 6.4.7. Other Applications
- 6.1. Market Analysis, Insights and Forecast - by Business Mode
- 7. North America Active Pharmaceutical Ingredients Market Analysis, Insights and Forecast, 2020-2032
- 7.1. Market Analysis, Insights and Forecast - by Business Mode
- 7.1.1. Captive API
- 7.1.2. Merchant API
- 7.2. Market Analysis, Insights and Forecast - by Synthesis Type
- 7.2.1. Synthetic
- 7.2.2. Biotech
- 7.3. Market Analysis, Insights and Forecast - by Drug Type
- 7.3.1. Generic
- 7.3.2. Branded
- 7.4. Market Analysis, Insights and Forecast - by Application
- 7.4.1. Cardiology
- 7.4.2. Oncology
- 7.4.3. Pulmonology
- 7.4.4. Neurology
- 7.4.5. Orthopedic
- 7.4.6. Ophthalmology
- 7.4.7. Other Applications
- 7.1. Market Analysis, Insights and Forecast - by Business Mode
- 8. South America Active Pharmaceutical Ingredients Market Analysis, Insights and Forecast, 2020-2032
- 8.1. Market Analysis, Insights and Forecast - by Business Mode
- 8.1.1. Captive API
- 8.1.2. Merchant API
- 8.2. Market Analysis, Insights and Forecast - by Synthesis Type
- 8.2.1. Synthetic
- 8.2.2. Biotech
- 8.3. Market Analysis, Insights and Forecast - by Drug Type
- 8.3.1. Generic
- 8.3.2. Branded
- 8.4. Market Analysis, Insights and Forecast - by Application
- 8.4.1. Cardiology
- 8.4.2. Oncology
- 8.4.3. Pulmonology
- 8.4.4. Neurology
- 8.4.5. Orthopedic
- 8.4.6. Ophthalmology
- 8.4.7. Other Applications
- 8.1. Market Analysis, Insights and Forecast - by Business Mode
- 9. Europe Active Pharmaceutical Ingredients Market Analysis, Insights and Forecast, 2020-2032
- 9.1. Market Analysis, Insights and Forecast - by Business Mode
- 9.1.1. Captive API
- 9.1.2. Merchant API
- 9.2. Market Analysis, Insights and Forecast - by Synthesis Type
- 9.2.1. Synthetic
- 9.2.2. Biotech
- 9.3. Market Analysis, Insights and Forecast - by Drug Type
- 9.3.1. Generic
- 9.3.2. Branded
- 9.4. Market Analysis, Insights and Forecast - by Application
- 9.4.1. Cardiology
- 9.4.2. Oncology
- 9.4.3. Pulmonology
- 9.4.4. Neurology
- 9.4.5. Orthopedic
- 9.4.6. Ophthalmology
- 9.4.7. Other Applications
- 9.1. Market Analysis, Insights and Forecast - by Business Mode
- 10. Middle East & Africa Active Pharmaceutical Ingredients Market Analysis, Insights and Forecast, 2020-2032
- 10.1. Market Analysis, Insights and Forecast - by Business Mode
- 10.1.1. Captive API
- 10.1.2. Merchant API
- 10.2. Market Analysis, Insights and Forecast - by Synthesis Type
- 10.2.1. Synthetic
- 10.2.2. Biotech
- 10.3. Market Analysis, Insights and Forecast - by Drug Type
- 10.3.1. Generic
- 10.3.2. Branded
- 10.4. Market Analysis, Insights and Forecast - by Application
- 10.4.1. Cardiology
- 10.4.2. Oncology
- 10.4.3. Pulmonology
- 10.4.4. Neurology
- 10.4.5. Orthopedic
- 10.4.6. Ophthalmology
- 10.4.7. Other Applications
- 10.1. Market Analysis, Insights and Forecast - by Business Mode
- 11. Asia Pacific Active Pharmaceutical Ingredients Market Analysis, Insights and Forecast, 2020-2032
- 11.1. Market Analysis, Insights and Forecast - by Business Mode
- 11.1.1. Captive API
- 11.1.2. Merchant API
- 11.2. Market Analysis, Insights and Forecast - by Synthesis Type
- 11.2.1. Synthetic
- 11.2.2. Biotech
- 11.3. Market Analysis, Insights and Forecast - by Drug Type
- 11.3.1. Generic
- 11.3.2. Branded
- 11.4. Market Analysis, Insights and Forecast - by Application
- 11.4.1. Cardiology
- 11.4.2. Oncology
- 11.4.3. Pulmonology
- 11.4.4. Neurology
- 11.4.5. Orthopedic
- 11.4.6. Ophthalmology
- 11.4.7. Other Applications
- 11.1. Market Analysis, Insights and Forecast - by Business Mode
- 12. Competitive Analysis
- 12.1. Company Profiles
- 12.1.1 Boehringer Ingelheim GmbH
- 12.1.1.1. Company Overview
- 12.1.1.2. Products
- 12.1.1.3. Company Financials
- 12.1.1.4. SWOT Analysis
- 12.1.2 Novartis AG
- 12.1.2.1. Company Overview
- 12.1.2.2. Products
- 12.1.2.3. Company Financials
- 12.1.2.4. SWOT Analysis
- 12.1.3 Viatris Inc
- 12.1.3.1. Company Overview
- 12.1.3.2. Products
- 12.1.3.3. Company Financials
- 12.1.3.4. SWOT Analysis
- 12.1.4 Lupin Ltd
- 12.1.4.1. Company Overview
- 12.1.4.2. Products
- 12.1.4.3. Company Financials
- 12.1.4.4. SWOT Analysis
- 12.1.5 BASF SE
- 12.1.5.1. Company Overview
- 12.1.5.2. Products
- 12.1.5.3. Company Financials
- 12.1.5.4. SWOT Analysis
- 12.1.6 Sun Pharmaceutical Industries Ltd
- 12.1.6.1. Company Overview
- 12.1.6.2. Products
- 12.1.6.3. Company Financials
- 12.1.6.4. SWOT Analysis
- 12.1.7 Aurobindo Pharma
- 12.1.7.1. Company Overview
- 12.1.7.2. Products
- 12.1.7.3. Company Financials
- 12.1.7.4. SWOT Analysis
- 12.1.8 Sanofi Inc
- 12.1.8.1. Company Overview
- 12.1.8.2. Products
- 12.1.8.3. Company Financials
- 12.1.8.4. SWOT Analysis
- 12.1.9 Dr Reddy's Laboratories Ltd
- 12.1.9.1. Company Overview
- 12.1.9.2. Products
- 12.1.9.3. Company Financials
- 12.1.9.4. SWOT Analysis
- 12.1.10 GlaxoSmithKline PLC
- 12.1.10.1. Company Overview
- 12.1.10.2. Products
- 12.1.10.3. Company Financials
- 12.1.10.4. SWOT Analysis
- 12.1.11 Pfizer Inc
- 12.1.11.1. Company Overview
- 12.1.11.2. Products
- 12.1.11.3. Company Financials
- 12.1.11.4. SWOT Analysis
- 12.1.1 Boehringer Ingelheim GmbH
- 12.2. Market Entropy
- 12.2.1 Company's Key Areas Served
- 12.2.2 Recent Developments
- 12.3. Company Market Share Analysis 2025
- 12.3.1 Top 5 Companies Market Share Analysis
- 12.3.2 Top 3 Companies Market Share Analysis
- 12.4. List of Potential Customers
- 13. Research Methodology
List of Figures
- Figure 1: Global Active Pharmaceutical Ingredients Market Revenue Breakdown (Million, %) by Region 2025 & 2033
- Figure 2: Global Active Pharmaceutical Ingredients Market Volume Breakdown (k unit , %) by Region 2025 & 2033
- Figure 3: North America Active Pharmaceutical Ingredients Market Revenue (Million), by Business Mode 2025 & 2033
- Figure 4: North America Active Pharmaceutical Ingredients Market Volume (k unit ), by Business Mode 2025 & 2033
- Figure 5: North America Active Pharmaceutical Ingredients Market Revenue Share (%), by Business Mode 2025 & 2033
- Figure 6: North America Active Pharmaceutical Ingredients Market Volume Share (%), by Business Mode 2025 & 2033
- Figure 7: North America Active Pharmaceutical Ingredients Market Revenue (Million), by Synthesis Type 2025 & 2033
- Figure 8: North America Active Pharmaceutical Ingredients Market Volume (k unit ), by Synthesis Type 2025 & 2033
- Figure 9: North America Active Pharmaceutical Ingredients Market Revenue Share (%), by Synthesis Type 2025 & 2033
- Figure 10: North America Active Pharmaceutical Ingredients Market Volume Share (%), by Synthesis Type 2025 & 2033
- Figure 11: North America Active Pharmaceutical Ingredients Market Revenue (Million), by Drug Type 2025 & 2033
- Figure 12: North America Active Pharmaceutical Ingredients Market Volume (k unit ), by Drug Type 2025 & 2033
- Figure 13: North America Active Pharmaceutical Ingredients Market Revenue Share (%), by Drug Type 2025 & 2033
- Figure 14: North America Active Pharmaceutical Ingredients Market Volume Share (%), by Drug Type 2025 & 2033
- Figure 15: North America Active Pharmaceutical Ingredients Market Revenue (Million), by Application 2025 & 2033
- Figure 16: North America Active Pharmaceutical Ingredients Market Volume (k unit ), by Application 2025 & 2033
- Figure 17: North America Active Pharmaceutical Ingredients Market Revenue Share (%), by Application 2025 & 2033
- Figure 18: North America Active Pharmaceutical Ingredients Market Volume Share (%), by Application 2025 & 2033
- Figure 19: North America Active Pharmaceutical Ingredients Market Revenue (Million), by Country 2025 & 2033
- Figure 20: North America Active Pharmaceutical Ingredients Market Volume (k unit ), by Country 2025 & 2033
- Figure 21: North America Active Pharmaceutical Ingredients Market Revenue Share (%), by Country 2025 & 2033
- Figure 22: North America Active Pharmaceutical Ingredients Market Volume Share (%), by Country 2025 & 2033
- Figure 23: South America Active Pharmaceutical Ingredients Market Revenue (Million), by Business Mode 2025 & 2033
- Figure 24: South America Active Pharmaceutical Ingredients Market Volume (k unit ), by Business Mode 2025 & 2033
- Figure 25: South America Active Pharmaceutical Ingredients Market Revenue Share (%), by Business Mode 2025 & 2033
- Figure 26: South America Active Pharmaceutical Ingredients Market Volume Share (%), by Business Mode 2025 & 2033
- Figure 27: South America Active Pharmaceutical Ingredients Market Revenue (Million), by Synthesis Type 2025 & 2033
- Figure 28: South America Active Pharmaceutical Ingredients Market Volume (k unit ), by Synthesis Type 2025 & 2033
- Figure 29: South America Active Pharmaceutical Ingredients Market Revenue Share (%), by Synthesis Type 2025 & 2033
- Figure 30: South America Active Pharmaceutical Ingredients Market Volume Share (%), by Synthesis Type 2025 & 2033
- Figure 31: South America Active Pharmaceutical Ingredients Market Revenue (Million), by Drug Type 2025 & 2033
- Figure 32: South America Active Pharmaceutical Ingredients Market Volume (k unit ), by Drug Type 2025 & 2033
- Figure 33: South America Active Pharmaceutical Ingredients Market Revenue Share (%), by Drug Type 2025 & 2033
- Figure 34: South America Active Pharmaceutical Ingredients Market Volume Share (%), by Drug Type 2025 & 2033
- Figure 35: South America Active Pharmaceutical Ingredients Market Revenue (Million), by Application 2025 & 2033
- Figure 36: South America Active Pharmaceutical Ingredients Market Volume (k unit ), by Application 2025 & 2033
- Figure 37: South America Active Pharmaceutical Ingredients Market Revenue Share (%), by Application 2025 & 2033
- Figure 38: South America Active Pharmaceutical Ingredients Market Volume Share (%), by Application 2025 & 2033
- Figure 39: South America Active Pharmaceutical Ingredients Market Revenue (Million), by Country 2025 & 2033
- Figure 40: South America Active Pharmaceutical Ingredients Market Volume (k unit ), by Country 2025 & 2033
- Figure 41: South America Active Pharmaceutical Ingredients Market Revenue Share (%), by Country 2025 & 2033
- Figure 42: South America Active Pharmaceutical Ingredients Market Volume Share (%), by Country 2025 & 2033
- Figure 43: Europe Active Pharmaceutical Ingredients Market Revenue (Million), by Business Mode 2025 & 2033
- Figure 44: Europe Active Pharmaceutical Ingredients Market Volume (k unit ), by Business Mode 2025 & 2033
- Figure 45: Europe Active Pharmaceutical Ingredients Market Revenue Share (%), by Business Mode 2025 & 2033
- Figure 46: Europe Active Pharmaceutical Ingredients Market Volume Share (%), by Business Mode 2025 & 2033
- Figure 47: Europe Active Pharmaceutical Ingredients Market Revenue (Million), by Synthesis Type 2025 & 2033
- Figure 48: Europe Active Pharmaceutical Ingredients Market Volume (k unit ), by Synthesis Type 2025 & 2033
- Figure 49: Europe Active Pharmaceutical Ingredients Market Revenue Share (%), by Synthesis Type 2025 & 2033
- Figure 50: Europe Active Pharmaceutical Ingredients Market Volume Share (%), by Synthesis Type 2025 & 2033
- Figure 51: Europe Active Pharmaceutical Ingredients Market Revenue (Million), by Drug Type 2025 & 2033
- Figure 52: Europe Active Pharmaceutical Ingredients Market Volume (k unit ), by Drug Type 2025 & 2033
- Figure 53: Europe Active Pharmaceutical Ingredients Market Revenue Share (%), by Drug Type 2025 & 2033
- Figure 54: Europe Active Pharmaceutical Ingredients Market Volume Share (%), by Drug Type 2025 & 2033
- Figure 55: Europe Active Pharmaceutical Ingredients Market Revenue (Million), by Application 2025 & 2033
- Figure 56: Europe Active Pharmaceutical Ingredients Market Volume (k unit ), by Application 2025 & 2033
- Figure 57: Europe Active Pharmaceutical Ingredients Market Revenue Share (%), by Application 2025 & 2033
- Figure 58: Europe Active Pharmaceutical Ingredients Market Volume Share (%), by Application 2025 & 2033
- Figure 59: Europe Active Pharmaceutical Ingredients Market Revenue (Million), by Country 2025 & 2033
- Figure 60: Europe Active Pharmaceutical Ingredients Market Volume (k unit ), by Country 2025 & 2033
- Figure 61: Europe Active Pharmaceutical Ingredients Market Revenue Share (%), by Country 2025 & 2033
- Figure 62: Europe Active Pharmaceutical Ingredients Market Volume Share (%), by Country 2025 & 2033
- Figure 63: Middle East & Africa Active Pharmaceutical Ingredients Market Revenue (Million), by Business Mode 2025 & 2033
- Figure 64: Middle East & Africa Active Pharmaceutical Ingredients Market Volume (k unit ), by Business Mode 2025 & 2033
- Figure 65: Middle East & Africa Active Pharmaceutical Ingredients Market Revenue Share (%), by Business Mode 2025 & 2033
- Figure 66: Middle East & Africa Active Pharmaceutical Ingredients Market Volume Share (%), by Business Mode 2025 & 2033
- Figure 67: Middle East & Africa Active Pharmaceutical Ingredients Market Revenue (Million), by Synthesis Type 2025 & 2033
- Figure 68: Middle East & Africa Active Pharmaceutical Ingredients Market Volume (k unit ), by Synthesis Type 2025 & 2033
- Figure 69: Middle East & Africa Active Pharmaceutical Ingredients Market Revenue Share (%), by Synthesis Type 2025 & 2033
- Figure 70: Middle East & Africa Active Pharmaceutical Ingredients Market Volume Share (%), by Synthesis Type 2025 & 2033
- Figure 71: Middle East & Africa Active Pharmaceutical Ingredients Market Revenue (Million), by Drug Type 2025 & 2033
- Figure 72: Middle East & Africa Active Pharmaceutical Ingredients Market Volume (k unit ), by Drug Type 2025 & 2033
- Figure 73: Middle East & Africa Active Pharmaceutical Ingredients Market Revenue Share (%), by Drug Type 2025 & 2033
- Figure 74: Middle East & Africa Active Pharmaceutical Ingredients Market Volume Share (%), by Drug Type 2025 & 2033
- Figure 75: Middle East & Africa Active Pharmaceutical Ingredients Market Revenue (Million), by Application 2025 & 2033
- Figure 76: Middle East & Africa Active Pharmaceutical Ingredients Market Volume (k unit ), by Application 2025 & 2033
- Figure 77: Middle East & Africa Active Pharmaceutical Ingredients Market Revenue Share (%), by Application 2025 & 2033
- Figure 78: Middle East & Africa Active Pharmaceutical Ingredients Market Volume Share (%), by Application 2025 & 2033
- Figure 79: Middle East & Africa Active Pharmaceutical Ingredients Market Revenue (Million), by Country 2025 & 2033
- Figure 80: Middle East & Africa Active Pharmaceutical Ingredients Market Volume (k unit ), by Country 2025 & 2033
- Figure 81: Middle East & Africa Active Pharmaceutical Ingredients Market Revenue Share (%), by Country 2025 & 2033
- Figure 82: Middle East & Africa Active Pharmaceutical Ingredients Market Volume Share (%), by Country 2025 & 2033
- Figure 83: Asia Pacific Active Pharmaceutical Ingredients Market Revenue (Million), by Business Mode 2025 & 2033
- Figure 84: Asia Pacific Active Pharmaceutical Ingredients Market Volume (k unit ), by Business Mode 2025 & 2033
- Figure 85: Asia Pacific Active Pharmaceutical Ingredients Market Revenue Share (%), by Business Mode 2025 & 2033
- Figure 86: Asia Pacific Active Pharmaceutical Ingredients Market Volume Share (%), by Business Mode 2025 & 2033
- Figure 87: Asia Pacific Active Pharmaceutical Ingredients Market Revenue (Million), by Synthesis Type 2025 & 2033
- Figure 88: Asia Pacific Active Pharmaceutical Ingredients Market Volume (k unit ), by Synthesis Type 2025 & 2033
- Figure 89: Asia Pacific Active Pharmaceutical Ingredients Market Revenue Share (%), by Synthesis Type 2025 & 2033
- Figure 90: Asia Pacific Active Pharmaceutical Ingredients Market Volume Share (%), by Synthesis Type 2025 & 2033
- Figure 91: Asia Pacific Active Pharmaceutical Ingredients Market Revenue (Million), by Drug Type 2025 & 2033
- Figure 92: Asia Pacific Active Pharmaceutical Ingredients Market Volume (k unit ), by Drug Type 2025 & 2033
- Figure 93: Asia Pacific Active Pharmaceutical Ingredients Market Revenue Share (%), by Drug Type 2025 & 2033
- Figure 94: Asia Pacific Active Pharmaceutical Ingredients Market Volume Share (%), by Drug Type 2025 & 2033
- Figure 95: Asia Pacific Active Pharmaceutical Ingredients Market Revenue (Million), by Application 2025 & 2033
- Figure 96: Asia Pacific Active Pharmaceutical Ingredients Market Volume (k unit ), by Application 2025 & 2033
- Figure 97: Asia Pacific Active Pharmaceutical Ingredients Market Revenue Share (%), by Application 2025 & 2033
- Figure 98: Asia Pacific Active Pharmaceutical Ingredients Market Volume Share (%), by Application 2025 & 2033
- Figure 99: Asia Pacific Active Pharmaceutical Ingredients Market Revenue (Million), by Country 2025 & 2033
- Figure 100: Asia Pacific Active Pharmaceutical Ingredients Market Volume (k unit ), by Country 2025 & 2033
- Figure 101: Asia Pacific Active Pharmaceutical Ingredients Market Revenue Share (%), by Country 2025 & 2033
- Figure 102: Asia Pacific Active Pharmaceutical Ingredients Market Volume Share (%), by Country 2025 & 2033
List of Tables
- Table 1: Global Active Pharmaceutical Ingredients Market Revenue Million Forecast, by Business Mode 2020 & 2033
- Table 2: Global Active Pharmaceutical Ingredients Market Volume k unit Forecast, by Business Mode 2020 & 2033
- Table 3: Global Active Pharmaceutical Ingredients Market Revenue Million Forecast, by Synthesis Type 2020 & 2033
- Table 4: Global Active Pharmaceutical Ingredients Market Volume k unit Forecast, by Synthesis Type 2020 & 2033
- Table 5: Global Active Pharmaceutical Ingredients Market Revenue Million Forecast, by Drug Type 2020 & 2033
- Table 6: Global Active Pharmaceutical Ingredients Market Volume k unit Forecast, by Drug Type 2020 & 2033
- Table 7: Global Active Pharmaceutical Ingredients Market Revenue Million Forecast, by Application 2020 & 2033
- Table 8: Global Active Pharmaceutical Ingredients Market Volume k unit Forecast, by Application 2020 & 2033
- Table 9: Global Active Pharmaceutical Ingredients Market Revenue Million Forecast, by Region 2020 & 2033
- Table 10: Global Active Pharmaceutical Ingredients Market Volume k unit Forecast, by Region 2020 & 2033
- Table 11: Global Active Pharmaceutical Ingredients Market Revenue Million Forecast, by Business Mode 2020 & 2033
- Table 12: Global Active Pharmaceutical Ingredients Market Volume k unit Forecast, by Business Mode 2020 & 2033
- Table 13: Global Active Pharmaceutical Ingredients Market Revenue Million Forecast, by Synthesis Type 2020 & 2033
- Table 14: Global Active Pharmaceutical Ingredients Market Volume k unit Forecast, by Synthesis Type 2020 & 2033
- Table 15: Global Active Pharmaceutical Ingredients Market Revenue Million Forecast, by Drug Type 2020 & 2033
- Table 16: Global Active Pharmaceutical Ingredients Market Volume k unit Forecast, by Drug Type 2020 & 2033
- Table 17: Global Active Pharmaceutical Ingredients Market Revenue Million Forecast, by Application 2020 & 2033
- Table 18: Global Active Pharmaceutical Ingredients Market Volume k unit Forecast, by Application 2020 & 2033
- Table 19: Global Active Pharmaceutical Ingredients Market Revenue Million Forecast, by Country 2020 & 2033
- Table 20: Global Active Pharmaceutical Ingredients Market Volume k unit Forecast, by Country 2020 & 2033
- Table 21: United States Active Pharmaceutical Ingredients Market Revenue (Million) Forecast, by Application 2020 & 2033
- Table 22: United States Active Pharmaceutical Ingredients Market Volume (k unit ) Forecast, by Application 2020 & 2033
- Table 23: Canada Active Pharmaceutical Ingredients Market Revenue (Million) Forecast, by Application 2020 & 2033
- Table 24: Canada Active Pharmaceutical Ingredients Market Volume (k unit ) Forecast, by Application 2020 & 2033
- Table 25: Mexico Active Pharmaceutical Ingredients Market Revenue (Million) Forecast, by Application 2020 & 2033
- Table 26: Mexico Active Pharmaceutical Ingredients Market Volume (k unit ) Forecast, by Application 2020 & 2033
- Table 27: Global Active Pharmaceutical Ingredients Market Revenue Million Forecast, by Business Mode 2020 & 2033
- Table 28: Global Active Pharmaceutical Ingredients Market Volume k unit Forecast, by Business Mode 2020 & 2033
- Table 29: Global Active Pharmaceutical Ingredients Market Revenue Million Forecast, by Synthesis Type 2020 & 2033
- Table 30: Global Active Pharmaceutical Ingredients Market Volume k unit Forecast, by Synthesis Type 2020 & 2033
- Table 31: Global Active Pharmaceutical Ingredients Market Revenue Million Forecast, by Drug Type 2020 & 2033
- Table 32: Global Active Pharmaceutical Ingredients Market Volume k unit Forecast, by Drug Type 2020 & 2033
- Table 33: Global Active Pharmaceutical Ingredients Market Revenue Million Forecast, by Application 2020 & 2033
- Table 34: Global Active Pharmaceutical Ingredients Market Volume k unit Forecast, by Application 2020 & 2033
- Table 35: Global Active Pharmaceutical Ingredients Market Revenue Million Forecast, by Country 2020 & 2033
- Table 36: Global Active Pharmaceutical Ingredients Market Volume k unit Forecast, by Country 2020 & 2033
- Table 37: Brazil Active Pharmaceutical Ingredients Market Revenue (Million) Forecast, by Application 2020 & 2033
- Table 38: Brazil Active Pharmaceutical Ingredients Market Volume (k unit ) Forecast, by Application 2020 & 2033
- Table 39: Argentina Active Pharmaceutical Ingredients Market Revenue (Million) Forecast, by Application 2020 & 2033
- Table 40: Argentina Active Pharmaceutical Ingredients Market Volume (k unit ) Forecast, by Application 2020 & 2033
- Table 41: Rest of South America Active Pharmaceutical Ingredients Market Revenue (Million) Forecast, by Application 2020 & 2033
- Table 42: Rest of South America Active Pharmaceutical Ingredients Market Volume (k unit ) Forecast, by Application 2020 & 2033
- Table 43: Global Active Pharmaceutical Ingredients Market Revenue Million Forecast, by Business Mode 2020 & 2033
- Table 44: Global Active Pharmaceutical Ingredients Market Volume k unit Forecast, by Business Mode 2020 & 2033
- Table 45: Global Active Pharmaceutical Ingredients Market Revenue Million Forecast, by Synthesis Type 2020 & 2033
- Table 46: Global Active Pharmaceutical Ingredients Market Volume k unit Forecast, by Synthesis Type 2020 & 2033
- Table 47: Global Active Pharmaceutical Ingredients Market Revenue Million Forecast, by Drug Type 2020 & 2033
- Table 48: Global Active Pharmaceutical Ingredients Market Volume k unit Forecast, by Drug Type 2020 & 2033
- Table 49: Global Active Pharmaceutical Ingredients Market Revenue Million Forecast, by Application 2020 & 2033
- Table 50: Global Active Pharmaceutical Ingredients Market Volume k unit Forecast, by Application 2020 & 2033
- Table 51: Global Active Pharmaceutical Ingredients Market Revenue Million Forecast, by Country 2020 & 2033
- Table 52: Global Active Pharmaceutical Ingredients Market Volume k unit Forecast, by Country 2020 & 2033
- Table 53: United Kingdom Active Pharmaceutical Ingredients Market Revenue (Million) Forecast, by Application 2020 & 2033
- Table 54: United Kingdom Active Pharmaceutical Ingredients Market Volume (k unit ) Forecast, by Application 2020 & 2033
- Table 55: Germany Active Pharmaceutical Ingredients Market Revenue (Million) Forecast, by Application 2020 & 2033
- Table 56: Germany Active Pharmaceutical Ingredients Market Volume (k unit ) Forecast, by Application 2020 & 2033
- Table 57: France Active Pharmaceutical Ingredients Market Revenue (Million) Forecast, by Application 2020 & 2033
- Table 58: France Active Pharmaceutical Ingredients Market Volume (k unit ) Forecast, by Application 2020 & 2033
- Table 59: Italy Active Pharmaceutical Ingredients Market Revenue (Million) Forecast, by Application 2020 & 2033
- Table 60: Italy Active Pharmaceutical Ingredients Market Volume (k unit ) Forecast, by Application 2020 & 2033
- Table 61: Spain Active Pharmaceutical Ingredients Market Revenue (Million) Forecast, by Application 2020 & 2033
- Table 62: Spain Active Pharmaceutical Ingredients Market Volume (k unit ) Forecast, by Application 2020 & 2033
- Table 63: Russia Active Pharmaceutical Ingredients Market Revenue (Million) Forecast, by Application 2020 & 2033
- Table 64: Russia Active Pharmaceutical Ingredients Market Volume (k unit ) Forecast, by Application 2020 & 2033
- Table 65: Benelux Active Pharmaceutical Ingredients Market Revenue (Million) Forecast, by Application 2020 & 2033
- Table 66: Benelux Active Pharmaceutical Ingredients Market Volume (k unit ) Forecast, by Application 2020 & 2033
- Table 67: Nordics Active Pharmaceutical Ingredients Market Revenue (Million) Forecast, by Application 2020 & 2033
- Table 68: Nordics Active Pharmaceutical Ingredients Market Volume (k unit ) Forecast, by Application 2020 & 2033
- Table 69: Rest of Europe Active Pharmaceutical Ingredients Market Revenue (Million) Forecast, by Application 2020 & 2033
- Table 70: Rest of Europe Active Pharmaceutical Ingredients Market Volume (k unit ) Forecast, by Application 2020 & 2033
- Table 71: Global Active Pharmaceutical Ingredients Market Revenue Million Forecast, by Business Mode 2020 & 2033
- Table 72: Global Active Pharmaceutical Ingredients Market Volume k unit Forecast, by Business Mode 2020 & 2033
- Table 73: Global Active Pharmaceutical Ingredients Market Revenue Million Forecast, by Synthesis Type 2020 & 2033
- Table 74: Global Active Pharmaceutical Ingredients Market Volume k unit Forecast, by Synthesis Type 2020 & 2033
- Table 75: Global Active Pharmaceutical Ingredients Market Revenue Million Forecast, by Drug Type 2020 & 2033
- Table 76: Global Active Pharmaceutical Ingredients Market Volume k unit Forecast, by Drug Type 2020 & 2033
- Table 77: Global Active Pharmaceutical Ingredients Market Revenue Million Forecast, by Application 2020 & 2033
- Table 78: Global Active Pharmaceutical Ingredients Market Volume k unit Forecast, by Application 2020 & 2033
- Table 79: Global Active Pharmaceutical Ingredients Market Revenue Million Forecast, by Country 2020 & 2033
- Table 80: Global Active Pharmaceutical Ingredients Market Volume k unit Forecast, by Country 2020 & 2033
- Table 81: Turkey Active Pharmaceutical Ingredients Market Revenue (Million) Forecast, by Application 2020 & 2033
- Table 82: Turkey Active Pharmaceutical Ingredients Market Volume (k unit ) Forecast, by Application 2020 & 2033
- Table 83: Israel Active Pharmaceutical Ingredients Market Revenue (Million) Forecast, by Application 2020 & 2033
- Table 84: Israel Active Pharmaceutical Ingredients Market Volume (k unit ) Forecast, by Application 2020 & 2033
- Table 85: GCC Active Pharmaceutical Ingredients Market Revenue (Million) Forecast, by Application 2020 & 2033
- Table 86: GCC Active Pharmaceutical Ingredients Market Volume (k unit ) Forecast, by Application 2020 & 2033
- Table 87: North Africa Active Pharmaceutical Ingredients Market Revenue (Million) Forecast, by Application 2020 & 2033
- Table 88: North Africa Active Pharmaceutical Ingredients Market Volume (k unit ) Forecast, by Application 2020 & 2033
- Table 89: South Africa Active Pharmaceutical Ingredients Market Revenue (Million) Forecast, by Application 2020 & 2033
- Table 90: South Africa Active Pharmaceutical Ingredients Market Volume (k unit ) Forecast, by Application 2020 & 2033
- Table 91: Rest of Middle East & Africa Active Pharmaceutical Ingredients Market Revenue (Million) Forecast, by Application 2020 & 2033
- Table 92: Rest of Middle East & Africa Active Pharmaceutical Ingredients Market Volume (k unit ) Forecast, by Application 2020 & 2033
- Table 93: Global Active Pharmaceutical Ingredients Market Revenue Million Forecast, by Business Mode 2020 & 2033
- Table 94: Global Active Pharmaceutical Ingredients Market Volume k unit Forecast, by Business Mode 2020 & 2033
- Table 95: Global Active Pharmaceutical Ingredients Market Revenue Million Forecast, by Synthesis Type 2020 & 2033
- Table 96: Global Active Pharmaceutical Ingredients Market Volume k unit Forecast, by Synthesis Type 2020 & 2033
- Table 97: Global Active Pharmaceutical Ingredients Market Revenue Million Forecast, by Drug Type 2020 & 2033
- Table 98: Global Active Pharmaceutical Ingredients Market Volume k unit Forecast, by Drug Type 2020 & 2033
- Table 99: Global Active Pharmaceutical Ingredients Market Revenue Million Forecast, by Application 2020 & 2033
- Table 100: Global Active Pharmaceutical Ingredients Market Volume k unit Forecast, by Application 2020 & 2033
- Table 101: Global Active Pharmaceutical Ingredients Market Revenue Million Forecast, by Country 2020 & 2033
- Table 102: Global Active Pharmaceutical Ingredients Market Volume k unit Forecast, by Country 2020 & 2033
- Table 103: China Active Pharmaceutical Ingredients Market Revenue (Million) Forecast, by Application 2020 & 2033
- Table 104: China Active Pharmaceutical Ingredients Market Volume (k unit ) Forecast, by Application 2020 & 2033
- Table 105: India Active Pharmaceutical Ingredients Market Revenue (Million) Forecast, by Application 2020 & 2033
- Table 106: India Active Pharmaceutical Ingredients Market Volume (k unit ) Forecast, by Application 2020 & 2033
- Table 107: Japan Active Pharmaceutical Ingredients Market Revenue (Million) Forecast, by Application 2020 & 2033
- Table 108: Japan Active Pharmaceutical Ingredients Market Volume (k unit ) Forecast, by Application 2020 & 2033
- Table 109: South Korea Active Pharmaceutical Ingredients Market Revenue (Million) Forecast, by Application 2020 & 2033
- Table 110: South Korea Active Pharmaceutical Ingredients Market Volume (k unit ) Forecast, by Application 2020 & 2033
- Table 111: ASEAN Active Pharmaceutical Ingredients Market Revenue (Million) Forecast, by Application 2020 & 2033
- Table 112: ASEAN Active Pharmaceutical Ingredients Market Volume (k unit ) Forecast, by Application 2020 & 2033
- Table 113: Oceania Active Pharmaceutical Ingredients Market Revenue (Million) Forecast, by Application 2020 & 2033
- Table 114: Oceania Active Pharmaceutical Ingredients Market Volume (k unit ) Forecast, by Application 2020 & 2033
- Table 115: Rest of Asia Pacific Active Pharmaceutical Ingredients Market Revenue (Million) Forecast, by Application 2020 & 2033
- Table 116: Rest of Asia Pacific Active Pharmaceutical Ingredients Market Volume (k unit ) Forecast, by Application 2020 & 2033
Frequently Asked Questions
1. What is the projected Compound Annual Growth Rate (CAGR) of the Active Pharmaceutical Ingredients Market?
The projected CAGR is approximately 8.31%.
2. Which companies are prominent players in the Active Pharmaceutical Ingredients Market?
Key companies in the market include Boehringer Ingelheim GmbH, Novartis AG, Viatris Inc, Lupin Ltd, BASF SE, Sun Pharmaceutical Industries Ltd, Aurobindo Pharma, Sanofi Inc, Dr Reddy's Laboratories Ltd, GlaxoSmithKline PLC, Pfizer Inc.
3. What are the main segments of the Active Pharmaceutical Ingredients Market?
The market segments include Business Mode, Synthesis Type, Drug Type, Application.
4. Can you provide details about the market size?
The market size is estimated to be USD 13.64 Million as of 2022.
5. What are some drivers contributing to market growth?
Increasing Prevalence of Infectious. Genetic. Cardiovascular. and Other Chronic Disorders; Rising Research & Development Activities of Generic Drugs; Increasing Adoption of Biologicals and Biosimilars.
6. What are the notable trends driving market growth?
Oncology Segment Expects to Register a High CAGR.
7. Are there any restraints impacting market growth?
Drug Price Control Policies; Stringent Regulations and Drug Price Policies in the Country.
8. Can you provide examples of recent developments in the market?
July 2022: Piramal Pharma Limited's Pharma Solutions business, a leading Contract Development and Manufacturing Organization (CDMO), launched a new active pharmaceutical ingredient (API) plant at the company's site in Aurora, Ontario.
9. What pricing options are available for accessing the report?
Pricing options include single-user, multi-user, and enterprise licenses priced at USD 3800, USD 4500, and USD 5800 respectively.
10. Is the market size provided in terms of value or volume?
The market size is provided in terms of value, measured in Million and volume, measured in k unit .
11. Are there any specific market keywords associated with the report?
Yes, the market keyword associated with the report is "Active Pharmaceutical Ingredients Market," which aids in identifying and referencing the specific market segment covered.
12. How do I determine which pricing option suits my needs best?
The pricing options vary based on user requirements and access needs. Individual users may opt for single-user licenses, while businesses requiring broader access may choose multi-user or enterprise licenses for cost-effective access to the report.
13. Are there any additional resources or data provided in the Active Pharmaceutical Ingredients Market report?
While the report offers comprehensive insights, it's advisable to review the specific contents or supplementary materials provided to ascertain if additional resources or data are available.
14. How can I stay updated on further developments or reports in the Active Pharmaceutical Ingredients Market?
To stay informed about further developments, trends, and reports in the Active Pharmaceutical Ingredients Market, consider subscribing to industry newsletters, following relevant companies and organizations, or regularly checking reputable industry news sources and publications.
Methodology
Step 1 - Identification of Relevant Samples Size from Population Database


Step 2 - Approaches for Defining Global Market Size (Value, Volume* & Price*)

Note*: In applicable scenarios
Step 3 - Data Sources
Primary Research
- Web Analytics
- Survey Reports
- Research Institute
- Latest Research Reports
- Opinion Leaders
Secondary Research
- Annual Reports
- White Paper
- Latest Press Release
- Industry Association
- Paid Database
- Investor Presentations

Step 4 - Data Triangulation
Involves using different sources of information in order to increase the validity of a study
These sources are likely to be stakeholders in a program - participants, other researchers, program staff, other community members, and so on.
Then we put all data in single framework & apply various statistical tools to find out the dynamic on the market.
During the analysis stage, feedback from the stakeholder groups would be compared to determine areas of agreement as well as areas of divergence