
Key Insights
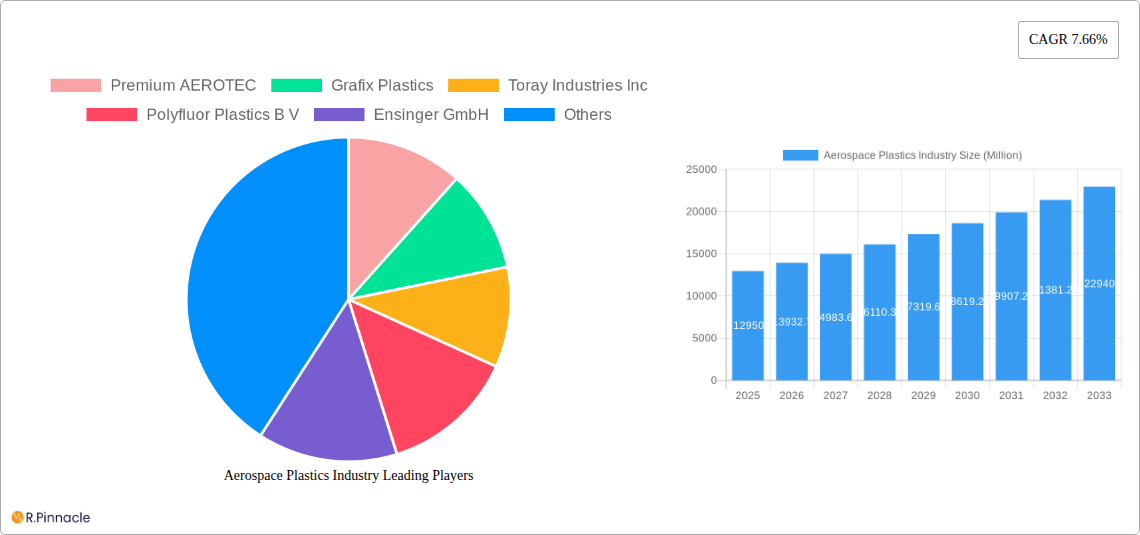
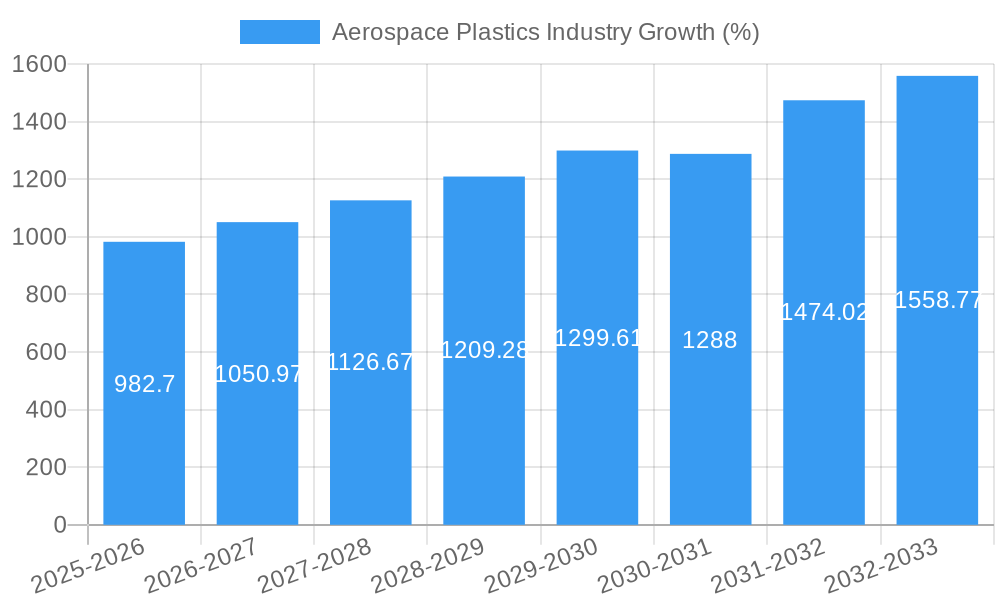
The aerospace plastics market, valued at $12.95 billion in 2025, is projected to experience robust growth, driven by the increasing demand for lightweight yet high-performance materials in aircraft and spacecraft manufacturing. This expansion is fueled by several key factors: the rising adoption of fuel-efficient aircraft designs, the ongoing growth of the commercial aviation sector, and the increasing investment in space exploration initiatives. Lightweight plastics offer significant advantages in reducing fuel consumption and improving aircraft maneuverability, making them a crucial component in modern aerospace engineering. Furthermore, advancements in materials science are leading to the development of stronger, more durable, and heat-resistant plastics, expanding their applications in critical aerospace components like aerostructures, cabin interiors, and propulsion systems. The market segmentation reveals strong growth across all areas, with aerostructures and cabin interiors expected to remain dominant segments due to their high material requirements. Competition is intense, with established players and innovative newcomers vying for market share through product differentiation and strategic partnerships. However, challenges such as material sourcing, supply chain complexities, and stringent regulatory requirements pose potential restraints to market growth.
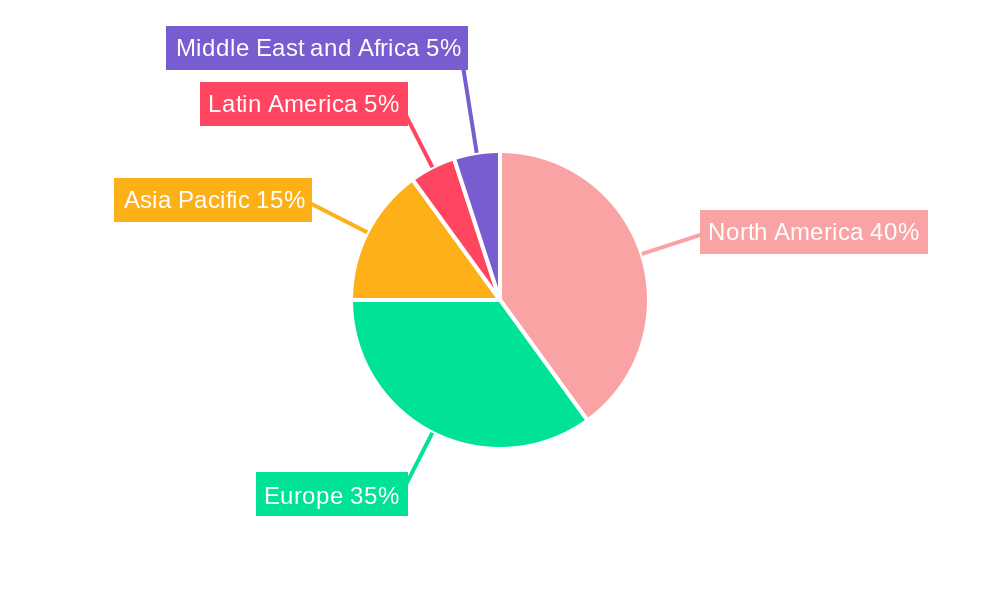
Despite these challenges, the long-term outlook for the aerospace plastics market remains positive. The continued emphasis on sustainability in the aerospace industry, alongside the increasing demand for advanced materials with superior performance characteristics, will drive substantial growth through 2033. Regional growth will be uneven, with North America and Europe maintaining a significant market share due to established manufacturing capabilities and robust aerospace industries. However, Asia Pacific is projected to witness the fastest growth rate, driven by the expansion of its aviation sector and substantial investments in space technology. The market's evolution will be shaped by technological advancements, including the development of advanced composites and bio-based plastics, further enhancing the industry's sustainability and performance capabilities. This will lead to a complex interplay of innovation, regulation, and market demand, presenting both opportunities and challenges for businesses operating in this dynamic sector.
Aerospace Plastics Industry Market Report: 2019-2033
This comprehensive report provides a detailed analysis of the Aerospace Plastics Industry, offering invaluable insights for industry professionals, investors, and strategic decision-makers. The report covers the period from 2019 to 2033, with a focus on the 2025-2033 forecast period. Expect in-depth analysis of market size (reaching xx Million by 2033), growth drivers, challenges, and emerging opportunities within the sector.
Aerospace Plastics Industry Market Structure & Innovation Trends
This section analyzes the competitive landscape, innovation drivers, and regulatory influences shaping the Aerospace Plastics market. The report examines market concentration, revealing the market share held by key players such as Premium AEROTEC, Toray Industries Inc, and Ensinger GmbH. We analyze M&A activity, including significant deals like the USD 780 Million investment by Toray Industries in 2023 to expand carbon fiber production. Further, the impact of Demgy Group's acquisition of E.I.S. Aircraft GmbH in October 2023 is assessed. The report delves into innovation drivers like the increasing demand for lightweight and high-performance materials, the influence of regulatory frameworks on material selection and manufacturing processes, and the role of product substitutes like advanced composites. End-user demographics, focusing on the aviation industry's requirements for performance, safety, and cost-effectiveness, are also examined.
- Market Concentration: Analysis of market share distribution among top players.
- Innovation Drivers: Focus on lightweighting, performance enhancement, and sustainability.
- Regulatory Frameworks: Impact of safety regulations and environmental standards.
- Product Substitutes: Competitive landscape analysis, including alternative materials.
- M&A Activities: Detailed analysis of significant mergers and acquisitions, including deal values and strategic implications (e.g., Toray Industries' USD 780 Million investment).
Aerospace Plastics Industry Market Dynamics & Trends
This section explores the market's dynamic evolution, analyzing growth drivers, technological disruptions, and shifting consumer preferences. Key metrics, including Compound Annual Growth Rate (CAGR) and market penetration rates for various segments (Aerostructure, Cabin Interiors, Propulsion Systems, Satellites), will be presented. The competitive dynamics, including strategies employed by leading players, are examined in detail. The analysis will encompass the impact of technological advancements, such as the development of new polymers and composites, on market growth. The report also investigates consumer preferences and changing demands related to performance, durability, and sustainability within the aerospace sector.
Dominant Regions & Segments in Aerospace Plastics Industry
This section identifies the leading regions and segments within the Aerospace Plastics market. Key drivers for each dominant region or segment (General Aviation, Space, Aerostructure, Cabin Interiors, Propulsion Systems, Satellites) are explored, including economic policies, infrastructure development, and government support. The detailed dominance analysis will provide a clear understanding of why specific regions or segments are outperforming others.
- Leading Region/Country: Analysis focusing on market size, growth drivers, and competitive landscape.
- Dominant Segment (e.g., Aerostructures): Detailed breakdown of market share, growth projections, and competitive dynamics.
- Key Drivers:
- Economic policies supporting aerospace manufacturing.
- Infrastructure supporting research and development.
- Government incentives and regulations.
Aerospace Plastics Industry Product Innovations
This section summarizes recent advancements in aerospace plastics, highlighting key product developments, applications, and competitive advantages. The focus is on technological trends shaping the industry, along with the market fit of new materials and processing techniques. Emphasis will be on innovations driving efficiency, performance gains, and cost reductions.
Report Scope & Segmentation Analysis
The report provides a comprehensive segmentation analysis covering General Aviation, Space, Aerostructure, Cabin Interiors, Propulsion Systems, and Satellites applications within the Aviation end-user sector. Each segment's growth projection, market size (in Millions), and competitive dynamics are analyzed separately. The report will clearly define the scope of the market analysis, ensuring clarity and precision in the presented data.
Key Drivers of Aerospace Plastics Industry Growth
This section identifies the primary factors driving growth in the Aerospace Plastics market, including technological advancements (e.g., the development of high-performance polymers), economic factors (e.g., increasing air travel demand), and favorable regulatory environments. Specific examples will be used to illustrate these drivers.
Challenges in the Aerospace Plastics Industry Sector
This section outlines the challenges facing the Aerospace Plastics industry, including regulatory hurdles, supply chain disruptions, and intense competition. The report will quantify the impact of these barriers on market growth.
Emerging Opportunities in Aerospace Plastics Industry
This section highlights emerging trends and opportunities within the Aerospace Plastics sector, encompassing new market segments, technological advancements, and evolving consumer preferences.
Leading Players in the Aerospace Plastics Industry Market
- Premium AEROTEC
- Grafix Plastics
- Toray Industries Inc
- Polyfluor Plastics B V
- Ensinger GmbH
- Curbell Plastics Inc
- Big Bear Plastic Products Limited
- Zeus Industrial Products Inc
- Paco Plastics Inc
- Loar Group Inc
- 3P Performance Plastics Products
Key Developments in Aerospace Plastics Industry
- January 2023: Toray Industries, Inc. announced a USD 780 Million investment to increase its carbon fiber production capacity by 2025. This significantly impacts the supply of materials for hydrogen fuel tanks and airplanes.
- October 2023: Demgy Group acquired E.I.S. Aircraft GmbH, enhancing its capabilities in high-value-added plastics processing for the aeronautics industry. This consolidation strengthens Demgy's position in the German market.
Future Outlook for Aerospace Plastics Industry Market
This section summarizes the growth accelerators for the Aerospace Plastics market, emphasizing the significant future market potential and strategic opportunities. The analysis highlights the long-term prospects for growth, driven by continued innovation in materials and manufacturing processes, and the ongoing demand for lightweight and high-performance components in the aerospace sector. The report concludes with a summary of key findings and strategic recommendations for players operating within this dynamic market.
Aerospace Plastics Industry Segmentation
- 1. Production Analysis
- 2. Consumption Analysis
- 3. Import Market Analysis (Value & Volume)
- 4. Export Market Analysis (Value & Volume)
- 5. Price Trend Analysis
Aerospace Plastics Industry Segmentation By Geography
-
1. North America
- 1.1. United States
- 1.2. Canada
- 1.3. Mexico
-
2. South America
- 2.1. Brazil
- 2.2. Argentina
- 2.3. Rest of South America
-
3. Europe
- 3.1. United Kingdom
- 3.2. Germany
- 3.3. France
- 3.4. Italy
- 3.5. Spain
- 3.6. Russia
- 3.7. Benelux
- 3.8. Nordics
- 3.9. Rest of Europe
-
4. Middle East & Africa
- 4.1. Turkey
- 4.2. Israel
- 4.3. GCC
- 4.4. North Africa
- 4.5. South Africa
- 4.6. Rest of Middle East & Africa
-
5. Asia Pacific
- 5.1. China
- 5.2. India
- 5.3. Japan
- 5.4. South Korea
- 5.5. ASEAN
- 5.6. Oceania
- 5.7. Rest of Asia Pacific
Aerospace Plastics Industry REPORT HIGHLIGHTS
| Aspects | Details |
|---|---|
| Study Period | 2019-2033 |
| Base Year | 2024 |
| Estimated Year | 2025 |
| Forecast Period | 2025-2033 |
| Historical Period | 2019-2024 |
| Growth Rate | CAGR of 7.66% from 2019-2033 |
| Segmentation |
|
Table of Contents
- 1. Introduction
- 1.1. Research Scope
- 1.2. Market Segmentation
- 1.3. Research Methodology
- 1.4. Definitions and Assumptions
- 2. Executive Summary
- 2.1. Introduction
- 3. Market Dynamics
- 3.1. Introduction
- 3.2. Market Drivers
- 3.2.1. ; Increasing Number Of Air Passengers; Use Of Portable Electronic Devices
- 3.3. Market Restrains
- 3.3.1. ; High Cost Of Connectivity Equipments
- 3.4. Market Trends
- 3.4.1. Cabin Interiors to Witness Higher Growth During the Forecast Period
- 4. Market Factor Analysis
- 4.1. Porters Five Forces
- 4.2. Supply/Value Chain
- 4.3. PESTEL analysis
- 4.4. Market Entropy
- 4.5. Patent/Trademark Analysis
- 5. Global Aerospace Plastics Industry Analysis, Insights and Forecast, 2019-2031
- 5.1. Market Analysis, Insights and Forecast - by Production Analysis
- 5.2. Market Analysis, Insights and Forecast - by Consumption Analysis
- 5.3. Market Analysis, Insights and Forecast - by Import Market Analysis (Value & Volume)
- 5.4. Market Analysis, Insights and Forecast - by Export Market Analysis (Value & Volume)
- 5.5. Market Analysis, Insights and Forecast - by Price Trend Analysis
- 5.6. Market Analysis, Insights and Forecast - by Region
- 5.6.1. North America
- 5.6.2. South America
- 5.6.3. Europe
- 5.6.4. Middle East & Africa
- 5.6.5. Asia Pacific
- 5.1. Market Analysis, Insights and Forecast - by Production Analysis
- 6. North America Aerospace Plastics Industry Analysis, Insights and Forecast, 2019-2031
- 6.1. Market Analysis, Insights and Forecast - by Production Analysis
- 6.2. Market Analysis, Insights and Forecast - by Consumption Analysis
- 6.3. Market Analysis, Insights and Forecast - by Import Market Analysis (Value & Volume)
- 6.4. Market Analysis, Insights and Forecast - by Export Market Analysis (Value & Volume)
- 6.5. Market Analysis, Insights and Forecast - by Price Trend Analysis
- 6.1. Market Analysis, Insights and Forecast - by Production Analysis
- 7. South America Aerospace Plastics Industry Analysis, Insights and Forecast, 2019-2031
- 7.1. Market Analysis, Insights and Forecast - by Production Analysis
- 7.2. Market Analysis, Insights and Forecast - by Consumption Analysis
- 7.3. Market Analysis, Insights and Forecast - by Import Market Analysis (Value & Volume)
- 7.4. Market Analysis, Insights and Forecast - by Export Market Analysis (Value & Volume)
- 7.5. Market Analysis, Insights and Forecast - by Price Trend Analysis
- 7.1. Market Analysis, Insights and Forecast - by Production Analysis
- 8. Europe Aerospace Plastics Industry Analysis, Insights and Forecast, 2019-2031
- 8.1. Market Analysis, Insights and Forecast - by Production Analysis
- 8.2. Market Analysis, Insights and Forecast - by Consumption Analysis
- 8.3. Market Analysis, Insights and Forecast - by Import Market Analysis (Value & Volume)
- 8.4. Market Analysis, Insights and Forecast - by Export Market Analysis (Value & Volume)
- 8.5. Market Analysis, Insights and Forecast - by Price Trend Analysis
- 8.1. Market Analysis, Insights and Forecast - by Production Analysis
- 9. Middle East & Africa Aerospace Plastics Industry Analysis, Insights and Forecast, 2019-2031
- 9.1. Market Analysis, Insights and Forecast - by Production Analysis
- 9.2. Market Analysis, Insights and Forecast - by Consumption Analysis
- 9.3. Market Analysis, Insights and Forecast - by Import Market Analysis (Value & Volume)
- 9.4. Market Analysis, Insights and Forecast - by Export Market Analysis (Value & Volume)
- 9.5. Market Analysis, Insights and Forecast - by Price Trend Analysis
- 9.1. Market Analysis, Insights and Forecast - by Production Analysis
- 10. Asia Pacific Aerospace Plastics Industry Analysis, Insights and Forecast, 2019-2031
- 10.1. Market Analysis, Insights and Forecast - by Production Analysis
- 10.2. Market Analysis, Insights and Forecast - by Consumption Analysis
- 10.3. Market Analysis, Insights and Forecast - by Import Market Analysis (Value & Volume)
- 10.4. Market Analysis, Insights and Forecast - by Export Market Analysis (Value & Volume)
- 10.5. Market Analysis, Insights and Forecast - by Price Trend Analysis
- 10.1. Market Analysis, Insights and Forecast - by Production Analysis
- 11. North America Aerospace Plastics Industry Analysis, Insights and Forecast, 2019-2031
- 11.1. Market Analysis, Insights and Forecast - By Country/Sub-region
- 11.1.1 United States
- 11.1.2 Canada
- 12. Europe Aerospace Plastics Industry Analysis, Insights and Forecast, 2019-2031
- 12.1. Market Analysis, Insights and Forecast - By Country/Sub-region
- 12.1.1 United Kingdom
- 12.1.2 France
- 12.1.3 Germany
- 12.1.4 Russia
- 12.1.5 Rest of Europe
- 13. Asia Pacific Aerospace Plastics Industry Analysis, Insights and Forecast, 2019-2031
- 13.1. Market Analysis, Insights and Forecast - By Country/Sub-region
- 13.1.1 China
- 13.1.2 India
- 13.1.3 Japan
- 13.1.4 South Korea
- 13.1.5 Rest of Asia Pacific
- 14. Latin America Aerospace Plastics Industry Analysis, Insights and Forecast, 2019-2031
- 14.1. Market Analysis, Insights and Forecast - By Country/Sub-region
- 14.1.1 Brazil
- 14.1.2 Rest of Latin America
- 15. Middle East and Africa Aerospace Plastics Industry Analysis, Insights and Forecast, 2019-2031
- 15.1. Market Analysis, Insights and Forecast - By Country/Sub-region
- 15.1.1 Saudi Arabia
- 15.1.2 United Arab Emirates
- 15.1.3 Turkey
- 15.1.4 Rest of Middle East and Africa
- 16. Competitive Analysis
- 16.1. Global Market Share Analysis 2024
- 16.2. Company Profiles
- 16.2.1 Premium AEROTEC
- 16.2.1.1. Overview
- 16.2.1.2. Products
- 16.2.1.3. SWOT Analysis
- 16.2.1.4. Recent Developments
- 16.2.1.5. Financials (Based on Availability)
- 16.2.2 Grafix Plastics
- 16.2.2.1. Overview
- 16.2.2.2. Products
- 16.2.2.3. SWOT Analysis
- 16.2.2.4. Recent Developments
- 16.2.2.5. Financials (Based on Availability)
- 16.2.3 Toray Industries Inc
- 16.2.3.1. Overview
- 16.2.3.2. Products
- 16.2.3.3. SWOT Analysis
- 16.2.3.4. Recent Developments
- 16.2.3.5. Financials (Based on Availability)
- 16.2.4 Polyfluor Plastics B V
- 16.2.4.1. Overview
- 16.2.4.2. Products
- 16.2.4.3. SWOT Analysis
- 16.2.4.4. Recent Developments
- 16.2.4.5. Financials (Based on Availability)
- 16.2.5 Ensinger GmbH
- 16.2.5.1. Overview
- 16.2.5.2. Products
- 16.2.5.3. SWOT Analysis
- 16.2.5.4. Recent Developments
- 16.2.5.5. Financials (Based on Availability)
- 16.2.6 Curbell Plastics Inc
- 16.2.6.1. Overview
- 16.2.6.2. Products
- 16.2.6.3. SWOT Analysis
- 16.2.6.4. Recent Developments
- 16.2.6.5. Financials (Based on Availability)
- 16.2.7 Big Bear Plastic Products Limited
- 16.2.7.1. Overview
- 16.2.7.2. Products
- 16.2.7.3. SWOT Analysis
- 16.2.7.4. Recent Developments
- 16.2.7.5. Financials (Based on Availability)
- 16.2.8 Zeus Industrial Products Inc
- 16.2.8.1. Overview
- 16.2.8.2. Products
- 16.2.8.3. SWOT Analysis
- 16.2.8.4. Recent Developments
- 16.2.8.5. Financials (Based on Availability)
- 16.2.9 Paco Plastics Inc
- 16.2.9.1. Overview
- 16.2.9.2. Products
- 16.2.9.3. SWOT Analysis
- 16.2.9.4. Recent Developments
- 16.2.9.5. Financials (Based on Availability)
- 16.2.10 Loar Group Inc
- 16.2.10.1. Overview
- 16.2.10.2. Products
- 16.2.10.3. SWOT Analysis
- 16.2.10.4. Recent Developments
- 16.2.10.5. Financials (Based on Availability)
- 16.2.11 3P Performance Plastics Products
- 16.2.11.1. Overview
- 16.2.11.2. Products
- 16.2.11.3. SWOT Analysis
- 16.2.11.4. Recent Developments
- 16.2.11.5. Financials (Based on Availability)
- 16.2.1 Premium AEROTEC
List of Figures
- Figure 1: Global Aerospace Plastics Industry Revenue Breakdown (Million, %) by Region 2024 & 2032
- Figure 2: North America Aerospace Plastics Industry Revenue (Million), by Country 2024 & 2032
- Figure 3: North America Aerospace Plastics Industry Revenue Share (%), by Country 2024 & 2032
- Figure 4: Europe Aerospace Plastics Industry Revenue (Million), by Country 2024 & 2032
- Figure 5: Europe Aerospace Plastics Industry Revenue Share (%), by Country 2024 & 2032
- Figure 6: Asia Pacific Aerospace Plastics Industry Revenue (Million), by Country 2024 & 2032
- Figure 7: Asia Pacific Aerospace Plastics Industry Revenue Share (%), by Country 2024 & 2032
- Figure 8: Latin America Aerospace Plastics Industry Revenue (Million), by Country 2024 & 2032
- Figure 9: Latin America Aerospace Plastics Industry Revenue Share (%), by Country 2024 & 2032
- Figure 10: Middle East and Africa Aerospace Plastics Industry Revenue (Million), by Country 2024 & 2032
- Figure 11: Middle East and Africa Aerospace Plastics Industry Revenue Share (%), by Country 2024 & 2032
- Figure 12: North America Aerospace Plastics Industry Revenue (Million), by Production Analysis 2024 & 2032
- Figure 13: North America Aerospace Plastics Industry Revenue Share (%), by Production Analysis 2024 & 2032
- Figure 14: North America Aerospace Plastics Industry Revenue (Million), by Consumption Analysis 2024 & 2032
- Figure 15: North America Aerospace Plastics Industry Revenue Share (%), by Consumption Analysis 2024 & 2032
- Figure 16: North America Aerospace Plastics Industry Revenue (Million), by Import Market Analysis (Value & Volume) 2024 & 2032
- Figure 17: North America Aerospace Plastics Industry Revenue Share (%), by Import Market Analysis (Value & Volume) 2024 & 2032
- Figure 18: North America Aerospace Plastics Industry Revenue (Million), by Export Market Analysis (Value & Volume) 2024 & 2032
- Figure 19: North America Aerospace Plastics Industry Revenue Share (%), by Export Market Analysis (Value & Volume) 2024 & 2032
- Figure 20: North America Aerospace Plastics Industry Revenue (Million), by Price Trend Analysis 2024 & 2032
- Figure 21: North America Aerospace Plastics Industry Revenue Share (%), by Price Trend Analysis 2024 & 2032
- Figure 22: North America Aerospace Plastics Industry Revenue (Million), by Country 2024 & 2032
- Figure 23: North America Aerospace Plastics Industry Revenue Share (%), by Country 2024 & 2032
- Figure 24: South America Aerospace Plastics Industry Revenue (Million), by Production Analysis 2024 & 2032
- Figure 25: South America Aerospace Plastics Industry Revenue Share (%), by Production Analysis 2024 & 2032
- Figure 26: South America Aerospace Plastics Industry Revenue (Million), by Consumption Analysis 2024 & 2032
- Figure 27: South America Aerospace Plastics Industry Revenue Share (%), by Consumption Analysis 2024 & 2032
- Figure 28: South America Aerospace Plastics Industry Revenue (Million), by Import Market Analysis (Value & Volume) 2024 & 2032
- Figure 29: South America Aerospace Plastics Industry Revenue Share (%), by Import Market Analysis (Value & Volume) 2024 & 2032
- Figure 30: South America Aerospace Plastics Industry Revenue (Million), by Export Market Analysis (Value & Volume) 2024 & 2032
- Figure 31: South America Aerospace Plastics Industry Revenue Share (%), by Export Market Analysis (Value & Volume) 2024 & 2032
- Figure 32: South America Aerospace Plastics Industry Revenue (Million), by Price Trend Analysis 2024 & 2032
- Figure 33: South America Aerospace Plastics Industry Revenue Share (%), by Price Trend Analysis 2024 & 2032
- Figure 34: South America Aerospace Plastics Industry Revenue (Million), by Country 2024 & 2032
- Figure 35: South America Aerospace Plastics Industry Revenue Share (%), by Country 2024 & 2032
- Figure 36: Europe Aerospace Plastics Industry Revenue (Million), by Production Analysis 2024 & 2032
- Figure 37: Europe Aerospace Plastics Industry Revenue Share (%), by Production Analysis 2024 & 2032
- Figure 38: Europe Aerospace Plastics Industry Revenue (Million), by Consumption Analysis 2024 & 2032
- Figure 39: Europe Aerospace Plastics Industry Revenue Share (%), by Consumption Analysis 2024 & 2032
- Figure 40: Europe Aerospace Plastics Industry Revenue (Million), by Import Market Analysis (Value & Volume) 2024 & 2032
- Figure 41: Europe Aerospace Plastics Industry Revenue Share (%), by Import Market Analysis (Value & Volume) 2024 & 2032
- Figure 42: Europe Aerospace Plastics Industry Revenue (Million), by Export Market Analysis (Value & Volume) 2024 & 2032
- Figure 43: Europe Aerospace Plastics Industry Revenue Share (%), by Export Market Analysis (Value & Volume) 2024 & 2032
- Figure 44: Europe Aerospace Plastics Industry Revenue (Million), by Price Trend Analysis 2024 & 2032
- Figure 45: Europe Aerospace Plastics Industry Revenue Share (%), by Price Trend Analysis 2024 & 2032
- Figure 46: Europe Aerospace Plastics Industry Revenue (Million), by Country 2024 & 2032
- Figure 47: Europe Aerospace Plastics Industry Revenue Share (%), by Country 2024 & 2032
- Figure 48: Middle East & Africa Aerospace Plastics Industry Revenue (Million), by Production Analysis 2024 & 2032
- Figure 49: Middle East & Africa Aerospace Plastics Industry Revenue Share (%), by Production Analysis 2024 & 2032
- Figure 50: Middle East & Africa Aerospace Plastics Industry Revenue (Million), by Consumption Analysis 2024 & 2032
- Figure 51: Middle East & Africa Aerospace Plastics Industry Revenue Share (%), by Consumption Analysis 2024 & 2032
- Figure 52: Middle East & Africa Aerospace Plastics Industry Revenue (Million), by Import Market Analysis (Value & Volume) 2024 & 2032
- Figure 53: Middle East & Africa Aerospace Plastics Industry Revenue Share (%), by Import Market Analysis (Value & Volume) 2024 & 2032
- Figure 54: Middle East & Africa Aerospace Plastics Industry Revenue (Million), by Export Market Analysis (Value & Volume) 2024 & 2032
- Figure 55: Middle East & Africa Aerospace Plastics Industry Revenue Share (%), by Export Market Analysis (Value & Volume) 2024 & 2032
- Figure 56: Middle East & Africa Aerospace Plastics Industry Revenue (Million), by Price Trend Analysis 2024 & 2032
- Figure 57: Middle East & Africa Aerospace Plastics Industry Revenue Share (%), by Price Trend Analysis 2024 & 2032
- Figure 58: Middle East & Africa Aerospace Plastics Industry Revenue (Million), by Country 2024 & 2032
- Figure 59: Middle East & Africa Aerospace Plastics Industry Revenue Share (%), by Country 2024 & 2032
- Figure 60: Asia Pacific Aerospace Plastics Industry Revenue (Million), by Production Analysis 2024 & 2032
- Figure 61: Asia Pacific Aerospace Plastics Industry Revenue Share (%), by Production Analysis 2024 & 2032
- Figure 62: Asia Pacific Aerospace Plastics Industry Revenue (Million), by Consumption Analysis 2024 & 2032
- Figure 63: Asia Pacific Aerospace Plastics Industry Revenue Share (%), by Consumption Analysis 2024 & 2032
- Figure 64: Asia Pacific Aerospace Plastics Industry Revenue (Million), by Import Market Analysis (Value & Volume) 2024 & 2032
- Figure 65: Asia Pacific Aerospace Plastics Industry Revenue Share (%), by Import Market Analysis (Value & Volume) 2024 & 2032
- Figure 66: Asia Pacific Aerospace Plastics Industry Revenue (Million), by Export Market Analysis (Value & Volume) 2024 & 2032
- Figure 67: Asia Pacific Aerospace Plastics Industry Revenue Share (%), by Export Market Analysis (Value & Volume) 2024 & 2032
- Figure 68: Asia Pacific Aerospace Plastics Industry Revenue (Million), by Price Trend Analysis 2024 & 2032
- Figure 69: Asia Pacific Aerospace Plastics Industry Revenue Share (%), by Price Trend Analysis 2024 & 2032
- Figure 70: Asia Pacific Aerospace Plastics Industry Revenue (Million), by Country 2024 & 2032
- Figure 71: Asia Pacific Aerospace Plastics Industry Revenue Share (%), by Country 2024 & 2032
List of Tables
- Table 1: Global Aerospace Plastics Industry Revenue Million Forecast, by Region 2019 & 2032
- Table 2: Global Aerospace Plastics Industry Revenue Million Forecast, by Production Analysis 2019 & 2032
- Table 3: Global Aerospace Plastics Industry Revenue Million Forecast, by Consumption Analysis 2019 & 2032
- Table 4: Global Aerospace Plastics Industry Revenue Million Forecast, by Import Market Analysis (Value & Volume) 2019 & 2032
- Table 5: Global Aerospace Plastics Industry Revenue Million Forecast, by Export Market Analysis (Value & Volume) 2019 & 2032
- Table 6: Global Aerospace Plastics Industry Revenue Million Forecast, by Price Trend Analysis 2019 & 2032
- Table 7: Global Aerospace Plastics Industry Revenue Million Forecast, by Region 2019 & 2032
- Table 8: Global Aerospace Plastics Industry Revenue Million Forecast, by Country 2019 & 2032
- Table 9: United States Aerospace Plastics Industry Revenue (Million) Forecast, by Application 2019 & 2032
- Table 10: Canada Aerospace Plastics Industry Revenue (Million) Forecast, by Application 2019 & 2032
- Table 11: Global Aerospace Plastics Industry Revenue Million Forecast, by Country 2019 & 2032
- Table 12: United Kingdom Aerospace Plastics Industry Revenue (Million) Forecast, by Application 2019 & 2032
- Table 13: France Aerospace Plastics Industry Revenue (Million) Forecast, by Application 2019 & 2032
- Table 14: Germany Aerospace Plastics Industry Revenue (Million) Forecast, by Application 2019 & 2032
- Table 15: Russia Aerospace Plastics Industry Revenue (Million) Forecast, by Application 2019 & 2032
- Table 16: Rest of Europe Aerospace Plastics Industry Revenue (Million) Forecast, by Application 2019 & 2032
- Table 17: Global Aerospace Plastics Industry Revenue Million Forecast, by Country 2019 & 2032
- Table 18: China Aerospace Plastics Industry Revenue (Million) Forecast, by Application 2019 & 2032
- Table 19: India Aerospace Plastics Industry Revenue (Million) Forecast, by Application 2019 & 2032
- Table 20: Japan Aerospace Plastics Industry Revenue (Million) Forecast, by Application 2019 & 2032
- Table 21: South Korea Aerospace Plastics Industry Revenue (Million) Forecast, by Application 2019 & 2032
- Table 22: Rest of Asia Pacific Aerospace Plastics Industry Revenue (Million) Forecast, by Application 2019 & 2032
- Table 23: Global Aerospace Plastics Industry Revenue Million Forecast, by Country 2019 & 2032
- Table 24: Brazil Aerospace Plastics Industry Revenue (Million) Forecast, by Application 2019 & 2032
- Table 25: Rest of Latin America Aerospace Plastics Industry Revenue (Million) Forecast, by Application 2019 & 2032
- Table 26: Global Aerospace Plastics Industry Revenue Million Forecast, by Country 2019 & 2032
- Table 27: Saudi Arabia Aerospace Plastics Industry Revenue (Million) Forecast, by Application 2019 & 2032
- Table 28: United Arab Emirates Aerospace Plastics Industry Revenue (Million) Forecast, by Application 2019 & 2032
- Table 29: Turkey Aerospace Plastics Industry Revenue (Million) Forecast, by Application 2019 & 2032
- Table 30: Rest of Middle East and Africa Aerospace Plastics Industry Revenue (Million) Forecast, by Application 2019 & 2032
- Table 31: Global Aerospace Plastics Industry Revenue Million Forecast, by Production Analysis 2019 & 2032
- Table 32: Global Aerospace Plastics Industry Revenue Million Forecast, by Consumption Analysis 2019 & 2032
- Table 33: Global Aerospace Plastics Industry Revenue Million Forecast, by Import Market Analysis (Value & Volume) 2019 & 2032
- Table 34: Global Aerospace Plastics Industry Revenue Million Forecast, by Export Market Analysis (Value & Volume) 2019 & 2032
- Table 35: Global Aerospace Plastics Industry Revenue Million Forecast, by Price Trend Analysis 2019 & 2032
- Table 36: Global Aerospace Plastics Industry Revenue Million Forecast, by Country 2019 & 2032
- Table 37: United States Aerospace Plastics Industry Revenue (Million) Forecast, by Application 2019 & 2032
- Table 38: Canada Aerospace Plastics Industry Revenue (Million) Forecast, by Application 2019 & 2032
- Table 39: Mexico Aerospace Plastics Industry Revenue (Million) Forecast, by Application 2019 & 2032
- Table 40: Global Aerospace Plastics Industry Revenue Million Forecast, by Production Analysis 2019 & 2032
- Table 41: Global Aerospace Plastics Industry Revenue Million Forecast, by Consumption Analysis 2019 & 2032
- Table 42: Global Aerospace Plastics Industry Revenue Million Forecast, by Import Market Analysis (Value & Volume) 2019 & 2032
- Table 43: Global Aerospace Plastics Industry Revenue Million Forecast, by Export Market Analysis (Value & Volume) 2019 & 2032
- Table 44: Global Aerospace Plastics Industry Revenue Million Forecast, by Price Trend Analysis 2019 & 2032
- Table 45: Global Aerospace Plastics Industry Revenue Million Forecast, by Country 2019 & 2032
- Table 46: Brazil Aerospace Plastics Industry Revenue (Million) Forecast, by Application 2019 & 2032
- Table 47: Argentina Aerospace Plastics Industry Revenue (Million) Forecast, by Application 2019 & 2032
- Table 48: Rest of South America Aerospace Plastics Industry Revenue (Million) Forecast, by Application 2019 & 2032
- Table 49: Global Aerospace Plastics Industry Revenue Million Forecast, by Production Analysis 2019 & 2032
- Table 50: Global Aerospace Plastics Industry Revenue Million Forecast, by Consumption Analysis 2019 & 2032
- Table 51: Global Aerospace Plastics Industry Revenue Million Forecast, by Import Market Analysis (Value & Volume) 2019 & 2032
- Table 52: Global Aerospace Plastics Industry Revenue Million Forecast, by Export Market Analysis (Value & Volume) 2019 & 2032
- Table 53: Global Aerospace Plastics Industry Revenue Million Forecast, by Price Trend Analysis 2019 & 2032
- Table 54: Global Aerospace Plastics Industry Revenue Million Forecast, by Country 2019 & 2032
- Table 55: United Kingdom Aerospace Plastics Industry Revenue (Million) Forecast, by Application 2019 & 2032
- Table 56: Germany Aerospace Plastics Industry Revenue (Million) Forecast, by Application 2019 & 2032
- Table 57: France Aerospace Plastics Industry Revenue (Million) Forecast, by Application 2019 & 2032
- Table 58: Italy Aerospace Plastics Industry Revenue (Million) Forecast, by Application 2019 & 2032
- Table 59: Spain Aerospace Plastics Industry Revenue (Million) Forecast, by Application 2019 & 2032
- Table 60: Russia Aerospace Plastics Industry Revenue (Million) Forecast, by Application 2019 & 2032
- Table 61: Benelux Aerospace Plastics Industry Revenue (Million) Forecast, by Application 2019 & 2032
- Table 62: Nordics Aerospace Plastics Industry Revenue (Million) Forecast, by Application 2019 & 2032
- Table 63: Rest of Europe Aerospace Plastics Industry Revenue (Million) Forecast, by Application 2019 & 2032
- Table 64: Global Aerospace Plastics Industry Revenue Million Forecast, by Production Analysis 2019 & 2032
- Table 65: Global Aerospace Plastics Industry Revenue Million Forecast, by Consumption Analysis 2019 & 2032
- Table 66: Global Aerospace Plastics Industry Revenue Million Forecast, by Import Market Analysis (Value & Volume) 2019 & 2032
- Table 67: Global Aerospace Plastics Industry Revenue Million Forecast, by Export Market Analysis (Value & Volume) 2019 & 2032
- Table 68: Global Aerospace Plastics Industry Revenue Million Forecast, by Price Trend Analysis 2019 & 2032
- Table 69: Global Aerospace Plastics Industry Revenue Million Forecast, by Country 2019 & 2032
- Table 70: Turkey Aerospace Plastics Industry Revenue (Million) Forecast, by Application 2019 & 2032
- Table 71: Israel Aerospace Plastics Industry Revenue (Million) Forecast, by Application 2019 & 2032
- Table 72: GCC Aerospace Plastics Industry Revenue (Million) Forecast, by Application 2019 & 2032
- Table 73: North Africa Aerospace Plastics Industry Revenue (Million) Forecast, by Application 2019 & 2032
- Table 74: South Africa Aerospace Plastics Industry Revenue (Million) Forecast, by Application 2019 & 2032
- Table 75: Rest of Middle East & Africa Aerospace Plastics Industry Revenue (Million) Forecast, by Application 2019 & 2032
- Table 76: Global Aerospace Plastics Industry Revenue Million Forecast, by Production Analysis 2019 & 2032
- Table 77: Global Aerospace Plastics Industry Revenue Million Forecast, by Consumption Analysis 2019 & 2032
- Table 78: Global Aerospace Plastics Industry Revenue Million Forecast, by Import Market Analysis (Value & Volume) 2019 & 2032
- Table 79: Global Aerospace Plastics Industry Revenue Million Forecast, by Export Market Analysis (Value & Volume) 2019 & 2032
- Table 80: Global Aerospace Plastics Industry Revenue Million Forecast, by Price Trend Analysis 2019 & 2032
- Table 81: Global Aerospace Plastics Industry Revenue Million Forecast, by Country 2019 & 2032
- Table 82: China Aerospace Plastics Industry Revenue (Million) Forecast, by Application 2019 & 2032
- Table 83: India Aerospace Plastics Industry Revenue (Million) Forecast, by Application 2019 & 2032
- Table 84: Japan Aerospace Plastics Industry Revenue (Million) Forecast, by Application 2019 & 2032
- Table 85: South Korea Aerospace Plastics Industry Revenue (Million) Forecast, by Application 2019 & 2032
- Table 86: ASEAN Aerospace Plastics Industry Revenue (Million) Forecast, by Application 2019 & 2032
- Table 87: Oceania Aerospace Plastics Industry Revenue (Million) Forecast, by Application 2019 & 2032
- Table 88: Rest of Asia Pacific Aerospace Plastics Industry Revenue (Million) Forecast, by Application 2019 & 2032
Frequently Asked Questions
1. What is the projected Compound Annual Growth Rate (CAGR) of the Aerospace Plastics Industry?
The projected CAGR is approximately 7.66%.
2. Which companies are prominent players in the Aerospace Plastics Industry?
Key companies in the market include Premium AEROTEC, Grafix Plastics, Toray Industries Inc, Polyfluor Plastics B V, Ensinger GmbH, Curbell Plastics Inc, Big Bear Plastic Products Limited, Zeus Industrial Products Inc, Paco Plastics Inc, Loar Group Inc, 3P Performance Plastics Products.
3. What are the main segments of the Aerospace Plastics Industry?
The market segments include Production Analysis, Consumption Analysis, Import Market Analysis (Value & Volume), Export Market Analysis (Value & Volume), Price Trend Analysis.
4. Can you provide details about the market size?
The market size is estimated to be USD 12.95 Million as of 2022.
5. What are some drivers contributing to market growth?
; Increasing Number Of Air Passengers; Use Of Portable Electronic Devices.
6. What are the notable trends driving market growth?
Cabin Interiors to Witness Higher Growth During the Forecast Period.
7. Are there any restraints impacting market growth?
; High Cost Of Connectivity Equipments.
8. Can you provide examples of recent developments in the market?
In January 2023, Toray Industries, Inc. announced a USD 780 million investment towards increasing its production capacity for carbon fiber materials used in hydrogen fuel tanks and airplanes by 2025.
9. What pricing options are available for accessing the report?
Pricing options include single-user, multi-user, and enterprise licenses priced at USD 4750, USD 5250, and USD 8750 respectively.
10. Is the market size provided in terms of value or volume?
The market size is provided in terms of value, measured in Million.
11. Are there any specific market keywords associated with the report?
Yes, the market keyword associated with the report is "Aerospace Plastics Industry," which aids in identifying and referencing the specific market segment covered.
12. How do I determine which pricing option suits my needs best?
The pricing options vary based on user requirements and access needs. Individual users may opt for single-user licenses, while businesses requiring broader access may choose multi-user or enterprise licenses for cost-effective access to the report.
13. Are there any additional resources or data provided in the Aerospace Plastics Industry report?
While the report offers comprehensive insights, it's advisable to review the specific contents or supplementary materials provided to ascertain if additional resources or data are available.
14. How can I stay updated on further developments or reports in the Aerospace Plastics Industry?
To stay informed about further developments, trends, and reports in the Aerospace Plastics Industry, consider subscribing to industry newsletters, following relevant companies and organizations, or regularly checking reputable industry news sources and publications.
Methodology
Step 1 - Identification of Relevant Samples Size from Population Database


Step 2 - Approaches for Defining Global Market Size (Value, Volume* & Price*)

Note*: In applicable scenarios
Step 3 - Data Sources
Primary Research
- Web Analytics
- Survey Reports
- Research Institute
- Latest Research Reports
- Opinion Leaders
Secondary Research
- Annual Reports
- White Paper
- Latest Press Release
- Industry Association
- Paid Database
- Investor Presentations

Step 4 - Data Triangulation
Involves using different sources of information in order to increase the validity of a study
These sources are likely to be stakeholders in a program - participants, other researchers, program staff, other community members, and so on.
Then we put all data in single framework & apply various statistical tools to find out the dynamic on the market.
During the analysis stage, feedback from the stakeholder groups would be compared to determine areas of agreement as well as areas of divergence


